A golden cross is when the asset’s 50-day simple moving average (SMA) crosses above its 200-day SMA.
Such an event indicates that this asset’s prices have been climbing of late, enough to be higher than its longer-term average.
At the time of writing, the gap between those two widely-followed technical indicators now stand at less than 4 points on the SP500m.
When it happens, the “golden cross” tends to send a “bullish” signal to traders, suggesting there could be more gains in store.
NOTE: The S&P 500 index is a benchmark which measures the overall performance of US stock markets.
How has SP500m performed after forming a “golden cross”?
Here’s how the SP500m has fared following its past three “golden crosses”:
July 2020: S&P 500 climbed by a further 50%, culminating in its current record high registered over a year ago, in early January 2022.
End-March 2019: S&P 500 climbed by another20% as it came tantalisingly close to the 3400 mark, before the steep dropoff in February 2020 as the Covid-19 pandemic gripped global markets.
April 2016: S&P 500 advanced by another 40% until its then-peak in September 2018
Upcoming events that could rock the SP500m:
1) Federal Reserve decision: Feb 1
The world’s most important central bank is back in action again next week.
On February 1st, the Fed is due to announce how much higher it will send US interest rates.
At the time of writing, market forecasts are based on the following:
Fed will hike by 25 basis points (bps) on Feb 2nd.
Fed will hike again by a further 25 bps sometime after next week’s meeting, but no later than June 2023.
That would bring US interest rates from the current 4.5% up to around 5%.
The Fed will then keep its benchmark rate at around that 5% mark for a while, before cutting interest rates later this year.
Note that, generally, many asset classes such as stocks, gold, and even cryptos do not enjoy US interest rates moving higher.
Hence, if the Fed signals its intentions to move US interest rates even higher past the market-forecasted 5%, that could drag the SP500m lower.
However, if the Fed signals that it’s indeed ready to pause its rate hikes, that could translate into more gains for the SP500m.
2) Big Tech Earnings: Feb 2nd
Apple, Alphabet (Google’s parent company), and Amazon are all due to report their respective earnings from Q4 2022.
What are “earnings” and why does it matter?
These quarterly earnings announcements are when public-listed companies reveal just how good a job they did at earning profits over the prior quarter.
Markets tend to “reward” the companies whose earnings either came in better than expected, or are confident about their ability to keep earning higher profits in the near future.
The reward = traders and investors buy up these stocks and send their prices higher.
However, if the company’s financial performance disappointed markets, or if the company’s management are concerned about tougher times ahead for the business, that could prompt markets to sell the stock and send its share price lower.
Why are earnings out of Apple, Alphabet, Amazon so important for the S&P 500?
Note that these stocks are some of the biggest in the world.
Combined, all three stocks have a market cap of almost 4.5 Trillion (with a “T”) US dollars. That accounts for almost 13% of the S&P 500’s total market cap of about US$35 trillion (as of market close on January 25th).
Hence, given their enormous size, how markets react to the earnings out of these 3 tech titans should have a major impact on how the S&P 500 performs as a whole.
Note that all 3 will report their respective earnings after US markets close a week from today – Thursday, February 2nd.
Hence, expect to see a major reaction in the S&P 500 when the US stock market reopens on February 3rd – the day following the earnings release by Apple, Alphabet, and Amazon.
What’s next after golden cross?
If such a bullish technical event does happen for the SP500m, equity bulls (those hoping stocks will move higher) will be looking to next conquer the following resistance levels:
4060: downward upper trendline that began since January 2022 record high.
4105.6: early December cycle high
4144.2: December 13th intraday peak
A closing price above the 4144.2 intraday peak would signal a bullish breakout of the year-long downtrend.
Such price action may well entice even more stock bulls back to the fore.
However, if market sentiment turns sour that could drag the S&P 500 back below the psychologically-important 4,000 mark.
From a fundamental perspective, this could be due to any of the following:
disappointing US earnings
a still-hawkish Fed
growing fears of a US recession
other risk-off events
If so, then the following support levels will start to likely tempting to equity bears (those who believe that stock prices will fall):
Investment from VC investors PUSH Ventures and aws Gründerfonds
Investment & planned strategic partnership with Erste Group
25 JANUARY 2023: Valutico, the web-based valuation platform, announces that it has closed its first financing round with outside investors. Existing investors also participated in the round, totalling equity funding in the mid 7-figures.
Investments from Venture Capital firms PUSH Ventures and aws Gründerfonds will make a substantial impact on the business, not only from a product and service perspective but also by gaining their invaluable expertise.
Vienna-based Erste Group is also participating in the financing round and intends to enter into a strategic partnership with Valutico to help further digitalize the bank’s processes around valuation and corporate lending.
Valutico will apply the funding raised in this round of financing to further accelerate its growth, deliver on its product roadmap, and grow its product and engineering teams.
Valutico provides software for data-driven valuation analysis
Valutico serves the Financial Services and Investment Management industries with data-driven tools to conduct valuation analysis more efficiently. In an area dominated by slow and error-prone spreadsheets, Valutico empowers businesses and experts to perform accurate valuations in a fraction of the time it used to take while solving the issue of complex tools, lack of data sources and time-consuming reporting. Valutico’s globally distributed and fast-growing team of 60 employees currently proudly serves around 600 clients in over 85 countries.
Recent innovative product extensions of the existing valuation models, which currently focus on the financial value of a company, include the integration of the Capitalised Earnings Method and Venture Capital (VC) Method. But Valutico is also working on a robust qualitative and quantitative module for the holistic assessment of an organisation’s impact on the environment, society and governance (‘ESG’).
Paul Resch, Co-Founder & CEO comments:
“The new funding rounds off an outstanding year for the company and will allow us to double down on our growth path and continue to innovate around the question of what “value” means in a business context. The benefits of Valutico’s platform are already being felt across the financial landscape and this recent funding helps us strengthen our offering and broaden our positive impact. We are using this opportunity to reinforce our commitment to our clients and we look forward to the road ahead!”
Laurenz Simbruner, Founding Partner at PUSH Ventures comments:
“Paul and the team have shown an impressive track record building a fantastic product for a global audience of business customers. We are super excited to support Valutico on its way to becoming a world leader in the financial services software industry.”
Christoph Haimberger, Managing Director, aws Gründerfonds comments:
“Our investment allows Valutico to grow beyond legacy valuation tools, in ESG and digital usability. A value-driven combination of our investment thesis into “Green Winners” and “Digital Winners”. We are thrilled to be part of the journey with the outstanding and globally ambitious Valutico team.“
Ingo Bleier, Board Member for Corporates Banking & Markets at Erste Group comments:
“At Erste, we are committed to improving our ability to analyse and apply data in order to gain a better understanding of our customers’ needs and to develop our offering accordingly. That’s why we are exploring how Valutico‘s innovative valuation platform can help us to further digitalize part of our process in the corporate banking and underwriting business.”
About Valutico
Valutico is the world’s leading valuation platform. Valutico’s all-in-one software allows finance professionals to value a company in minutes, by providing data-driven tools to conduct analyses faster and more accurately.
Used by more than 600 financial firms in 85 countries, Valutico is an emerging force in the world of business valuations. The powerful platform is popular amongst professionals in advisory roles such as in Corporate Finance, M&A, and Tax and Audit, as well as Investment Managers in Private Equity, Venture Capitalists, and Family Offices. Large corporations also use Valutico for Strategy, Financial Reporting, and Investor Relations.
Founded in 2017, and headquartered in Vienna with subsidiaries in the US and UK, Valutico operates worldwide with an ever-expanding network of valuation practitioners who use Valutico’s platform, consultancy services, and valuation trainings. Valutico’s mission is to make the complex process of company valuations simple, and to support accurate valuations for a well-functioning economy.
About aws Gründerfonds
The aws Gründerfonds is an Austrian venture capital company and has at its disposal investment capital of around 70 million euros. The investment focus is on Austrian startups with high growth potential for seed and follow-on financing in the start-up and early growth phase (Later Seed and Series-A). Co-investors from the international network are actively involved. The aws Gründerfonds sees itself as a long-term, stable partner and offers entrepreneurial venture capital with active support. So far, together with co-investors, more than EUR 566 million have been invested in 45 companies, and numerous exits have been successfully completed.
About PUSH Ventures
PUSH Ventures is an early-stage venture capital firm investing in outstanding teams with convincing products and high growth potential. PUSH Ventures has been active as investor and has a strong belief in the megatrend of digitalisation and technological advances for the creation of value. Focus areas include health and the future of the planet in Europe, especially Austria and Germany.
About Erste Group
Founded in 1819 as the first Austrian savings bank, Erste Group went public in 1997 with a strategy to expand its retail business into the CEE region. Since then, Erste Group has grown to become one of the largest financial services providers in Central and Southeastern Europe, where it services around 16 million customers.
As more researchers delve into the medicinal potentials of once-verboten compounds, forward-thinking companies like Awakn Life Sciences Corp. are leading the charge to map their most useful aspects and open access for people who need help now. Read more to learn what catalysts Awakn has in store and why The Economist touched on this treatment as one of their top stories of 2023.
Addiction is a serious problem and one for which drugs are often largely to blame. However, drugs — which is to say, the right drugs, used in the right ways — can also play a large part in the solution.
Few companies are more convinced of the inevitability of this approach to treatment than Awakn Life Sciences Corp. (AWKN:NEO; AWKNF:OTCQB). Founded with the goal of bringing surcease of suffering to the 285 million people who struggle with alcohol addiction each year, the company is at the forefront of addressing this US$25B market.
Awakn was founded in 2020 by a team of experienced researchers and industry professionals who saw a need for more effective, personalized treatments for addiction and mental health disorders.
Awakn’s Treatment is Unique
Many current treatments, such as 12-step programs and other group counseling, are not tailored to the unique needs and characteristics of individual patients, making it difficult for them to achieve long-term recovery.
Currently, three medications are approved by the U.S. Food and Drug Administration to treat alcohol use disorder: acamprosate, disulfiram, and naltrexone. However, studies have found that most people attempting traditional therapies require between two and five attempts to actually shake their addiction.
The Economist touched on Awakn’s current clinics in a recent video, marking it as one of the five stories to watch out for in 2023. In it, Natasha Loder, the health policy editor for The Economist, said, “2023 is going to be a really pivotal year for psychedelic medicines.”
In addition, many existing treatments have not been thoroughly tested and validated through clinical research, leaving doubt about their effectiveness. Awakn has staked its reputation on developing trial-verified therapies that incorporate scheduled substances like the drug ketamine, which is a licensed medicine with well-established safety and efficacy as an analgesic and anesthetic.
In addition to its research and development efforts on the clinical side, Awakn is working to improve access to addiction and mental health care. The company is partnering with healthcare providers, payers, and other stakeholders to develop and implement innovative models of care that are more accessible and affordable for patients.
While the company has made large strides in deploying these methods in its own clinics, it is also bundling its technologies and techniques for licensed distribution to other providers.
The Economist touched on Awakn’s current clinics in a recent video, marking it as one of the five stories to watch out for in 2023. In it, Natasha Loder, the health policy editor for The Economist, said, “2023 is going to be a really pivotal year for psychedelic medicines.”
The Catalyst: Clinic Expansions and a Subsidized Phase III Trial
The past month has been quite busy for Awakn, with the expansion of its Oslo clinic and the announcement of a second Norwegian clinic in Trondheim. The company also announced that its ‘Ketamine for Reduction of Alcohol Relapse’ (KARE) trial has reached Phase III with the assistance of the UK’s National Health System (NHS) and will take place at seven sites across the Kingdom, where Awakn already operates two clinics in London and Bristol.
“More than two million UK adults have serious alcohol problems, yet only one in five get treatment. Unfortunately, three out of four people who quit alcohol will be back drinking heavily after a year,” explains Professor Celia Morgan from the University of Exeter. According to the latest report from Polaris Market Research, the global addiction treatment market was valued at US$8.28 billion in 2021 and is expected to grow at a CAGR of 6.4% during the forecast period.
“If this trial definitively establishes that ketamine and therapy works, we hope we can begin to see it used in NHS settings,” Morgan explains. It should be noted that the NHS spends over £3.5 billion per year treating alcohol addiction.
Awakn’s CEO Anthony Tennyson concurs: “With three Awakn clinics already open in the UK and more in Europe, we are already seeing the benefits of this treatment for our clients on an off-label basis.”
STIFEL GMP analyst Andrew Partheniou recently rated the company a speculative Buy on news of Awakn’s Phase III trial, stating in a report that “government funding for 66% of the total trial cost” is “significantly reducing AWKN’s out-of-pocket expense to just over US$1 million.”
“Awakn therapeutics for treating addiction have been proven to be highly efficacious. In our Phase II trial of AUD sufferers, our approach delivered 86% abstinence in the six months post-treatment versus 2% abstinence at the trial start and 25% in the current standard of care,” he continues.
“To put that in context, study participants went from being sober on average seven days a year to being sober on average 314 days a year on an annualized basis.”
“We are focused on addiction because there are few (if any) people whose lives have not been touched by addiction. Alcohol Use Disorder affects 285 million people globally. It destroys families, lives and, sadly, often kills.”
These positive developments follow the company’s 27% revenue growth in Q3 2022 and suggest that while the business is still in the nascent stages of growth, its underlying value proposition is well advanced and nearing a level of sustainable maturation.
STIFEL GMP analyst Andrew Partheniou recently rated the company a speculative Buy on news of Awakn’s Phase III trial, stating in a report that “government funding for 66% of the total trial cost” is “significantly reducing AWKN’s out-of-pocket expense to just over US$1 million.”
His report goes on to detail how “AWKN signed its third licensing agreement in North America, this time with Nushama, an operator in New York City. The offering is expected to be attractive to patients, providing better efficacy at a fraction of standard offerings (min. US$50k in NYC vs. AWKN at US$12.5k), with Nushama paying AWKN an annual fee and undisclosed royalty.”
Partheniou is optimistic that while clinic revenue could reach US$10 million by 2024, its real growth will come from licensing agreements. However, licensing and ketamine therapy aren’t the only tools that Awakn has to work with.
In a July report, H.C. Wainwright & Co. Analyst Patrick Trucchio focused on the company’s concurrent trials involving the equally ‘circumspect’ pharmaceutical MDMA. “We estimate (that MDMA-assisted therapy) could have blockbuster drug potential based on the significant unmet medical need and evidence generated to date pointing to the potential of MDMA-assisted therapy in a variety of mood disorders,” Trucchio explained.
“Moreover, Awakn’s MDMA-assisted therapy has generated promising Phase 2a data in AUD (alcohol use disorder), which follows the validation of the approach in PTSD in a late-stage program being conducted by MAPS, a non-profit organization based in the U.S.”
Awakn is currently pursuing four R&D programs, three live and one paused. The live programs focus on the following:
Ketamine combined with therapy to treat AUD, with Phase II complete and Phase III planned for 2023
Repurposing ketamine combined with therapy to treat behavioral addictions, with feasibility activity ongoing and Phase II planned for 2023
Developing MDMA in partnership with Catalent to address its known IP and pharmacokinetics challenges in order to increase the probability of developing MDMA into a successfully marketed drug to treat addictions with trauma as a causative factor.
The fourth, paused, program involves developing New Chemical Entity (NCE) candidates with properties similar to MDMA to treat addictions and mental health conditions with the poorest current standards of care, trauma as a causative factor, and the most significant total addressable markets.
Ownership and Share Structure
Awakn’s management owns 18.82% of the company’s 32,476,187 common shares. Awakn also has 9,049,240 warrants, 2,971,746 stock options, and 35,172 DSUs outstanding for a fully diluted of 44,532,345.
OrbiMed Advisors LLC files as an insider, with a 7.40% equity stake (2,403,550 regular shares) and 989,583 warrants exercisable at prices of CA$1.80 or higher.
According to Reuters, 18.27% of shares are held by institutions and strategic investors, 8.35% by investment managers, and 9.93% by individual investors.
The company is covered by a myriad of analysts, including previously mentioned Andrew Partheniou of Stifel and Patrick Trucchio of H.C. Wainwright & Co. The company has also been reviewed by Jason McCarthy of Maxim Group and technical analyst Clive Maund of Clivemaund.com. You can click “See More Live Data” in the data box above to read more of what they are saying.
Other institutional investors of note include Iter Investments, Palo Santo, Negev Capital, Neo Kuma, TD Veen, JLS, and Ambria. The company’s market cap is US$ 7,354,000.
Disclosures:
1) Owen Ferguson wrote this article for Streetwise Reports LLC and provides services to Streetwise Reports as an independent contractor. They members of their household own securities of the following companies mentioned in the article: None. They or members of their household are paid by the following companies mentioned in this article: None.
2) The following companies mentioned in this article are billboard sponsors of Streetwise Reports: None. Click here for important disclosures about sponsor fees. The information provided above is for informational purposes only and is not a recommendation to buy or sell any security. As of the date of this article, an affiliate of Streetwise Reports has a consulting relationship with Awakn Life Sciences Corp. Please click here for more information.
3) The article does not constitute investment advice. Each reader is encouraged to consult with his or her individual financial professional and any action a reader takes as a result of information presented here is his or her own responsibility. By opening this page, each reader accepts and agrees to Streetwise Reports’ terms of use and full legal disclaimer. This article is not a solicitation for investment. Streetwise Reports does not render general or specific investment advice and the information on Streetwise Reports should not be considered a recommendation to buy or sell any security. Streetwise Reports does not endorse or recommend the business, products, services or securities of any company mentioned on Streetwise Reports.
4) From time to time, Streetwise Reports LLC and its directors, officers, employees or members of their families, as well as persons interviewed for articles and interviews on the site, may have a long or short position in securities mentioned. Directors, officers, employees or members of their immediate families are prohibited from making purchases and/or sales of those securities in the open market or otherwise from the time of the decision to publish an article until three business days after the publication of the article. The foregoing prohibition does not apply to articles that in substance only restate previously published company releases. As of the date of this article, officers and/or employees of Streetwise Reports LLC (including members of their household) own securities of Awakn Life Sciences Corp., a company mentioned in this article.
5) This article does not constitute medical advice. Officers, employees and contributors to Streetwise Reports are not licensed medical professionals. Readers should always contact their healthcare professionals for medical advice.
Here are the latest charts and statistics for the Commitment of Traders (COT) data published by the Commodities Futures Trading Commission (CFTC).
The latest COT data is updated through Tuesday January 17th and shows a quick view of how large traders (for-profit speculators and commercial entities) were positioned in the futures markets.
Weekly Speculator Changes led by VIX
The COT stock markets speculator bets were lower this week as just one out of the six stock markets we cover had higher positioning while the other seven markets had lower speculator contracts.
The only market with gains for this week was the VIX with a rise of 20,452 contracts.
The markets with the declines in speculator bets this week were Nasdaq-Mini (-12,482 contracts) with the Russell-Mini (-4,787 contracts), MSCI EAFE-Mini (-14,869 contracts), S&P500-Mini (-13,644 contracts), DowJones-Mini (-1,471 contracts) and the Nikkei 225 (-1,106 contracts) also registering lower bets on the week.
COT Strength Scores (a normalized measure of Speculator positions over a 3-Year range, from 0 to 100 where above 80 is Extreme-Bullish and below 20 is Extreme-Bearish) showed that the VIX (77 percent) and the Nasdaq-Mini (64 percent) lead the stock markets this week. The Nikkei 225 (59 percent) and Nikkei 225 Yen (59 percent) come in as the next highest in the weekly strength scores.
On the downside, the MSCI EAFE-Mini (9 percent) comes in at the lowest strength level currently and is in Extreme-Bearish territory (below 20 percent). The next lowest strength score is the S&P500-Mini (14 percent).
Strength Statistics: VIX (76.5 percent) vs VIX previous week (62.4 percent) S&P500-Mini (14.2 percent) vs S&P500-Mini previous week (16.7 percent) DowJones-Mini (27.1 percent) vs DowJones-Mini previous week (29.3 percent) Nasdaq-Mini (63.5 percent) vs Nasdaq-Mini previous week (70.5 percent) Russell2000-Mini (32.0 percent) vs Russell2000-Mini previous week (34.7 percent) Nikkei USD (59.3 percent) vs Nikkei USD previous week (64.6 percent) EAFE-Mini (9.4 percent) vs EAFE-Mini previous week (27.2 percent)
VIX & Nikkei 225 Yen top the 6-Week Strength Trends
COT Strength Score Trends (or move index, calculates the 6-week changes in strength scores) showed that the VIX (15 percent) leads the past six weeks trends for the stock markets. The Nikkei 225 Yen (8 percent), the Russell-Mini (6 percent) and the DowJones-Mini (1 percent) are the next highest positive movers in the latest trends data.
The MSCI EAFE-Mini (-26 percent) leads the downside trend scores currently with the Nasdaq-Mini (-19 percent) coming in as the next market with lower trend scores.
Strength Trend Statistics: VIX (15.3 percent) vs VIX previous week (-3.6 percent) S&P500-Mini (-4.3 percent) vs S&P500-Mini previous week (-1.7 percent) DowJones-Mini (1.5 percent) vs DowJones-Mini previous week (-4.5 percent) Nasdaq-Mini (-19.1 percent) vs Nasdaq-Mini previous week (-10.0 percent) Russell2000-Mini (5.9 percent) vs Russell2000-Mini previous week (-0.3 percent) Nikkei USD (-6.1 percent) vs Nikkei USD previous week (-3.9 percent) EAFE-Mini (-25.5 percent) vs EAFE-Mini previous week (15.7 percent)
Individual Stock Market Charts:
VIX Volatility Futures:
The VIX Volatility large speculator standing this week came in at a net position of -52,355 contracts in the data reported through Tuesday. This was a weekly boost of 20,452 contracts from the previous week which had a total of -72,807 net contracts.
This week’s current strength score (the trader positioning range over the past three years, measured from 0 to 100) shows the speculators are currently Bullish with a score of 76.5 percent. The commercials are Bearish with a score of 22.1 percent and the small traders (not shown in chart) are Bullish with a score of 75.6 percent.
VIX Volatility Futures Statistics
SPECULATORS
COMMERCIALS
SMALL TRADERS
– Percent of Open Interest Longs:
16.4
53.9
8.8
– Percent of Open Interest Shorts:
32.4
36.9
9.8
– Net Position:
-52,355
55,595
-3,240
– Gross Longs:
53,609
176,081
28,892
– Gross Shorts:
105,964
120,486
32,132
– Long to Short Ratio:
0.5 to 1
1.5 to 1
0.9 to 1
NET POSITION TREND:
– Strength Index Score (3 Year Range Pct):
76.5
22.1
75.6
– Strength Index Reading (3 Year Range):
Bullish
Bearish
Bullish
NET POSITION MOVEMENT INDEX:
– 6-Week Change in Strength Index:
15.3
-15.3
3.2
S&P500 Mini Futures:
The S&P500 Mini large speculator standing this week came in at a net position of -226,818 contracts in the data reported through Tuesday. This was a weekly reduction of -13,644 contracts from the previous week which had a total of -213,174 net contracts.
This week’s current strength score (the trader positioning range over the past three years, measured from 0 to 100) shows the speculators are currently Bearish-Extreme with a score of 14.2 percent. The commercials are Bullish-Extreme with a score of 81.2 percent and the small traders (not shown in chart) are Bearish with a score of 25.5 percent.
S&P500 Mini Futures Statistics
SPECULATORS
COMMERCIALS
SMALL TRADERS
– Percent of Open Interest Longs:
12.7
73.8
11.4
– Percent of Open Interest Shorts:
23.7
62.6
11.6
– Net Position:
-226,818
231,163
-4,345
– Gross Longs:
260,337
1,518,121
234,865
– Gross Shorts:
487,155
1,286,958
239,210
– Long to Short Ratio:
0.5 to 1
1.2 to 1
1.0 to 1
NET POSITION TREND:
– Strength Index Score (3 Year Range Pct):
14.2
81.2
25.5
– Strength Index Reading (3 Year Range):
Bearish-Extreme
Bullish-Extreme
Bearish
NET POSITION MOVEMENT INDEX:
– 6-Week Change in Strength Index:
-4.3
4.7
-2.4
Dow Jones Mini Futures:
The Dow Jones Mini large speculator standing this week came in at a net position of -10,613 contracts in the data reported through Tuesday. This was a weekly decline of -1,471 contracts from the previous week which had a total of -9,142 net contracts.
This week’s current strength score (the trader positioning range over the past three years, measured from 0 to 100) shows the speculators are currently Bearish with a score of 27.1 percent. The commercials are Bullish with a score of 73.9 percent and the small traders (not shown in chart) are Bearish with a score of 32.2 percent.
Dow Jones Mini Futures Statistics
SPECULATORS
COMMERCIALS
SMALL TRADERS
– Percent of Open Interest Longs:
31.3
48.3
16.5
– Percent of Open Interest Shorts:
44.1
33.5
18.5
– Net Position:
-10,613
12,290
-1,677
– Gross Longs:
25,847
39,948
13,654
– Gross Shorts:
36,460
27,658
15,331
– Long to Short Ratio:
0.7 to 1
1.4 to 1
0.9 to 1
NET POSITION TREND:
– Strength Index Score (3 Year Range Pct):
27.1
73.9
32.2
– Strength Index Reading (3 Year Range):
Bearish
Bullish
Bearish
NET POSITION MOVEMENT INDEX:
– 6-Week Change in Strength Index:
1.5
-9.7
29.9
Nasdaq Mini Futures:
The Nasdaq Mini large speculator standing this week came in at a net position of -20,633 contracts in the data reported through Tuesday. This was a weekly lowering of -12,482 contracts from the previous week which had a total of -8,151 net contracts.
This week’s current strength score (the trader positioning range over the past three years, measured from 0 to 100) shows the speculators are currently Bullish with a score of 63.5 percent. The commercials are Bearish with a score of 45.3 percent and the small traders (not shown in chart) are Bearish with a score of 33.3 percent.
Nasdaq Mini Futures Statistics
SPECULATORS
COMMERCIALS
SMALL TRADERS
– Percent of Open Interest Longs:
22.4
62.9
11.9
– Percent of Open Interest Shorts:
29.9
51.8
15.5
– Net Position:
-20,633
30,544
-9,911
– Gross Longs:
61,621
172,926
32,760
– Gross Shorts:
82,254
142,382
42,671
– Long to Short Ratio:
0.7 to 1
1.2 to 1
0.8 to 1
NET POSITION TREND:
– Strength Index Score (3 Year Range Pct):
63.5
45.3
33.3
– Strength Index Reading (3 Year Range):
Bullish
Bearish
Bearish
NET POSITION MOVEMENT INDEX:
– 6-Week Change in Strength Index:
-19.1
21.9
-2.7
Russell 2000 Mini Futures:
The Russell 2000 Mini large speculator standing this week came in at a net position of -62,915 contracts in the data reported through Tuesday. This was a weekly fall of -4,787 contracts from the previous week which had a total of -58,128 net contracts.
This week’s current strength score (the trader positioning range over the past three years, measured from 0 to 100) shows the speculators are currently Bearish with a score of 32.0 percent. The commercials are Bullish with a score of 66.4 percent and the small traders (not shown in chart) are Bearish with a score of 37.4 percent.
Russell 2000 Mini Futures Statistics
SPECULATORS
COMMERCIALS
SMALL TRADERS
– Percent of Open Interest Longs:
10.4
82.7
5.7
– Percent of Open Interest Shorts:
25.1
68.8
4.9
– Net Position:
-62,915
59,423
3,492
– Gross Longs:
44,629
354,698
24,352
– Gross Shorts:
107,544
295,275
20,860
– Long to Short Ratio:
0.4 to 1
1.2 to 1
1.2 to 1
NET POSITION TREND:
– Strength Index Score (3 Year Range Pct):
32.0
66.4
37.4
– Strength Index Reading (3 Year Range):
Bearish
Bullish
Bearish
NET POSITION MOVEMENT INDEX:
– 6-Week Change in Strength Index:
5.9
-4.1
-8.3
Nikkei Stock Average (USD) Futures:
The Nikkei Stock Average (USD) large speculator standing this week came in at a net position of -3,825 contracts in the data reported through Tuesday. This was a weekly decrease of -1,106 contracts from the previous week which had a total of -2,719 net contracts.
This week’s current strength score (the trader positioning range over the past three years, measured from 0 to 100) shows the speculators are currently Bullish with a score of 59.3 percent. The commercials are Bullish with a score of 51.4 percent and the small traders (not shown in chart) are Bearish with a score of 21.9 percent.
Nikkei Stock Average Futures Statistics
SPECULATORS
COMMERCIALS
SMALL TRADERS
– Percent of Open Interest Longs:
18.1
61.2
20.6
– Percent of Open Interest Shorts:
45.2
30.5
24.3
– Net Position:
-3,825
4,340
-515
– Gross Longs:
2,560
8,653
2,914
– Gross Shorts:
6,385
4,313
3,429
– Long to Short Ratio:
0.4 to 1
2.0 to 1
0.8 to 1
NET POSITION TREND:
– Strength Index Score (3 Year Range Pct):
59.3
51.4
21.9
– Strength Index Reading (3 Year Range):
Bullish
Bullish
Bearish
NET POSITION MOVEMENT INDEX:
– 6-Week Change in Strength Index:
-6.1
13.4
-17.4
MSCI EAFE Mini Futures:
The MSCI EAFE Mini large speculator standing this week came in at a net position of -28,278 contracts in the data reported through Tuesday. This was a weekly decrease of -14,869 contracts from the previous week which had a total of -13,409 net contracts.
This week’s current strength score (the trader positioning range over the past three years, measured from 0 to 100) shows the speculators are currently Bearish-Extreme with a score of 9.4 percent. The commercials are Bullish-Extreme with a score of 86.7 percent and the small traders (not shown in chart) are Bullish with a score of 68.7 percent.
MSCI EAFE Mini Futures Statistics
SPECULATORS
COMMERCIALS
SMALL TRADERS
– Percent of Open Interest Longs:
5.2
91.1
3.2
– Percent of Open Interest Shorts:
13.2
84.8
1.5
– Net Position:
-28,278
22,516
5,762
– Gross Longs:
18,717
324,872
11,276
– Gross Shorts:
46,995
302,356
5,514
– Long to Short Ratio:
0.4 to 1
1.1 to 1
2.0 to 1
NET POSITION TREND:
– Strength Index Score (3 Year Range Pct):
9.4
86.7
68.7
– Strength Index Reading (3 Year Range):
Bearish-Extreme
Bullish-Extreme
Bullish
NET POSITION MOVEMENT INDEX:
– 6-Week Change in Strength Index:
-25.5
23.7
8.5
Article By InvestMacro – Receive our weekly COT Newsletter
*COT Report: The COT data, released weekly to the public each Friday, is updated through the most recent Tuesday (data is 3 days old) and shows a quick view of how large speculators or non-commercials (for-profit traders) were positioned in the futures markets.
The CFTC categorizes trader positions according to commercial hedgers (traders who use futures contracts for hedging as part of the business), non-commercials (large traders who speculate to realize trading profits) and nonreportable traders (usually small traders/speculators) as well as their open interest (contracts open in the market at time of reporting). See CFTC criteria here.
In light of Bion Environmental Technologies signing a letter of intent to develop a 45,000- head sustainable beef project with Olson Farms/TD Angus, Penny Queen reviews the company to tell you whether she believes it is a good buy.
Huge news came out from Bion Environmental Technologies Inc. (BNET:OTCQB) last Monday! They announced a letter of intent to develop a 45,000- head sustainable beef project with Olson Farms/TD Angus. I was in the middle of writing an article about Bion and why I think they are a great buy when this news came out. So, I am going to carry on, but now with even higher expectations.
Bion Technologies and Walmart
What really sticks out to me about their latest announcement is how it ties Bion to Walmart. The company has been careful with its words, but you don’t have to look very deep to see the connection.
Bion is now planning a 45k head project with Olson Farms/TD Angus. It is worth noting that Olson Farms/TD Angus is a founding member of Sustainable Beef, LLC, with a rancher-owned, US$325 million packing plant being developed in North Platte, NE.
Walmart Inc. (WMT:NYSE) just announced an equity investment to buy a minority stake in Sustainable Beef, LLC.
Connecting the dots seems pretty easy here. It looks like Walmart is showing that they have sufficient demand for a premium product and want to secure its distribution.
In late September, Bion added Bill Rupp to its Advisory Group; he also happens to be a principle of Sustainable Beef, LLC., a former president at Cargill and JBS, two of the world’s top three meat packers.
Demand
Fun Fact: In 2021, Walmart US did US$4.1 billion in beef sales, and Walmart Mexico did US$321 million in beef sales. That is just under 6 million cattle being sold through Walmart alone.
Before the announcement, Bion already had plans for one 15,000-head sustainable beef project with Ribbonwire Ranch, and the economics of it are impressive!
Most investors are familiar with the meteoric rise (and subsequent fall) of plant-based meat companies over 2021 and 2022.
I believe the lesson to be learned from it is two-fold, there is a great demand for alternatives to current farming practices, and there is still a massive demand for animal proteins. A recent survey by Midan Marketing showed that 62% of American consumers purchase premium beef.
The global demand for beef cattle is 1.1 billion, with 90 million of that being in the U.S.
BION is effectively creating a new premium niche, sustainable beef. Their system turns environmental liabilities into agricultural assets. It greatly reduces environmental damage, provides economic benefits to farmers, and also provides benefits to the end consumer.
The Problem
The problem with traditional feedlot systems is the intensity. They place cows in massive outdoor feedlots for up to 3 months of ‘finishing.’ The waste from these cows is spread untreated onto fields and leads to nitrate contamination in groundwater, toxic algae blooms, and increases phosphorus in the soil. The methane, ammonia, and NOX from the cattle is also released into the air. This is an environmental disaster on its own, but the practice also increases pathogens and antibiotic resistance in cattle.
Bion has the Solution
Bion Environmental Technologies specializes in developing advanced technology for treating livestock waste. In plain English, they take animal poop and turn it into money. They process the waste back into biogas, clean water, and fertilizer. The image below shows what the annual waste from 15,000 cattle becomes with their process.
The BION system can work will all sorts of livestock, but since their current agreements are cattle based, that is what I’ll focus on.
Their system includes large, covered barns that protect the animals from the elements. The system utilizes with solar-powered lighting, manure conditioning and collection, biogas upgrading and recovery, ammonia capture and manufacturing of organic fertilizer products, and clean water recovery.
All operations will be third-party validated, USDA-certified, and blockchain-recorded, resulting in a premium product that is transparent, sustainable, and has significantly lower environmental impacts on air, water, and land.
Project Economics
Before the announcement, Bion already had plans for one 15,000-head sustainable beef project with Ribbonwire Ranch, and the economics of it are impressive! (The Ribbonwire agreement is for one 15k head module, with an option for another three. The following numbers are based on one module.)
Clive Maund suggested that Bion was building up to a major bull market.
The following image is taken from their investor deck. It shows the breakdown for a 15,000-head system, including both organic and sustainable beef. The capital costs are much higher for the BION system, coming in at 42.9 million dollars each, compared to US$8 million for an outdoor feedlot.
It does not take long for a return on the investment due to the multiple income streams and higher margins.
A traditional feedlot is estimated to bring in less than half the revenue. The beef industry is a low-margin world and doubling your revenue is a dream come true for farmers.
Projects and Partnerships
Take that last analysis and triple it! Three of Bion’s 15,000-head modules will make up the Olson Farms/TD project.
Construction is expected to start in the second half of 2023, with a definitive joint venture in early 2023. By the end of 2024, early beef and coproduct earnings are anticipated, and in 2025, production might reach up to 135,000 head annually.
Showcase
Both the Ribbonwire Ranch and Olson Farms projects will serve as a sort of showroom for other cattle farmers. I expect to see significantly increased demand for their systems after a successful launch of either project.
Blockchain
Another element that I think is worth reviewing is the blockchain tracking system. I will admit to not being a fan of cryptocurrency, but if there is one good thing to come out of crypto, it is the blockchain.
I see BION being a steady grower over the next few years.
The ability to store information immutably on the blockchain provides a number of food safety protections and allows consumers to know that if they are buying organic or sustainable products, they are really getting what they paid for.
In the event of a food recall, there will be no doubt as to what products are potentially bad. This is a huge cost savings for retailers. Often there is a recall, and they just offer refunds for anything bought between certain dates. With blockchain, they could simply say, “products ending in 4232 need to be returned,” or something of the like.
Analyst Targets
Back in July, Clive Maund suggested that Bion was building up to a major bull market. It was trading at US$1.05 when he said that, and today’s price of US$1.45 seems to point to the same thing. This technology is gaining traction. The stock price is gaining traction.
A few months ago, I was able to find a report by Jeff Campbell, former analyst with Alliance Global, who gave a price target of US$3 back in August. This price target was only included the Ribbonwire deal and did not include the recent deals.
I have not given enough time or words to the environmental benefits or potential tax credits that could be involved. I see BION being a steady grower over the next few years. These projects take time to develop, but it is hard to deny that they are gaining momentum. I am hoping to see additional deals in the coming months.
PennyQueen Disclosures
I have not and will not be compensated for this report in any way. I write reports on my favorite picks; this is meant to be educational and not investment advice, as I am not an investment advisor, just a mom on a mission to make the world better and make money along the way.
Disclosures
1) PennyQueen: I, or members of my immediate household or family, own securities of the following companies mentioned in this article: Bion Environmental Technologies Inc. I personally am, or members of my immediate household or family are, paid by the following companies mentioned in this article: None.
2) The following companies mentioned in this article are billboard sponsors of Streetwise Reports: None. Click here for important disclosures about sponsor fees. The information provided above is for informational purposes only and is not a recommendation to buy or sell any security. As of the date of this article, an affiliate of Streetwise Reports has a consulting relationship with: Bion Environmental Technologies Inc. Please click here for more information.
3) Statements and opinions expressed are the opinions of the author and not of Streetwise Reports or its officers. The author is wholly responsible for the validity of the statements. The author was not paid by Streetwise Reports for this article. Streetwise Reports was not paid by the author to publish or syndicate this article. Streetwise Reports requires contributing authors to disclose any shareholdings in, or economic relationships with, companies that they write about. Streetwise Reports relies upon the authors to accurately provide this information and Streetwise Reports has no means of verifying its accuracy.
4) The article does not constitute investment advice. Each reader is encouraged to consult with his or her individual financial professional and any action a reader takes as a result of information presented here is his or her own responsibility. By opening this page, each reader accepts and agrees to Streetwise Reports’ terms of use and full legal disclaimer. This article is not a solicitation for investment. Streetwise Reports does not render general or specific investment advice and the information on Streetwise Reports should not be considered a recommendation to buy or sell any security. Streetwise Reports does not endorse or recommend the business, products, services or securities of any company mentioned on Streetwise Reports.
5) From time to time, Streetwise Reports LLC and its directors, officers, employees or members of their families, as well as persons interviewed for articles and interviews on the site, may have a long or short position in securities mentioned. Directors, officers, employees or members of their immediate families are prohibited from making purchases and/or sales of those securities in the open market or otherwise from the time of the decision to publish an article until three business days after the publication of the article. The foregoing prohibition does not apply to articles that in substance only restate previously published company releases. As of the date of this article, officers and/or employees of Streetwise Reports LLC (including members of their household) own securities of Bion Environmental Technologies Inc., a company mentioned in this article.
In conjunction with the release of its third-quarter report, Largo Inc. reported record high-purity vanadium production. Read more to hear what analysts are saying about this stock and the multiple catalysts the company has set for the future.
This November, Largo Inc. (TSX:LGO;NASDAQ:LGO)announced that it produced record high-purity vanadium production and completed battery stack manufacturing for its 6.1 MWh VCHARGE VRFB Deployment in Spain. However, despite impacts incurred during the quarter, the company continues to make moves with exciting growth plans throughout 2025.
Largo Inc. is a dual-listed vanadium producer and supplier that produces 7% of the world’s vanadium supply.
The company does everything to further its mission to provide the world with low-carbon solutions and create value through its unique vertical integration. This is done through the company’s two-pillar strategy based on 1.) vanadium production from one of the highest grade and lowest cost vanadium production facilities in Brazil and 2.) its energy storage business in the U.S. with one of the world’s most advanced VRFB technologies.
H.C. Wainwright analyst Heiko F. Ihle gave the company a Buy rating and a CA$19 target price and said, “In our view, some of this value is likely to surface in the near-term since market interest for clean energy investments remains quite high.”
Vanadium is a rare metal discovered in Mexico in 1801. It is a key transition metal suitable for use in energy storage and high-quality alloy applications. Approximately 90% of vanadium is currently used as a steel additive. It is used in the hardening of space vehicles, nuclear reactors, and airplanes.
However, more excitingly, it is also used in producing vanadium electrolyte, which is used in Vanadium redox batteries. These batteries store significant amounts of renewable energy from solar and wind power. According to an article in the Journal of Vacuum Science & Technology B, Vanadium redox batteries are “the most successful Redox flow batteries (RFB) for large-scale applications,” which may explain their recent increase in demand, particularly in China.
On December 13, Pangang Group Vanadium & Titanium Resources Co., Ltd. announced that the company’s wholly-owned subsidiary, Pangang Group Chengdu Vanadium & Titanium Resources Development Co., Ltd. and Dalian Rongke Power Group Co., Ltd. recently signed the “2023 Annual Framework Agreement on Vanadium Battery Energy Storage Material Cooperation” in Chengdu, Sichuan.
According to the agreement, both parties shall adopt the cooperative mode of purchasing and selling ammonium polyvanadate raw materials, with an estimated total quantity (converting to vanadium pentoxide) of 8,000 tons in 2023. If the agreements signed are all successfully executed, the total transaction amount is expected to be about RMB$1 billion (US$144 million) based on the current market prices of vanadium products.
This represents approximately 4% of 2022’s annualized global vanadium supply. Dalian Rongke Power operates the world’s largest vanadium battery with a capacity of 100 MW/400 MWh and plans to further increase its capacity to 200 MW/800 MWh following a second phase of expansion.
Vanadium Demand Rising
Demand for low-carbon technology has been growing worldwide. The World Bank Group report, “The Mineral Intensity of the Clean Energy Transition,” projected that demand for vanadium will rise by 189% by 2050. And it has caught the attention of experts throughout the past year.
In an April post, Shovel Stocks said, ” Investors, therefore, should look for vanadium projects with deposits which are either huge, non-TVM, or both.”
The metal is also desirable from an ESG standpoint as it includes non-degrading, fully recyclable electrolyte and carbon-reducing steel alloying applications. Yet, there is a deficit between current supply and demand.
Vanadium price spiked in 2018 to US$30 per pound, caused by a deficit of 8-10 tonnes.Last year, Roskill said it expects “structural deficit and elevated prices to remain for some time, which should incentive a handful of new projects into production over the next decade. ” This isn’t just because of unexpected demand, but projects can take up to five years to start production.
This strain is exacerbated by the war in Ukraine, as 70% of the world’s vanadium supply is currently with Russia and China.
Source: USGS Mineral Commodity Statistics and UN Comtrade via OECD.
As Simon Hilton of AG Chemi Group pointed out, “unless the war ends soon, manufacturers, raw material suppliers, and consumers everywhere will have to restrict production, manage a shortfall in supply, or simply do without.”
This is where Largo Inc. steps in as a producer outside the typical China-Russia sphere.
Largo is the Largest, Highest-Grade Primary Producer
While Largo only produces 7% of the world’s vanadium, it is the largest, highest-grade primary producer globally and is one of only two producers that supply HP to the aerospace industry.
According to the company, it generates a healthy operating margin with cash operating costs of US$4.30 per pound (US$4.30/lb) in 2022 guidance and rising vanadium prices. In late December, the price of vanadium was US$8.95/lb. This has now risen almost 10%, with the price at US$9.83/lb.
High-purity sales can also add US$1-2 more per pound for Largo’s HP vanadium.
Clean energy pillar: delivery of inaugural VRFB for Enel, exploring government subsidies, non-binding MOU to potentially form a JV with Ansaldo Energia
CIBC Equity Research noted that they “view successful execution of Largo’scapital construction projects, as well as [the] advancement of the clean energy business through further customer updates to be potential catalysts in the year ahead.”
Largo also plans to produce ilmenite and titanium pigment from the same mining stream it does vanadium, which is expected to aid in lowering the vanadium cash costs as a co-product.
The company has also signed a non-binding MOU to negotiate the formation of a joint venture with Ansaldo Green Tech to manufacture and deploy VRFBs in the European, African, and Middle East power generation markets.
In a November 11, 2022 note, H.C. Wainwright analyst Heiko F. Ihle gave the company a Buy rating and a CA$19 target price and said, “In our view, some of this value is likely to surface in the near-term since market interest for clean energy investments remains quite high.”
Gordon Lawson et al. at Paradigm Capital also echoed this with its own Buy rating on Largo and a CA$20 target.
Q3/22 Highlights
While important for its unique placement as one of the world’s largest primary vanadium producers, Largo has been making moves these past few months. In September of last year, Largo’s new venture Largo Physical Vanadiumbegan trading on the TSX Venture Exchange under the ticker “VAND.” This venture provides investors with the opportunity to own physical vanadium themselves, which could increase demand within the vanadium market and aid in Largo’s clean energy strategy. You can learn more about how vanadium will aid in a greener future here.
At the time of the listing, Largo President and CEO Paulo Misk said, “With this enhanced visibility on the TSXV, LPV will do its part to raise the profile of vanadium — a key green transition metal central to clean energy storage and greener steel.”
Then in October, the company released reports for its third quarter of 2022. Highlights of the third quarter included:
V2O5 production of 2,906 tonnes (6.4 million lbs) versus 3,260 tonnes produced in Q3 2021; Lower quarterly production due to a planned kiln and cooler refractory refurbishment and a change of mining contractor, but was in line with the company’s revised production guidance.
Record high purity V2O5 equivalent production of 962 tonnes, representing 33% of the company’s Q3 2022 production.
V2O5 equivalent sales of 2,796 tonnes (inclusive of 351 tonnes of purchased material) versus 2,685 tonnes sold in Q3 2021; Largo completed the first high-purity V2O3 sale in Europe in Q3 2022.
Average benchmark price per pound of V2O5 in Europe of US$8.23, a 12% decrease from the average of US$9.40 in Q3 2021; High purity vanadium demand has increased following ongoing recovery from 2020 COVID-19 impacts, which was partially offset by a softening of steel demand in Q3 2022.
The company advanced construction of its ilmenite concentration plant, including receiving all required metallic flotation structures and building of desliming, flotation, filtration, warehouse, and pipe rack structures; It expects commissioning to be completed in Q2 2023.
Largo Clean Energy (“LCE”) progressed with the delivery of its Enel Green Power España (“EGPE”) VCHARGE vanadium redox flow battery (“VRFB”), including the manufacturing of all high-power battery stacks required for the system; The company has begun shipping battery stacks and electrolyte to the deployment site in Mallorca, Spain.
Largo Physical Vanadium Corp. (“LPV”) commenced trading on the TSX Venture Exchange on September 27, 2022, under the symbol “VAND” and launched a new website www.lpvanadium.com.
Published inaugural Climate Report aligned with the Taskforce on Climate-Related Financial Disclosures (TCFD), providing additional transparency on the company’s approach to climate change.
Multiple Catalysts
Experts expect vanadium to have a bullish market in 2023, and Largo plans to take full advantage of this as the company is highly leveraged to increase vanadium prices. It also has an ilmenite plant that is expected to come online in Q3 2023, and the company expects this new revenue stream to arrive in 2024.
In a November 10, 2022, report, CIBC Equity Research noted that they “view successful execution of Largo’s capital construction projects, as well as [the] advancement of the clean energy business through further customer updates to be potential catalysts in the year ahead.”
The company also plans to iron out its titanium production strategy in three phases over the next six years. The official commencement of this plan is expected in 2025. Largo believes this will give them a US$2.0 billion After-Tax NPV7% and US$4.2 billion After-Tax Life of Mine Cash Flow (using US$8/lb vanadium price).
Last but not least, Largo’s inaugural VRFB installation for Enel Green Power in Spain is anticipated for quarter two of 2023.
According to Reuters, around 70% of the shares are tightly held. 25.21% of the shares are held with institutions. VC/PE Firms hold the most, with 43.81%. Arias Resources Capital Management LP has the most shares at 43.81%, with 28 million shares. West Family Investments is at 8.71%, with a little over 5 million shares, and Grantham Mayo Van Otterloo & Co. LLC is at 7.66%, with 4.9 million. BNY Asset Management has 1.84%, with a little over a million shares, and Baker Steel Capital Managers LLP has 1.27%, with 800,000 shares.
Other notable institutions and firms include Dolefin SA, Legal & General Investment Management Ltd., Konwave AG, Go ETF Solutions LLP, Rezco Investment Council, Blackrock Inc. ETFS Management, Russell Investment Management LLC, Mid-Continent Capital LLC, and BTG Pactual Asset Management SA.
0.67% of stocks are with management and insiders, and 30.31% are in retail. Of Management, President, CEO, and Director, Paulo Misk has the most shares at 0.19%, with 122,510.
As of September 30, 2022, the company has US$62.7 million in the bank.
Largo has a market cap of CA$478.75 million with 64 million shares outstanding. It trades in the 52-week range between CA$6.34 and CA$18.20.
Disclosures: 1) Katherine DeGilio wrote this article for Streetwise Reports LLC. She or members of her household own securities of the following companies mentioned in the article: None. She or members of her household are paid by the following companies mentioned in this article: None.
2) The following companies mentioned in this article are billboard sponsors of Streetwise Reports: Largo Inc.Click here for important disclosures about sponsor fees. As of the date of this article, an affiliate of Streetwise Reports has a consulting relationship with: None.Please click here for more information.
3) Statements and opinions expressed are the opinions of the author and not of Streetwise Reports or its officers. The author is wholly responsible for the validity of the statements. The author was not paid by Streetwise Reports for this article. Streetwise Reports was not paid by the author to publish or syndicate this article. Streetwise Reports requires contributing authors to disclose any shareholdings in, or economic relationships with, companies that they write about. Streetwise Reports relies upon the authors to accurately provide this information and Streetwise Reports has no means of verifying its accuracy.
4) This article does not constitute investment advice. Each reader is encouraged to consult with his or her individual financial professional and any action a reader takes as a result of information presented here is his or her own responsibility. By opening this page, each reader accepts and agrees to Streetwise Reports’ terms of use and full legal disclaimer. This article is not a solicitation for investment. Streetwise Reports does not render general or specific investment advice and the information on Streetwise Reports should not be considered a recommendation to buy or sell any security. Streetwise Reports does not endorse or recommend the business, products, services or securities of any company mentioned on Streetwise Reports.
5) From time to time, Streetwise Reports LLC and its directors, officers, employees or members of their families, as well as persons interviewed for articles and interviews on the site, may have a long or short position in securities mentioned. Directors, officers, employees or members of their immediate families are prohibited from making purchases and/or sales of those securities in the open market or otherwise from the time of the decision to publish an article until three business days after the publication of the article. The foregoing prohibition does not apply to articles that in substance only restate previously publishLargo Inc, a company mentioned in this article.
Walmart and Sustainable Beef LLC will work collaboratively to increase visibility in the beef supply chain and help ranchers grow their business
BENTONVILLE, Ark., and NORTH PLATTE, Neb., Aug 31, 2022 — Walmart Inc. (WMT:NYSE) and Sustainable Beef LLC announced today that Walmart signed an agreement to acquire a minority stake in Sustainable Beef LLC, a rancher-owned company based in North Platte, Nebraska. Walmart’s equity investment is part of a broader strategic partnership to source top-quality angus beef from Sustainable Beef LLC’s new beef processing facility. This partnership helps supplement the current beef industry and provides additional opportunities for ranchers to increase their business. As part of the investment, Walmart will also have representation on Sustainable Beef’s board.
Walmart’s investment will help Sustainable Beef LLC open its beef processing facility in North Platte, Neb. The facility is expected to break ground next month and open by late 2024, creating more than 800 new jobs. Walmart’s work with Sustainable Beef LLC will create more capacity for the beef industry.
“At Walmart, we are dedicated to providing high-quality, affordable beef to our customers, and an investment in Sustainable Beef LLC will give us even more access to these products,” said Tyler Lehr, senior vice president of merchandising for deli services, meat, and seafood, Walmart U.S. “We know Sustainable Beef LLC has a responsible approach to beef processing, one that includes creating long-term growth for cattle ranchers and family farmers. This investment provides greater visibility into the beef supply chain and complements Walmart’s regeneration commitment to improve grazing management.”
Sustainable Beef LLC will work with cattle feeders and ranchers to understand critical elements of the supply chain cycle, such as grain sourcing and grazing management. Animal care will follow the Five Freedoms, and there will be a consistent approach to antibiotic use and reporting across herds in line with Walmart’s Position on Antibiotics in Animals, which asks suppliers to adopt and implement American Veterinary Medical Association Judicious Use Principles of Antimicrobials. All of these components will help Sustainable Beef LLC to improve and refine the beef supply chain to provide quality beef for our customers.
“We set out on a journey two years ago to create a new beef processing plant to add some capacity to the industry and provide an opportunity for producers to integrate their business of raising quality cattle with the beef processing portion of the industry and do it in a sustainable manner, said David Briggs, CEO of Sustainable Beef LLC. “During this journey, we found that Sustainable Beef and Walmart aligned on continuing to improve how we care for our animals and crops and provide consumers the positive experience of enjoying quality beef.”
Walmart’s investment in Sustainable Beef LLC is the latest step in the retailer’s commitment to increasing access to high-quality beef at an affordable price for its customers while boosting capacity for the beef industry and ensuring long-term economic viability for cattle ranchers.
Disclosures:
1) The following companies mentioned in this article are billboard sponsors of Streetwise Reports: None. Click here for important disclosures about sponsor fees. The information provided above is for informational purposes only and is not a recommendation to buy or sell any security.
2) Statements and opinions expressed are the opinions of the author (Walmart) and not of Streetwise Reports or its officers. The author is wholly responsible for the validity of the statements. The author was not paid by Streetwise Reports for this article. Streetwise Reports was not paid by the author to publish or syndicate this article. Streetwise Reports requires contributing authors to disclose any shareholdings in, or economic relationships with, companies that they write about. Streetwise Reports relies upon the authors to accurately provide this information and Streetwise Reports has no means of verifying its accuracy.
3) This article does not constitute investment advice. Each reader is encouraged to consult with his or her individual financial professional and any action a reader takes as a result of information presented here is his or her own responsibility. By opening this page, each reader accepts and agrees to Streetwise Reports’ terms of use and full legal disclaimer. This article is not a solicitation for investment. Streetwise Reports does not render general or specific investment advice and the information on Streetwise Reports should not be considered a recommendation to buy or sell any security. Streetwise Reports does not endorse or recommend the business, products, services or securities of any company mentioned on Streetwise Reports.
4) From time to time, Streetwise Reports LLC and its directors, officers, employees or members of their families, as well as persons interviewed for articles and interviews on the site, may have a long or short position in securities mentioned. Directors, officers, employees or members of their immediate families are prohibited from making purchases and/or sales of those securities in the open market or otherwise from the time of the decision to publish an article until three business days after the publication of the article. The foregoing prohibition does not apply to articles that in substance only restate previously published company releases.
About Walmart Walmart Inc. (NYSE: WMT) helps people around the world save money and live better – anytime and anywhere – in retail stores, online, and through their mobile devices. Each week, approximately 230 million customers and members visit more than 10,500 stores and numerous eCommerce websites under 46 banners in 24 countries. With fiscal year 2022 revenue of $573 billion, Walmart employs approximately 2.3 million associates worldwide. Walmart continues to be a leader in sustainability, corporate philanthropy and employment opportunity. Additional information about Walmart can be found by visiting corporate.walmart.com, on Facebook at facebook.com/walmart and on Twitter at twitter.com/walmart.
Environmental, social and governance business standards and principles, often referred to as ESG, are becoming both more commonplace and controversial.
But what does “ESG” really mean?
It’s shorthand for the way that many corporations operate in accordance with the belief that their long-term survival and their ability to generate profits require accounting for the impact their decisions and actions have on the environment, society as a whole and their own workforce.
ESG investing, sometimes called sustainable investment, also takes these considerations into account.
Zeroing in on the E, S and G
ESG priorities vary widely, but there are some common themes.
These priorities usually emphasize environmental sustainability – the E in ESG – with a focus on contributing to efforts to slow the pace of climate change.
There’s also an effort to uphold high ethical standards through corporate operations. These social concerns – the S – can include, for example, ensuring that a company doesn’t buy goods and services from exploitative suppliers, or treats its employees well. Or it might entail taking care to hire and retain a diverse workforce and taking steps to reduce social injustices in the communities where a corporation operates.
Companies embracing ESG principles should also have high-quality governance – the G. Governance includes oversight, handled by a competent and qualified board of directors, regarding the hiring and firing of top corporate leaders, executive compensation and any dividends paid to shareholders.
Governance also pertains to whether a company’s leadership operates fairly and responsibly, with transparency and accountability.
Why ESG matters
By 2026, the total amount invested globally according to these principles will nearly double to US$34 trillion from $18.4 trillion in 2021, the accounting firm PwC estimates. However, increasing scrutiny of which investments really qualify as ESG could mean it takes longer to reach that volume.
This corporate concept is becoming a political touchstone in the U.S. because some states, like Florida and Kentucky, arguing that these practices divert from the focus on maximizing profits and can be detrimental to investors by making other considerations a priority, have barred their pension funds from using ESG principles as part of their investment considerations. Some very large asset managers, including BlackRock, aren’t allowed to work with those pension funds anymore.
Many of the arguments against embracing these principles hold that they reduce profits by taking other factors into account. But how do ESG practices affect financial performance?
A team of New York University scholars looked at the results of 1,000 different studies that had sought to answer this question. It found mixed results: Some of the studies found that ESG principles increased returns, others found that they weakened performance, and a third group determined that these principles made no difference at all.
It’s possible that the disparities among results could be due largely to the lack of clarity regarding what counts and does not count as ESG, which has been a long-standing discussion and makes it hard to assess how ESG investments perform.
The NYU scholars also found two consistent results regarding ESG strategies. First, they help protect investors against risks such as losses resulting from the failure of a supply chain due to environmental or geopolitical issues, and they can protect companies from volatility during periods of economic instability and downturns. Second, investors and companies benefit more from ESG strategies in the long term than in the short term.
Here are the latest charts and statistics for the Commitment of Traders (COT) data published by the Commodities Futures Trading Commission (CFTC).
The latest COT data is updated through Tuesday January 10th and shows a quick view of how large traders (for-profit speculators and commercial entities) were positioned in the futures markets.
Weekly Speculator Changes led by Russell-Mini & DowJones-Mini
The COT stock markets speculator bets were higher this week as four out of the seven stock markets we cover had higher positioning while the other four markets had lower speculator contracts.
Leading the gains for the stock markets was Russell-Mini (7,233 contracts) with the DowJones-Mini (2,749 contracts) and the Nikkei 225 (255 contracts) also showing positive weeks.
The markets with the declines in speculator bets this week were S&P500-Mini (-45,873 contracts), Nasdaq-Mini (-9,513 contracts), MSCI EAFE-Mini (-7,413 contracts) and the VIX (-4,807 contracts) also registering lower bets on the week.
COT Strength Scores (a normalized measure of Speculator positions over a 3-Year range, from 0 to 100 where above 80 is Extreme-Bullish and below 20 is Extreme-Bearish) showed that the Nasdaq-Mini (70 percent) and the Nikkei 225 (65 percent) lead the stock markets this week. The VIX (64 percent) comes in as the next highest in the weekly strength scores.
On the downside, the S&P500-Mini (17 percent) comes in at the lowest strength level currently and is in Extreme-Bearish territory (below 20 percent). The next lowest strength score is the MSCI EAFE-Mini (27 percent).
Strength Statistics: VIX (64.1 percent) vs VIX previous week (67.3 percent) S&P500-Mini (16.7 percent) vs S&P500-Mini previous week (25.2 percent) DowJones-Mini (29.3 percent) vs DowJones-Mini previous week (25.2 percent) Nasdaq-Mini (70.5 percent) vs Nasdaq-Mini previous week (75.8 percent) Russell2000-Mini (34.7 percent) vs Russell2000-Mini previous week (30.6 percent) Nikkei USD (64.6 percent) vs Nikkei USD previous week (63.3 percent) EAFE-Mini (27.2 percent) vs EAFE-Mini previous week (36.1 percent)
MSCI EAFE-Mini tops the 6-Week Strength Trends
COT Strength Score Trends (or move index, calculates the 6-week changes in strength scores) showed that the MSCI EAFE-Mini (16 percent) leads the past six weeks trends for the stock markets and is the only positive mover this week.
The Nasdaq-Mini (-10 percent) leads the downside trend scores currently with the DowJones-Mini (-4.5 percent) coming in as the next market with lower trend scores.
Strength Trend Statistics: VIX (-3.5 percent) vs VIX previous week (-3.1 percent) S&P500-Mini (-1.7 percent) vs S&P500-Mini previous week (4.5 percent) DowJones-Mini (-4.5 percent) vs DowJones-Mini previous week (-8.2 percent) Nasdaq-Mini (-10.0 percent) vs Nasdaq-Mini previous week (-0.9 percent) Russell2000-Mini (-0.3 percent) vs Russell2000-Mini previous week (-0.2 percent) Nikkei USD (-3.9 percent) vs Nikkei USD previous week (-5.0 percent) EAFE-Mini (15.7 percent) vs EAFE-Mini previous week (26.9 percent)
Individual Stock Market Charts:
VIX Volatility Futures:
The VIX Volatility large speculator standing this week equaled a net position of -72,807 contracts in the data reported through Tuesday. This was a weekly reduction of -4,807 contracts from the previous week which had a total of -68,000 net contracts.
This week’s current strength score (the trader positioning range over the past three years, measured from 0 to 100) shows the speculators are currently Bullish with a score of 64.1 percent. The commercials are Bearish with a score of 38.0 percent and the small traders (not shown in chart) are Bullish with a score of 57.4 percent.
VIX Volatility Futures Statistics
SPECULATORS
COMMERCIALS
SMALL TRADERS
– Percent of Open Interest Longs:
16.6
56.7
6.4
– Percent of Open Interest Shorts:
40.8
30.2
8.7
– Net Position:
-72,807
79,810
-7,003
– Gross Longs:
50,080
170,766
19,207
– Gross Shorts:
122,887
90,956
26,210
– Long to Short Ratio:
0.4 to 1
1.9 to 1
0.7 to 1
NET POSITION TREND:
– Strength Index Score (3 Year Range Pct):
64.1
38.0
57.4
– Strength Index Reading (3 Year Range):
Bullish
Bearish
Bullish
NET POSITION MOVEMENT INDEX:
– 6-Week Change in Strength Index:
-3.5
4.3
-5.5
S&P500 Mini Futures:
The S&P500 Mini large speculator standing this week equaled a net position of -213,174 contracts in the data reported through Tuesday. This was a weekly drop by -45,873 contracts from the previous week which had a total of -167,301 net contracts.
This week’s current strength score (the trader positioning range over the past three years, measured from 0 to 100) shows the speculators are currently Bearish-Extreme with a score of 16.7 percent. The commercials are Bullish with a score of 77.3 percent and the small traders (not shown in chart) are Bearish with a score of 28.5 percent.
S&P500 Mini Futures Statistics
SPECULATORS
COMMERCIALS
SMALL TRADERS
– Percent of Open Interest Longs:
12.0
74.4
11.7
– Percent of Open Interest Shorts:
22.5
64.5
11.2
– Net Position:
-213,174
202,933
10,241
– Gross Longs:
243,503
1,512,933
236,946
– Gross Shorts:
456,677
1,310,000
226,705
– Long to Short Ratio:
0.5 to 1
1.2 to 1
1.0 to 1
NET POSITION TREND:
– Strength Index Score (3 Year Range Pct):
16.7
77.3
28.5
– Strength Index Reading (3 Year Range):
Bearish-Extreme
Bullish
Bearish
NET POSITION MOVEMENT INDEX:
– 6-Week Change in Strength Index:
-1.7
0.2
1.6
Dow Jones Mini Futures:
The Dow Jones Mini large speculator standing this week equaled a net position of -9,142 contracts in the data reported through Tuesday. This was a weekly lift of 2,749 contracts from the previous week which had a total of -11,891 net contracts.
This week’s current strength score (the trader positioning range over the past three years, measured from 0 to 100) shows the speculators are currently Bearish with a score of 29.3 percent. The commercials are Bullish with a score of 74.4 percent and the small traders (not shown in chart) are Bearish with a score of 22.8 percent.
Dow Jones Mini Futures Statistics
SPECULATORS
COMMERCIALS
SMALL TRADERS
– Percent of Open Interest Longs:
33.4
47.8
15.8
– Percent of Open Interest Shorts:
45.2
31.5
20.4
– Net Position:
-9,142
12,647
-3,505
– Gross Longs:
25,943
37,120
12,296
– Gross Shorts:
35,085
24,473
15,801
– Long to Short Ratio:
0.7 to 1
1.5 to 1
0.8 to 1
NET POSITION TREND:
– Strength Index Score (3 Year Range Pct):
29.3
74.4
22.8
– Strength Index Reading (3 Year Range):
Bearish
Bullish
Bearish
NET POSITION MOVEMENT INDEX:
– 6-Week Change in Strength Index:
-4.5
-0.3
16.6
Nasdaq Mini Futures:
The Nasdaq Mini large speculator standing this week equaled a net position of -8,151 contracts in the data reported through Tuesday. This was a weekly decline of -9,513 contracts from the previous week which had a total of 1,362 net contracts.
This week’s current strength score (the trader positioning range over the past three years, measured from 0 to 100) shows the speculators are currently Bullish with a score of 70.5 percent. The commercials are Bearish with a score of 35.1 percent and the small traders (not shown in chart) are Bearish with a score of 41.2 percent.
Nasdaq Mini Futures Statistics
SPECULATORS
COMMERCIALS
SMALL TRADERS
– Percent of Open Interest Longs:
22.5
61.5
13.0
– Percent of Open Interest Shorts:
25.7
56.0
15.3
– Net Position:
-8,151
13,928
-5,777
– Gross Longs:
57,068
156,031
32,962
– Gross Shorts:
65,219
142,103
38,739
– Long to Short Ratio:
0.9 to 1
1.1 to 1
0.9 to 1
NET POSITION TREND:
– Strength Index Score (3 Year Range Pct):
70.5
35.1
41.2
– Strength Index Reading (3 Year Range):
Bullish
Bearish
Bearish
NET POSITION MOVEMENT INDEX:
– 6-Week Change in Strength Index:
-10.0
8.6
7.5
Russell 2000 Mini Futures:
The Russell 2000 Mini large speculator standing this week equaled a net position of -58,128 contracts in the data reported through Tuesday. This was a weekly lift of 7,233 contracts from the previous week which had a total of -65,361 net contracts.
This week’s current strength score (the trader positioning range over the past three years, measured from 0 to 100) shows the speculators are currently Bearish with a score of 34.7 percent. The commercials are Bullish with a score of 63.9 percent and the small traders (not shown in chart) are Bearish with a score of 37.7 percent.
Russell 2000 Mini Futures Statistics
SPECULATORS
COMMERCIALS
SMALL TRADERS
– Percent of Open Interest Longs:
10.4
82.7
5.7
– Percent of Open Interest Shorts:
23.8
70.1
4.9
– Net Position:
-58,128
54,539
3,589
– Gross Longs:
44,813
357,515
24,756
– Gross Shorts:
102,941
302,976
21,167
– Long to Short Ratio:
0.4 to 1
1.2 to 1
1.2 to 1
NET POSITION TREND:
– Strength Index Score (3 Year Range Pct):
34.7
63.9
37.7
– Strength Index Reading (3 Year Range):
Bearish
Bullish
Bearish
NET POSITION MOVEMENT INDEX:
– 6-Week Change in Strength Index:
-0.3
0.9
-3.5
Nikkei Stock Average (USD) Futures:
The Nikkei Stock Average (USD) large speculator standing this week equaled a net position of -2,719 contracts in the data reported through Tuesday. This was a weekly increase of 255 contracts from the previous week which had a total of -2,974 net contracts.
This week’s current strength score (the trader positioning range over the past three years, measured from 0 to 100) shows the speculators are currently Bullish with a score of 64.6 percent. The commercials are Bearish with a score of 43.2 percent and the small traders (not shown in chart) are Bearish with a score of 28.4 percent.
Nikkei Stock Average Futures Statistics
SPECULATORS
COMMERCIALS
SMALL TRADERS
– Percent of Open Interest Longs:
24.1
52.2
23.8
– Percent of Open Interest Shorts:
46.7
29.5
23.7
– Net Position:
-2,719
2,717
2
– Gross Longs:
2,886
6,257
2,848
– Gross Shorts:
5,605
3,540
2,846
– Long to Short Ratio:
0.5 to 1
1.8 to 1
1.0 to 1
NET POSITION TREND:
– Strength Index Score (3 Year Range Pct):
64.6
43.2
28.4
– Strength Index Reading (3 Year Range):
Bullish
Bearish
Bearish
NET POSITION MOVEMENT INDEX:
– 6-Week Change in Strength Index:
-3.9
6.5
-6.0
MSCI EAFE Mini Futures:
The MSCI EAFE Mini large speculator standing this week equaled a net position of -13,409 contracts in the data reported through Tuesday. This was a weekly fall of -7,413 contracts from the previous week which had a total of -5,996 net contracts.
This week’s current strength score (the trader positioning range over the past three years, measured from 0 to 100) shows the speculators are currently Bearish with a score of 27.2 percent. The commercials are Bullish with a score of 68.5 percent and the small traders (not shown in chart) are Bullish with a score of 73.7 percent.
MSCI EAFE Mini Futures Statistics
SPECULATORS
COMMERCIALS
SMALL TRADERS
– Percent of Open Interest Longs:
4.5
91.5
3.5
– Percent of Open Interest Shorts:
8.3
89.5
1.7
– Net Position:
-13,409
6,968
6,441
– Gross Longs:
15,571
318,983
12,299
– Gross Shorts:
28,980
312,015
5,858
– Long to Short Ratio:
0.5 to 1
1.0 to 1
2.1 to 1
NET POSITION TREND:
– Strength Index Score (3 Year Range Pct):
27.2
68.5
73.7
– Strength Index Reading (3 Year Range):
Bearish
Bullish
Bullish
NET POSITION MOVEMENT INDEX:
– 6-Week Change in Strength Index:
15.7
-18.2
18.4
Article By InvestMacro – Receive our weekly COT Newsletter
*COT Report: The COT data, released weekly to the public each Friday, is updated through the most recent Tuesday (data is 3 days old) and shows a quick view of how large speculators or non-commercials (for-profit traders) were positioned in the futures markets.
The CFTC categorizes trader positions according to commercial hedgers (traders who use futures contracts for hedging as part of the business), non-commercials (large traders who speculate to realize trading profits) and nonreportable traders (usually small traders/speculators) as well as their open interest (contracts open in the market at time of reporting). See CFTC criteria here.
The defense manufacturer “got off to a flying start in the new year” with this new contract and an increase in its target price, noted a Bell Potter report.
DroneShield Ltd. (DRO:ASX; DRSHF:OTC) received a new order for US$11 million ($11M) worth of its counterdrone defense solutions, and consequently, Bell Potter raised its target price on the Australian firm to US$0.34 per share from US$0.32, reported analyst Daniel Laing in a Jan. 9 research note.
“Positively, this contract is from a completely different customer to the Dec. 22 order, demonstrating significant demand for the company’s products from a variety of sources,” Laing wrote. The previous order also was for US$11M.
With these two contracts, Laing pointed out, DroneShield has about US$16.5M in contracted revenue for 2023. This amount equates to 62% of Bell Potter’s US$26.5M revenue estimate for the defense manufacturer in 2023.
Whereas Bell Potter did not change any of its 2023 estimates for DroneShield after this order, it did update each valuation used in calculating its price target. This resulted in the US$0.02, or 6.25%, bump up. This new target is US$0.34 per share; the current share price is about US$0.01225.
Bell Potter also maintained its Buy recommendation on DroneShield.
The investment and financial advisory firm made these adjustments, Laing explained, “to reflect improved confidence in the sales pipeline and significant derisking of our forecasts considering the contracted revenue for the calendar year 2023.”
Bell Potter also maintained its Buy recommendation on DroneShield.
In other recent news, which Laing relayed, DroneShield successfully deployed its DroneGun Tactical at the recent Brazilian presidential inauguration. It also finished the artificial intelligence-focused Defence Innovation Hub Project.
Disclosures: 1) Doresa Banning wrote this article for Streetwise Reports LLC and provides services to Streetwise Reports as an independent contractor. She or members of her household own securities of the following companies mentioned in the article: None. She or members of her household are paid by the following companies mentioned in this article: None.
2) The following companies mentioned in this article are billboard sponsors of Streetwise Reports: DroneShield Ltd. Click here for important disclosures about sponsor fees. The information provided above is for informational purposes only and is not a recommendation to buy or sell any security.
3) Statements and opinions expressed are the opinions of the author and not of Streetwise Reports or its officers. The author is wholly responsible for the validity of the statements. The author was not paid by Streetwise Reports for this article. Streetwise Reports was not paid by the author to publish or syndicate this article. Streetwise Reports requires contributing authors to disclose any shareholdings in, or economic relationships with, companies that they write about. Streetwise Reports relies upon the authors to accurately provide this information and Streetwise Reports has no means of verifying its accuracy.
4) This article does not constitute investment advice. Each reader is encouraged to consult with his or her individual financial professional and any action a reader takes as a result of information presented here is his or her own responsibility. By opening this page, each reader accepts and agrees to Streetwise Reports’ terms of use and full legal disclaimer. This article is not a solicitation for investment. Streetwise Reports does not render general or specific investment advice and the information on Streetwise Reports should not be considered a recommendation to buy or sell any security. Streetwise Reports does not endorse or recommend the business, products, services or securities of any company mentioned on Streetwise Reports.
5) From time to time, Streetwise Reports LLC and its directors, officers, employees or members of their families, as well as persons interviewed for articles and interviews on the site, may have a long or short position in securities mentioned. Directors, officers, employees or members of their immediate families are prohibited from making purchases and/or sales of those securities in the open market or otherwise from the time of the decision to publish an article until three business days after the publication of the article. The foregoing prohibition does not apply to articles that in substance only restate previously published company releases. As of the date of this article, officers and/or employees of Streetwise Reports LLC (including members of their household) own securities of DroneShield Ltd., a company mentioned in this article.
Disclosures For Bell Potter, DroneShield Ltd., January 9, 2023
The Authoring Research Analyst is responsible for the content of this Research Report, and, certifies that with respect to each security that the Analyst covered in this Report (1) all the views expressed accurately reflect the Analyst’s personal views about those securities and were prepared in an independent manner and (2) no part of the Analyst’s compensation was, is or will be, directly or indirectly, related to specific recommendations or views expressed by that Research Analyst in the Research Report.
Disclaimers: This Research Report is a private communication to Clients and is not intended for public circulation or for the use of any third party, without the prior written approval of Bell Potter Securities Limited. The Research Report is for informational purposes only and is not intended as an offer or solicitation for the purpose of sale of a security.
Any decision to purchase securities mentioned in the Report must take into account existing public information on such security or any registered prospectus. This is general investment advice only and does not constitute personal advice to any person. Because this Research Report has been prepared without consideration of any specific client’s financial situation, particular needs and investment objectives (‘relevant personal circumstances’), a Bell Potter Securities Limited Broker (or the financial services licensee, or the representative of such licensee, who has provided you with this report by arrangement with Bell Potter Securities Limited) should be made aware of your relevant personal circumstances and consulted before any investment decision is made on the basis of this Research Report.
While this Research Report is based on information from sources which are considered reliable, Bell Potter Securities Limited has not verified independently the information contained in this document and Bell Potter Securities Limited and its directors, employees and consultants do not represent, warrant or guarantee expressly or impliedly, that the information contained in this Research Report is complete or accurate.
Nor does Bell Potter Securities Limited accept any responsibility for updating any advice, views, opinions or recommendations contained in this Research Report or for correcting any error or omission which may have become apparent after the Research Report has been issued. Bell Potter Securities Research Department has received assistance from the Company referred to in this Research Report including but not limited to discussions with management of the Company. Bell Potter Securities Policy prohibits Research Analysts sending draft Recommendations, Valuations and Price Targets to subject companies. However, it should be presumed that the Author of the Research Report has had discussions with the subject Company to ensure factual accuracy prior to publication.
All opinions, projections and estimates constitute the judgement of the Author as of the Date of the Research Report and these, plus any other information contained in the Research Report, are subject to change without notice. Prices and availability of financial instruments also are subject to change without notice.
Notwithstanding other departments within Bell Potter Securities Limited advising the subject Company, information obtained in such role is not used in the preparation of the Research Report. Although Bell Potter Research does not set a predetermined frequency for publication, if the Research Report is a fundamental equity research report it is the intention of Bell Potter Research to provide research coverage of the covered issuers, including in response to news affecting the issuer.
For non-fundamental Research Reports, Bell Potter Research may not provide regular updates to the views, recommendations and facts included in the reports. Notwithstanding that Bell Potter maintains coverage on, makes recommendations concerning or discusses issuers, Bell Potter Research may be periodically restricted from referencing certain Issuers due to legal or policy reasons. Where the component of a published trade idea is subject to a restriction, the trade idea will be removed from any list of open trade ideas included in the Research Report. Upon lifting of the restriction, the trade idea will either be re-instated in the open trade ideas list if the Analyst continues to support it or it will be officially closed.
Bell Potter Research may provide different research products and services to different classes of clients (for example based upon longterm or short term investment horizons) that may lead to differing conclusions or recommendations that could impact the price of a security contrary to the recommendations in the alternative Research Report, provided each is consistent with the rating system for each respective Research Report.
Except in so far as liability under any statute cannot be excluded, Bell Potter Securities Limited and its directors, employees and consultants do not accept any liability (whether arising in contract, in tort or negligence or otherwise) for any error or omission in the document or for any resulting loss or damage (whether direct, indirect, consequential or otherwise) suffered by the recipient of the document or any other person.
In the USA and the UK this Research Report is only for institutional investors. It is not for release, publication or distribution in whole or in part in the two specified countries. In Hong Kong this Research Report is being distributed by Bell Potter Securities (HK) Limited which is licensed and regulated by the Securities and Futures Commission, Hong Kong. In the United States this Research Report is being distributed by Bell Potter Securities (US) LLC which is a registered broker-dealer and member of FINRA. Any person receiving this Research Report from Bell Potter Securities (US) LLC and wishing to transact in any security described herein should do so with Bell Potter Securities (US) LLC.


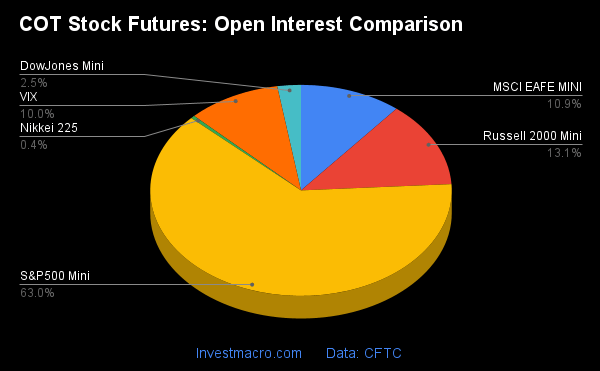
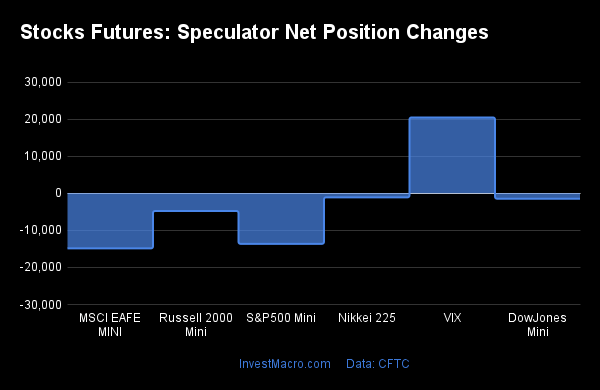


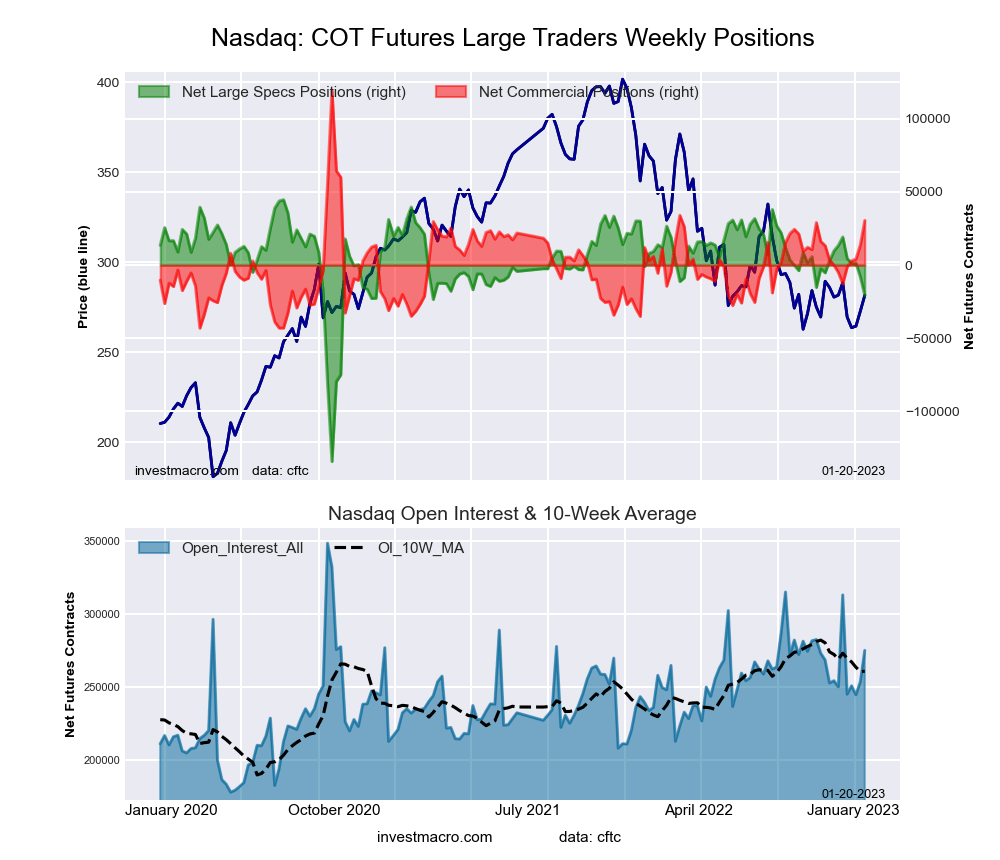
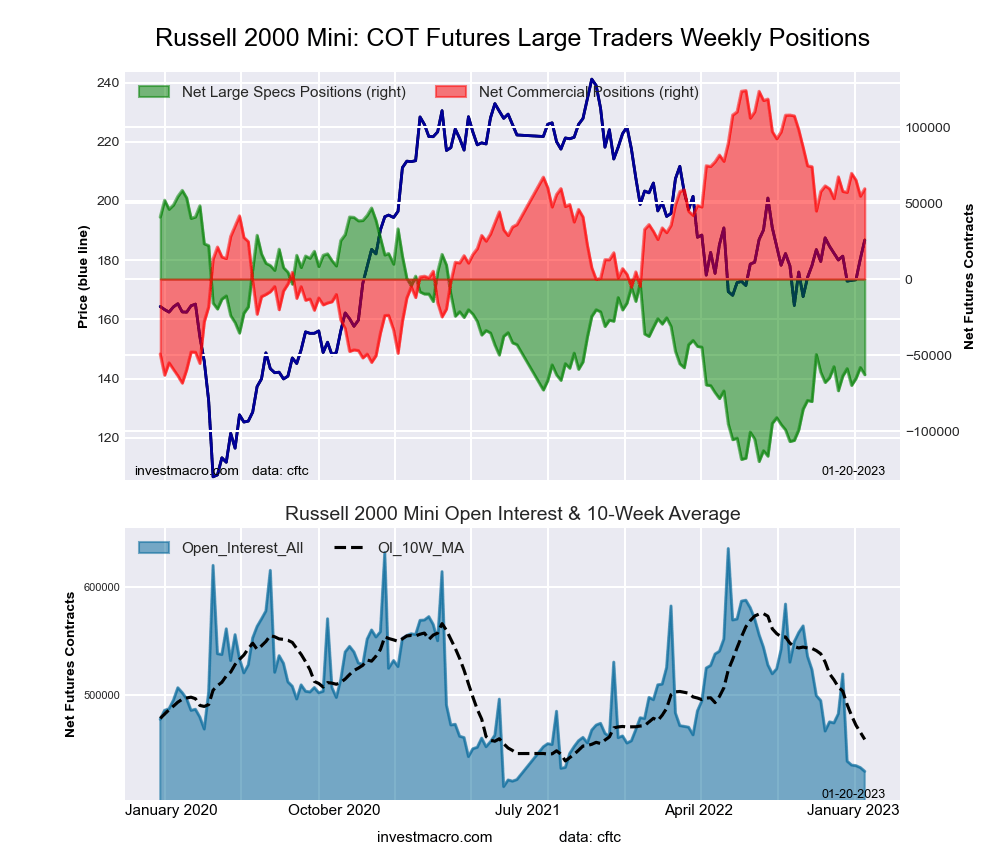

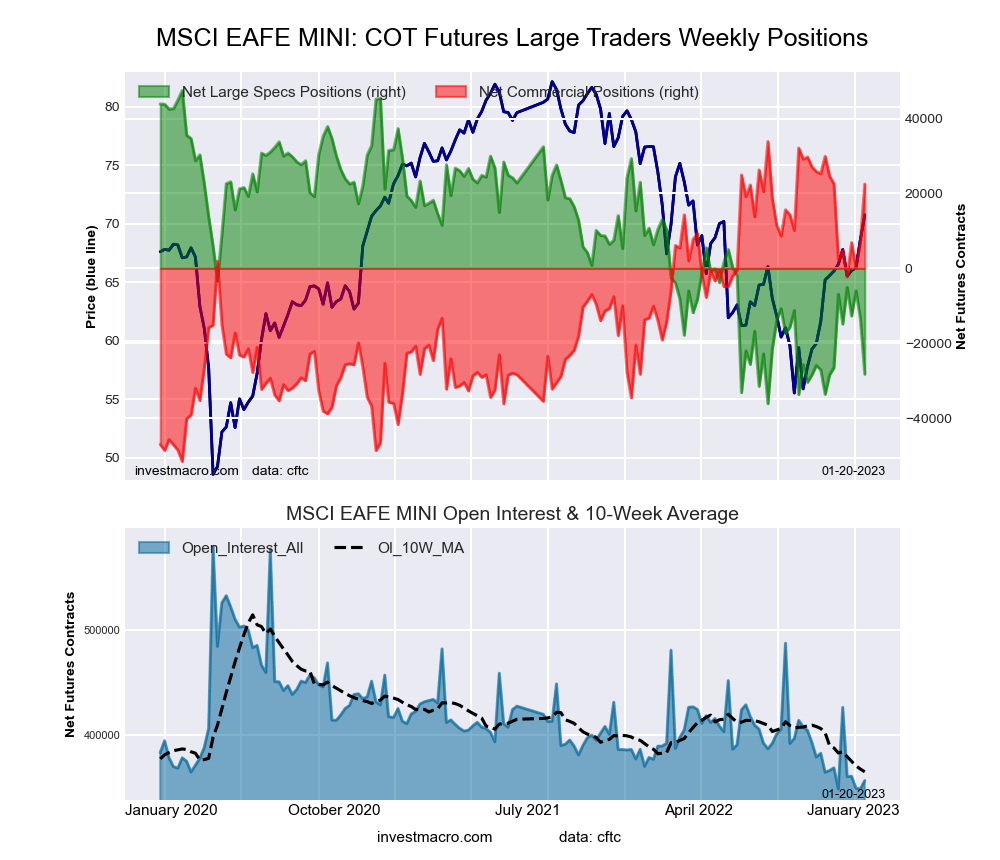


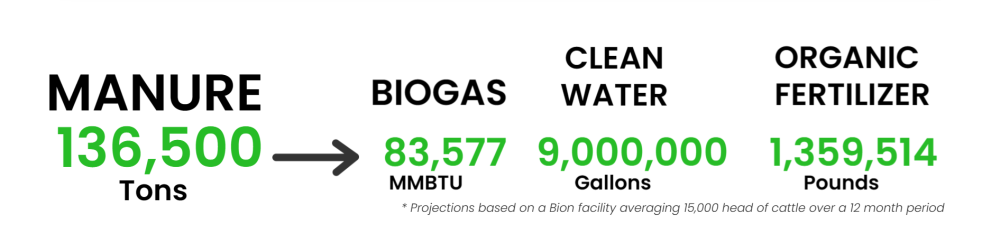
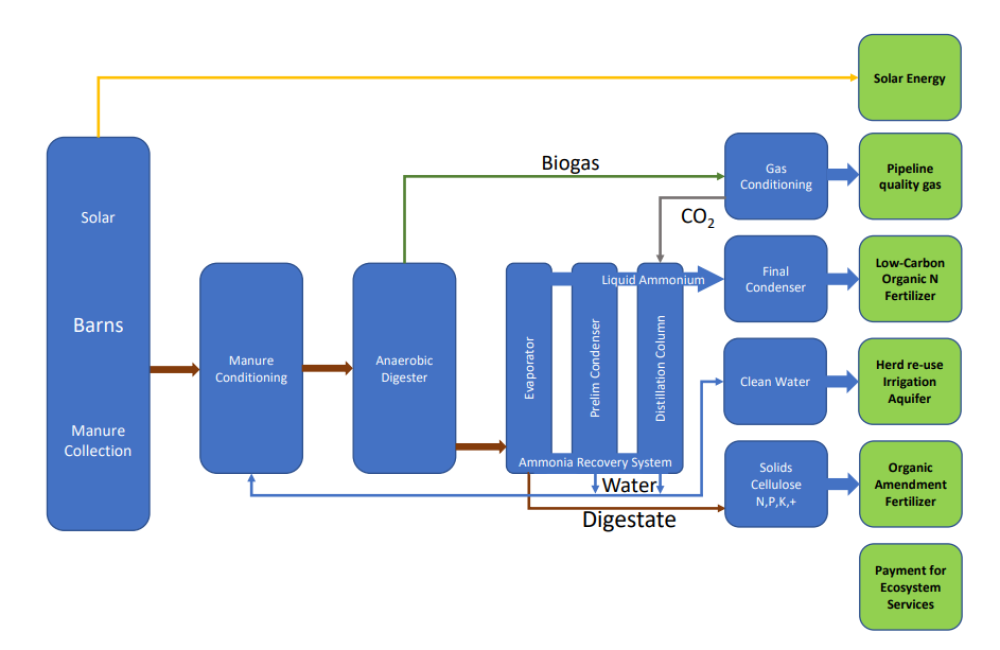
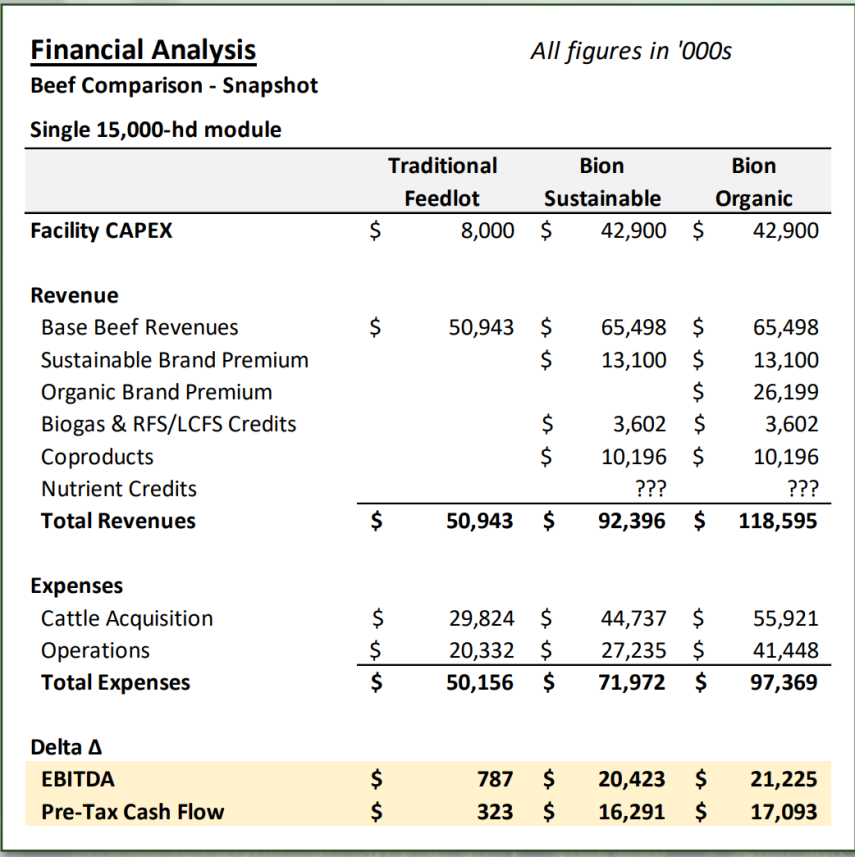
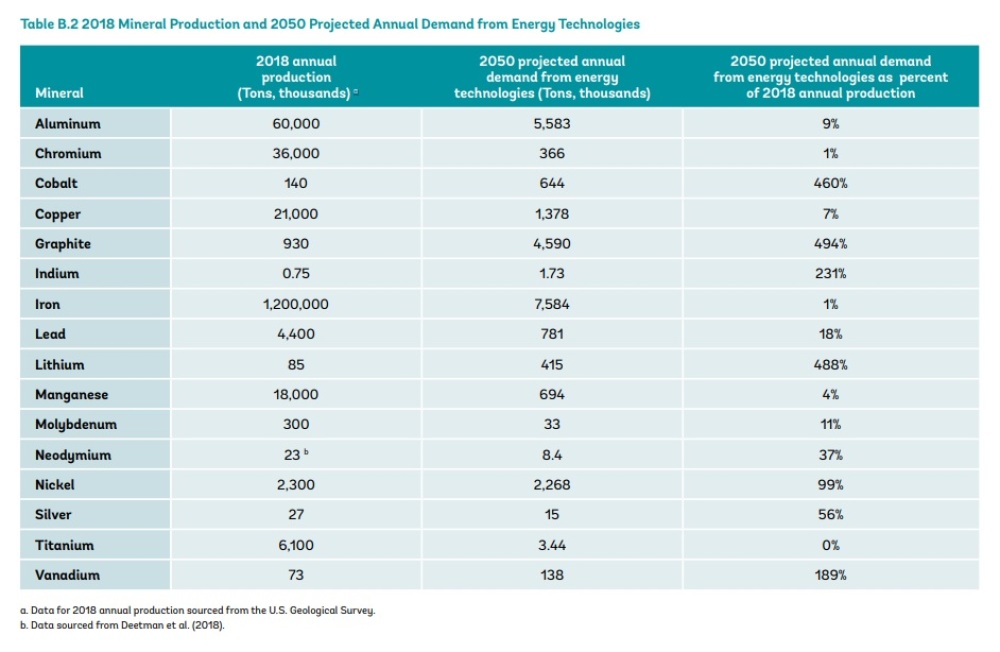
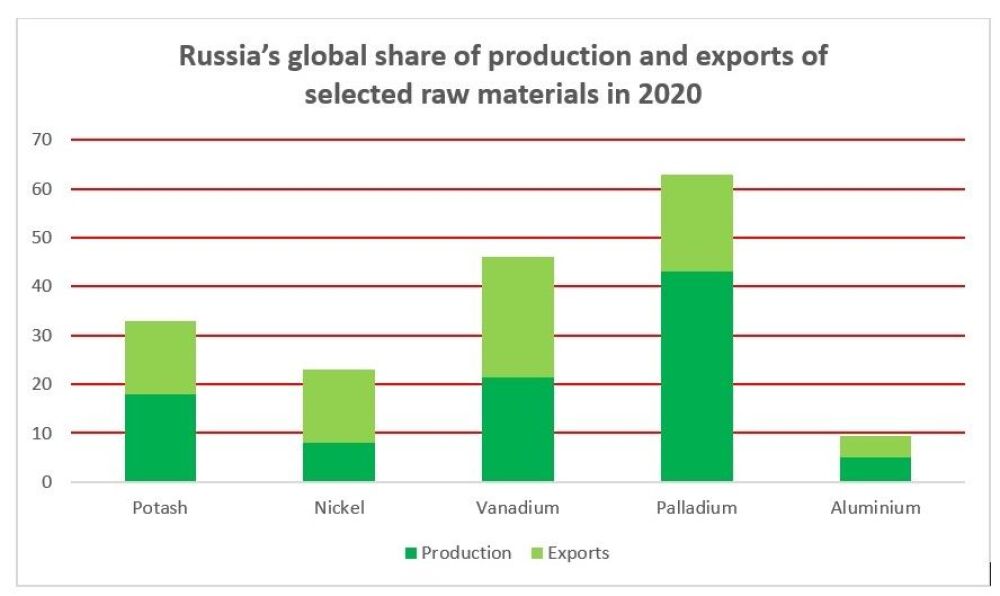

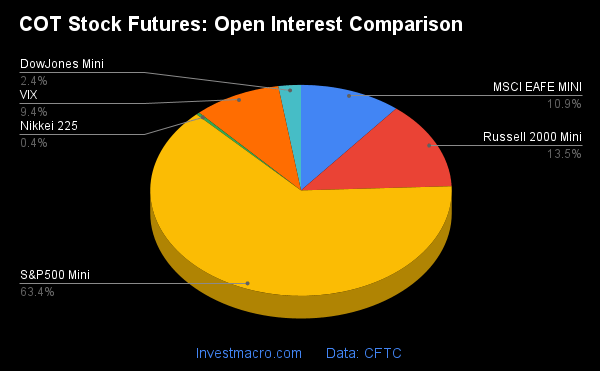
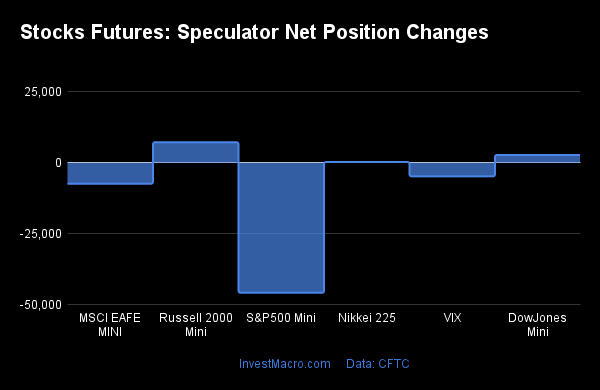
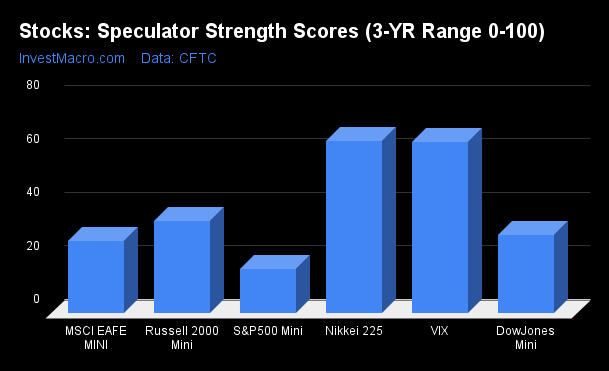
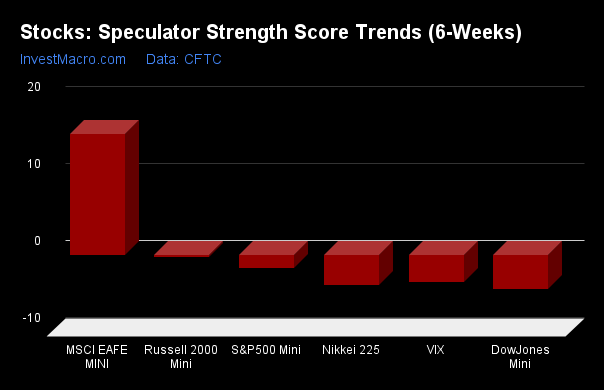
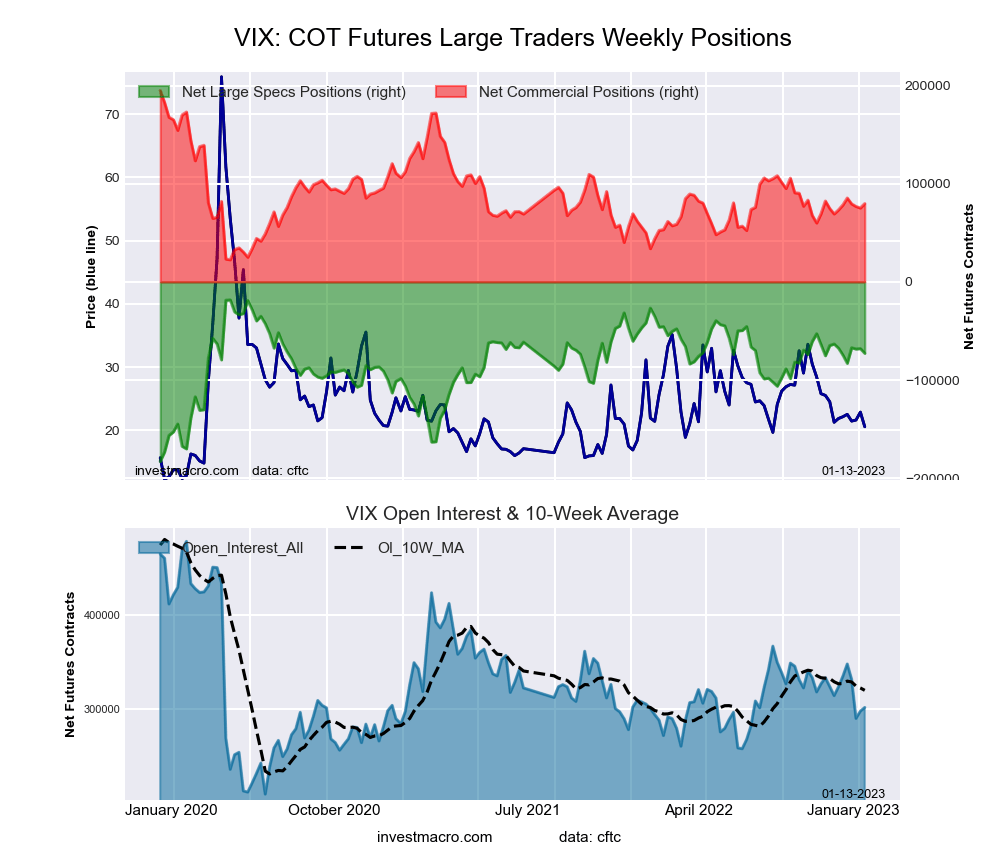
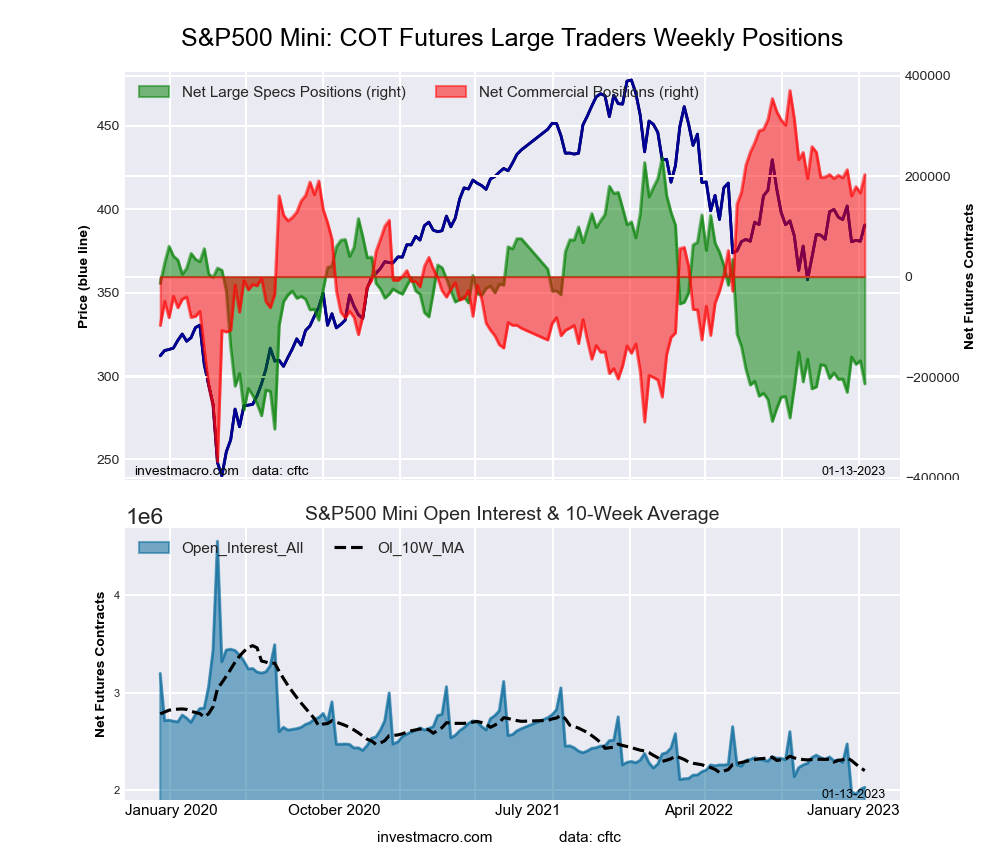
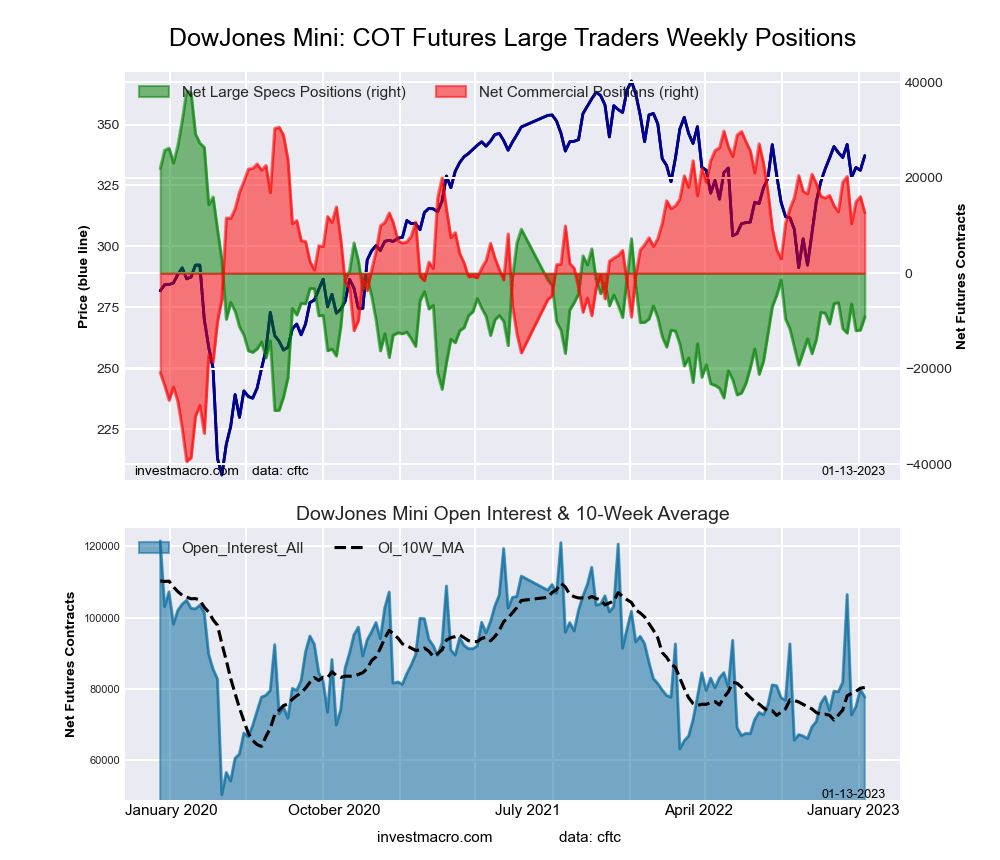
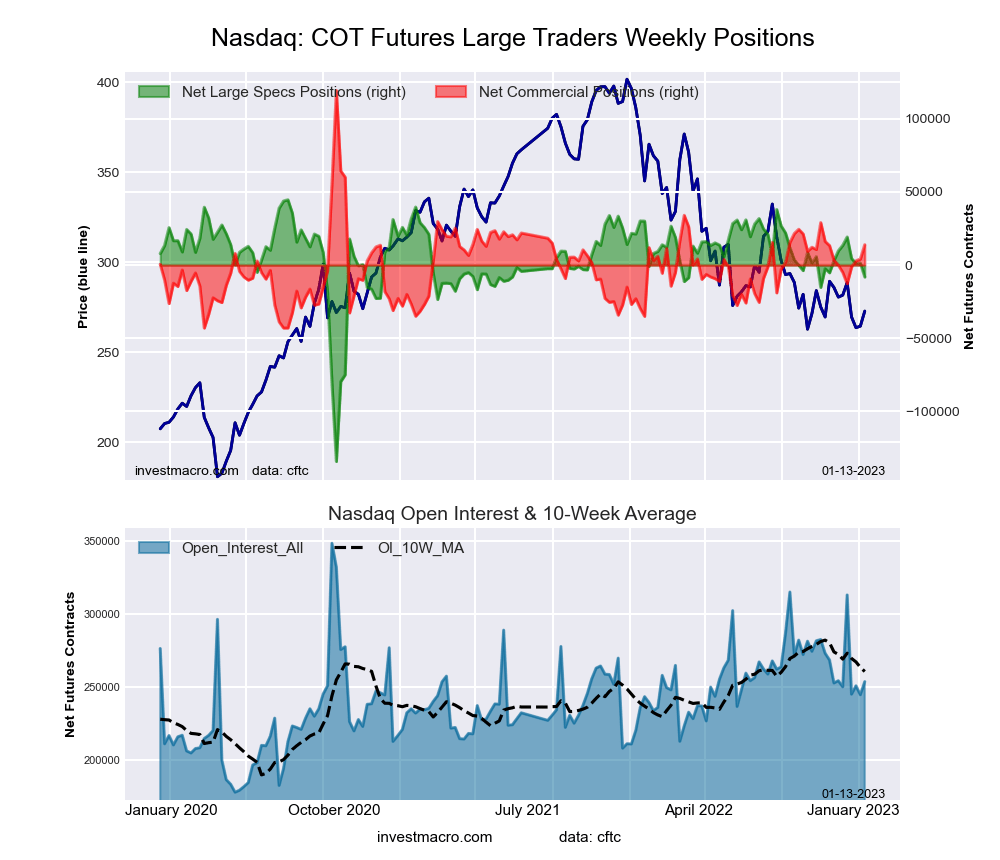
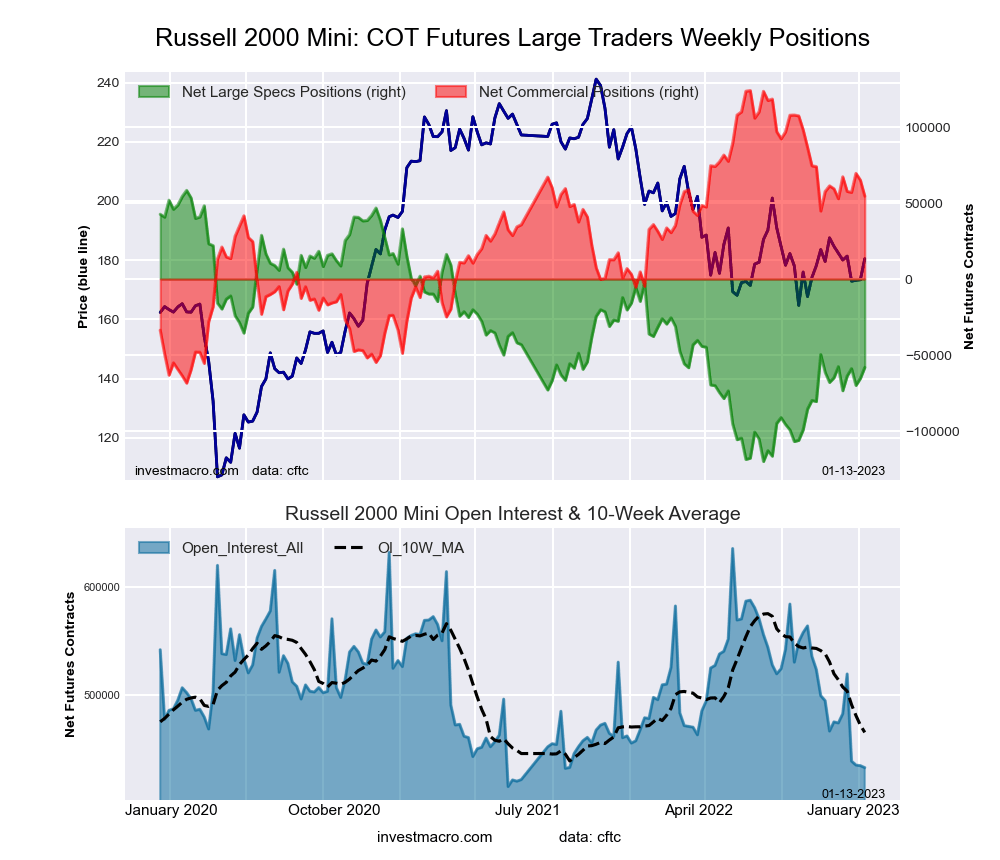
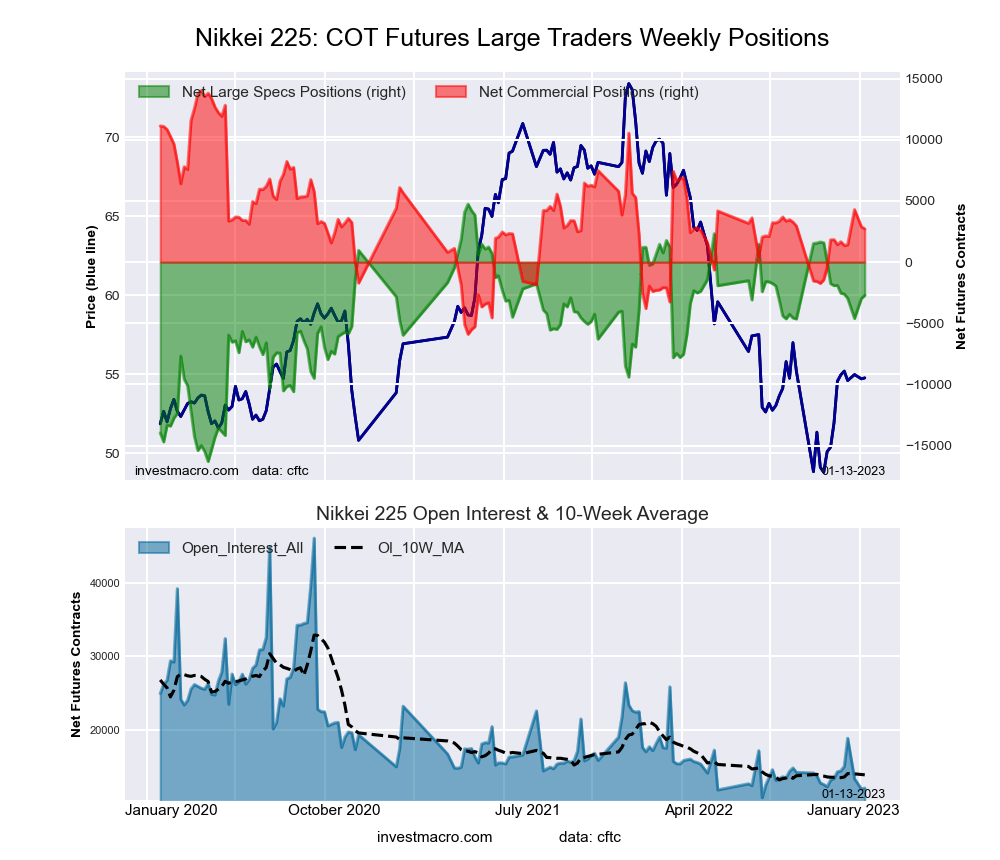

