Economic ‘peak opportunity’ is likely to be late Quarter 1 for most major developed economies, and when investors might be rewarded for taking the plunge, predicts the CEO and founder of one of the world’s largest independent financial advisory, asset management and fintech organizations.
The prediction from deVere Group’s Nigel Green comes as global investors review their portfolios with their advisers for the year ahead.
He says: “Economic ‘peak opportunity’ might come late in the first quarter.
“Until then, unemployment will be rising and there will still be aggressive language from the central banks on the need to stamp out inflation – which by then will be sharply down from current levels, especially as demand for staff is falling fast and this will help ease wage inflation, but it will still be well above the 2% target set by the central banks.
“This is, perhaps, when stocks will reach their cyclical bottom, and when investors might be rewarded for taking the plunge.”
The second quarter of the year might see risk assets start to price in a cyclical upturn in the G7 economies.
“The assets that have fallen hardest between now and then may be the strongest performers during this recovery rally, with the best performing days probably at the start,” noted Nigel Green.
“There will be cyclically-sensitive sectors, such as industrials, consumer discretionary and autos.”
What might trigger this recovery? “Probably central banks’ ending of rate hikes, and easing of rhetoric on inflation, as it slowly makes its way down to the 2% target rate in the major western economies, companies cutting back fast, together with signs of economic stabilisation.”
Investors should remain diversified, affirms the CEO of deVere. There is no ‘right way’ to approach investing, since each individual’s attitude to risk, and time horizon, differs. However, a disciplined approach to putting money into the markets, that ignores current trends, when the outlook for corporate earnings and interest rates is so opaque. Investors should remain diversified in multi-asset portfolios, that offer exposure to equities, bonds and alternative asset classes.
“Holding cash is tempting, but it suggests an ability to ‘time the market’, to invest it at an optimum point in the cycle, and this is nearly always impossible. Investors should be starting to position themselves for the cyclical upturn,” he concludes.
About:
deVere Group is one of the world’s largest independent advisors of specialist global financial solutions to international, local mass affluent, and high-net-worth clients. It has a network of more than 70 offices across the world, over 80,000 clients and $12bn under advisement.
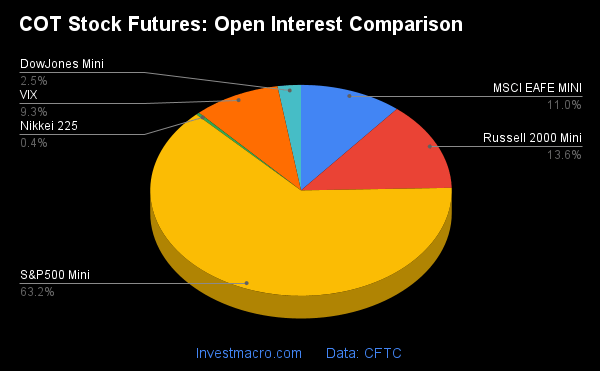
Here are the latest charts and statistics for the Commitment of Traders (COT) data published by the Commodities Futures Trading Commission (CFTC).
The latest COT data is updated through Tuesday January 3rdand shows a quick view of how large traders (for-profit speculators and commercial entities) were positioned in the futures markets.
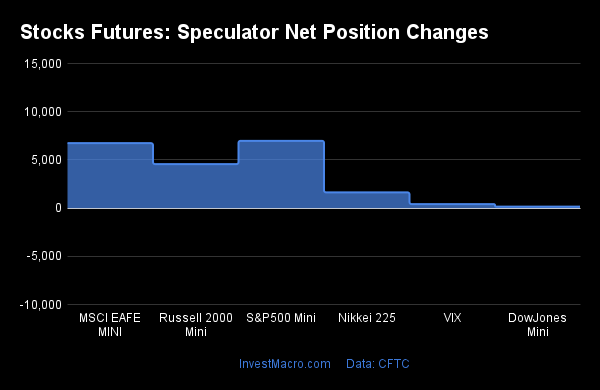
Weekly Speculator Changes led by S&P500-Mini & MSCI EAFE-Mini
The COT stock markets speculator bets were higher this week as all of the eight stock markets we cover had higher positioning.
Leading the gains for the stock markets was S&P500-Mini (6,980 contracts) with the MSCI EAFE-Mini (6,738 contracts), Russell-Mini (4,563 contracts), Nikkei 225 (1,633 contracts), Nikkei 225 Yen (992 contracts), Nasdaq-Mini (190 contracts), DowJones-Mini (154 contracts) and the VIX (415 contracts) also showing positive weeks.
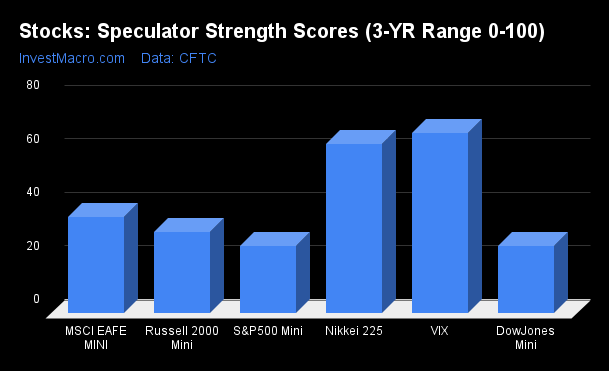
COT Strength Scores (a normalized measure of Speculator positions over a 3-Year range, from 0 to 100 where above 80 is Extreme-Bullish and below 20 is Extreme-Bearish) showed that the Nasdaq-Mini (76 percent) and the VIX (67 percent) lead the stock markets this week. The Nikkei 225 (63 percent) and Nikkei 225 Yen (53 percent) come in as the next highest in the weekly strength scores.
On the downside, the DowJones-Mini (25 percent) and the S&P500-Mini (25 percent) come in at the lowest strength levels currently.
Strength Statistics: VIX (67.3 percent) vs VIX previous week (67.0 percent) S&P500-Mini (25.2 percent) vs S&P500-Mini previous week (23.9 percent) DowJones-Mini (25.2 percent) vs DowJones-Mini previous week (24.9 percent) Nasdaq-Mini (75.8 percent) vs Nasdaq-Mini previous week (75.7 percent) Russell2000-Mini (30.6 percent) vs Russell2000-Mini previous week (28.1 percent) Nikkei USD (63.3 percent) vs Nikkei USD previous week (55.6 percent) EAFE-Mini (36.1 percent) vs EAFE-Mini previous week (28.0 percent)
MSCI EAFE-Mini & Nikkei 225 Yen top the 6-Week Strength Trends
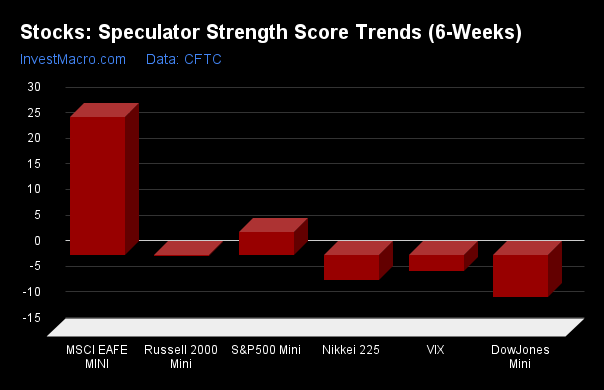
COT Strength Score Trends (or move index, calculates the 6-week changes in strength scores) showed that the MSCI EAFE-Mini (27 percent) leads the past six weeks trends for the stock markets. The S&P500-Mini (4.5 percent) comes in as the next highest positive mover in the latest trends data.
The DowJones-Mini (-8 percent) leads the downside trend scores currently with the Nikkei 225 (-5 percent) coming in as the next market with lower trend scores.
Strength Trend Statistics: VIX (-3.1 percent) vs VIX previous week (-2.4 percent) S&P500-Mini (4.5 percent) vs S&P500-Mini previous week (5.3 percent) DowJones-Mini (-8.2 percent) vs DowJones-Mini previous week (-2.1 percent) Nasdaq-Mini (-0.9 percent) vs Nasdaq-Mini previous week (3.6 percent) Russell2000-Mini (-0.2 percent) vs Russell2000-Mini previous week (-1.1 percent) Nikkei USD (-5.0 percent) vs Nikkei USD previous week (-13.6 percent) EAFE-Mini (26.9 percent) vs EAFE-Mini previous week (25.0 percent)
Individual Stock Market Charts:
VIX Volatility Futures:
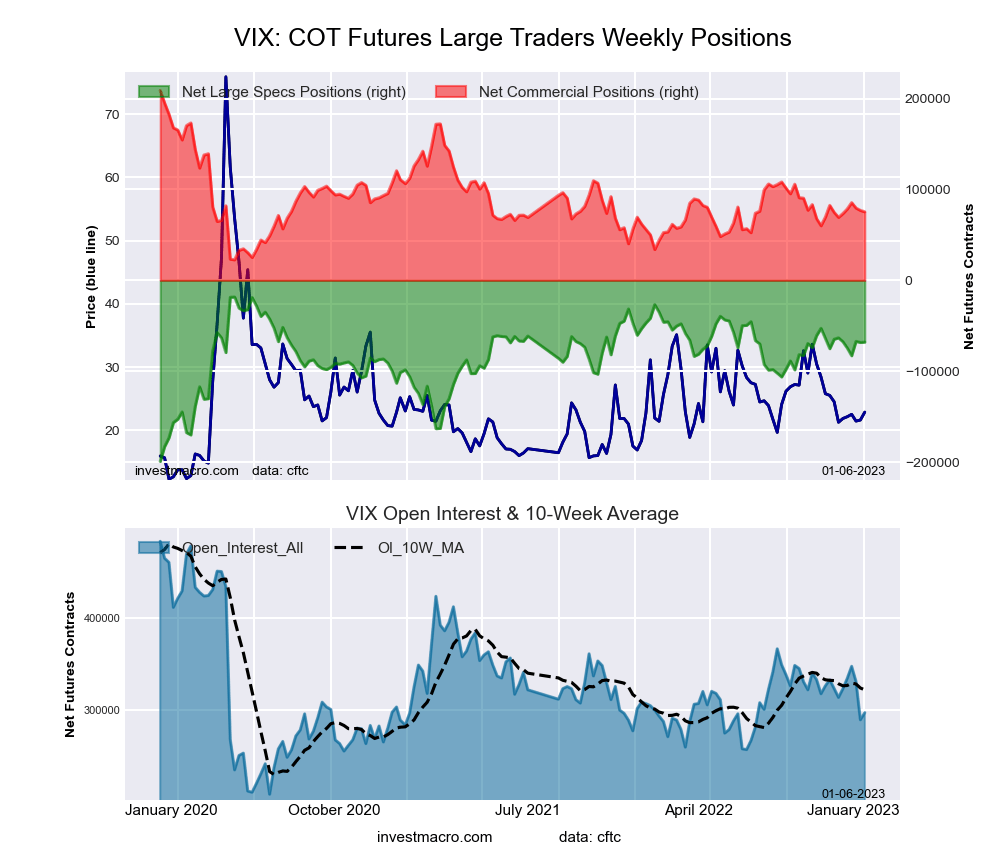
The VIX Volatility large speculator standing this week resulted in a net position of -68,000 contracts in the data reported through Tuesday. This was a weekly boost of 415 contracts from the previous week which had a total of -68,415 net contracts.
This week’s current strength score (the trader positioning range over the past three years, measured from 0 to 100) shows the speculators are currently Bullish with a score of 67.3 percent. The commercials are Bearish with a score of 35.1 percent and the small traders (not shown in chart) are Bullish with a score of 55.8 percent.
VIX Volatility Futures Statistics
SPECULATORS
COMMERCIALS
SMALL TRADERS
– Percent of Open Interest Longs:
19.1
56.6
6.4
– Percent of Open Interest Shorts:
41.9
31.3
8.9
– Net Position:
-68,000
75,329
-7,329
– Gross Longs:
56,713
168,326
18,988
– Gross Shorts:
124,713
92,997
26,317
– Long to Short Ratio:
0.5 to 1
1.8 to 1
0.7 to 1
NET POSITION TREND:
– Strength Index Score (3 Year Range Pct):
67.3
35.1
55.8
– Strength Index Reading (3 Year Range):
Bullish
Bearish
Bullish
NET POSITION MOVEMENT INDEX:
– 6-Week Change in Strength Index:
-3.1
4.0
-6.8
S&P500 Mini Futures:
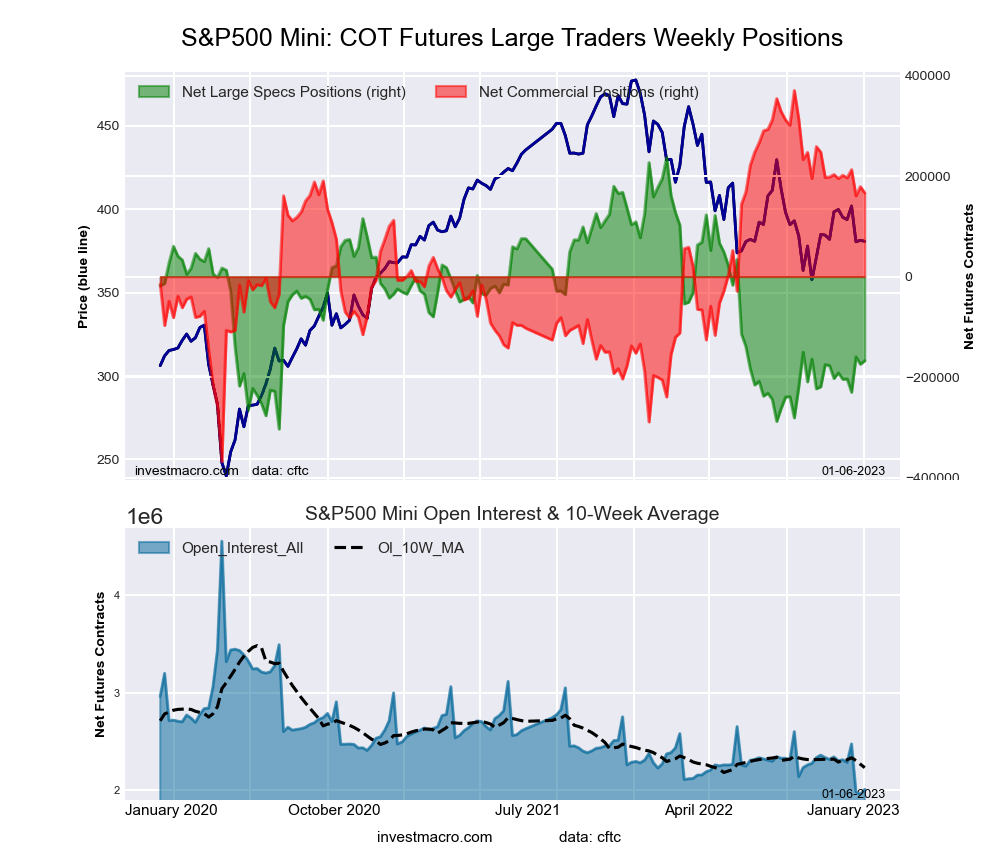
The S&P500 Mini large speculator standing this week resulted in a net position of -167,301 contracts in the data reported through Tuesday. This was a weekly rise of 6,980 contracts from the previous week which had a total of -174,281 net contracts.
This week’s current strength score (the trader positioning range over the past three years, measured from 0 to 100) shows the speculators are currently Bearish with a score of 25.2 percent. The commercials are Bullish with a score of 72.4 percent and the small traders (not shown in chart) are Bearish with a score of 26.5 percent.
S&P500 Mini Futures Statistics
SPECULATORS
COMMERCIALS
SMALL TRADERS
– Percent of Open Interest Longs:
13.0
73.3
11.6
– Percent of Open Interest Shorts:
21.3
65.1
11.5
– Net Position:
-167,301
166,552
749
– Gross Longs:
261,260
1,474,811
232,853
– Gross Shorts:
428,561
1,308,259
232,104
– Long to Short Ratio:
0.6 to 1
1.1 to 1
1.0 to 1
NET POSITION TREND:
– Strength Index Score (3 Year Range Pct):
25.2
72.4
26.5
– Strength Index Reading (3 Year Range):
Bearish
Bullish
Bearish
NET POSITION MOVEMENT INDEX:
– 6-Week Change in Strength Index:
4.5
-3.9
0.9
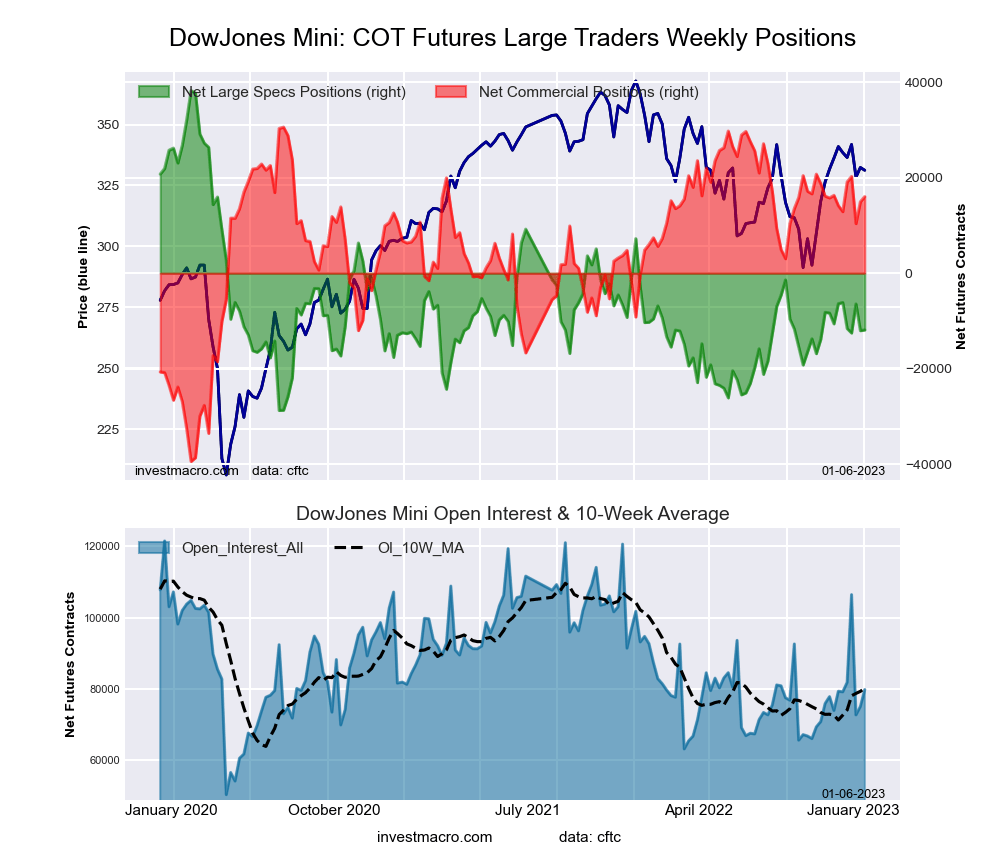
Dow Jones Mini Futures:
The Dow Jones Mini large speculator standing this week resulted in a net position of -11,891 contracts in the data reported through Tuesday. This was a weekly gain of 154 contracts from the previous week which had a total of -12,045 net contracts.
This week’s current strength score (the trader positioning range over the past three years, measured from 0 to 100) shows the speculators are currently Bearish with a score of 25.2 percent. The commercials are Bullish with a score of 79.2 percent and the small traders (not shown in chart) are Bearish-Extreme with a score of 19.5 percent.
Dow Jones Mini Futures Statistics
SPECULATORS
COMMERCIALS
SMALL TRADERS
– Percent of Open Interest Longs:
31.7
51.3
14.5
– Percent of Open Interest Shorts:
46.6
31.2
19.7
– Net Position:
-11,891
16,039
-4,148
– Gross Longs:
25,248
40,900
11,541
– Gross Shorts:
37,139
24,861
15,689
– Long to Short Ratio:
0.7 to 1
1.6 to 1
0.7 to 1
NET POSITION TREND:
– Strength Index Score (3 Year Range Pct):
25.2
79.2
19.5
– Strength Index Reading (3 Year Range):
Bearish
Bullish
Bearish-Extreme
NET POSITION MOVEMENT INDEX:
– 6-Week Change in Strength Index:
-8.2
2.7
18.5
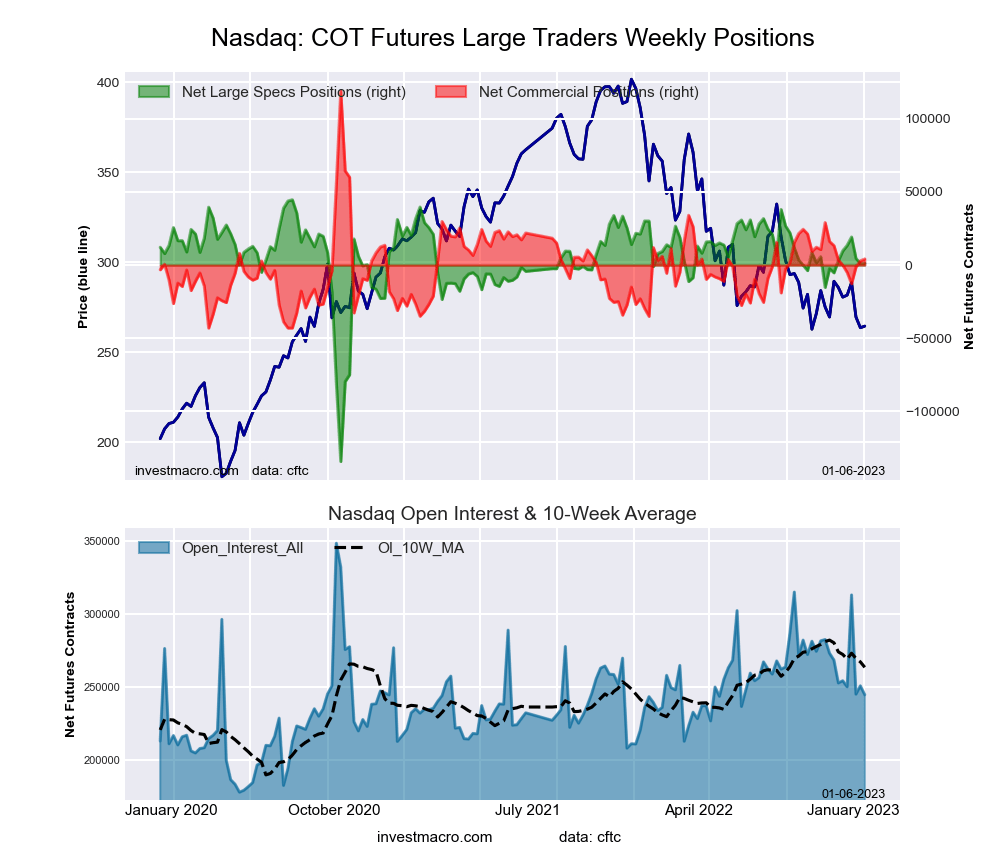
Nasdaq Mini Futures:
The Nasdaq Mini large speculator standing this week resulted in a net position of 1,362 contracts in the data reported through Tuesday. This was a weekly gain of 190 contracts from the previous week which had a total of 1,172 net contracts.
This week’s current strength score (the trader positioning range over the past three years, measured from 0 to 100) shows the speculators are currently Bullish with a score of 75.8 percent. The commercials are Bearish with a score of 29.1 percent and the small traders (not shown in chart) are Bearish with a score of 41.7 percent.
Nasdaq Mini Futures Statistics
SPECULATORS
COMMERCIALS
SMALL TRADERS
– Percent of Open Interest Longs:
24.4
59.6
14.1
– Percent of Open Interest Shorts:
23.9
57.9
16.4
– Net Position:
1,362
4,177
-5,539
– Gross Longs:
59,802
145,713
34,484
– Gross Shorts:
58,440
141,536
40,023
– Long to Short Ratio:
1.0 to 1
1.0 to 1
0.9 to 1
NET POSITION TREND:
– Strength Index Score (3 Year Range Pct):
75.8
29.1
41.7
– Strength Index Reading (3 Year Range):
Bullish
Bearish
Bearish
NET POSITION MOVEMENT INDEX:
– 6-Week Change in Strength Index:
-0.9
0.5
1.8
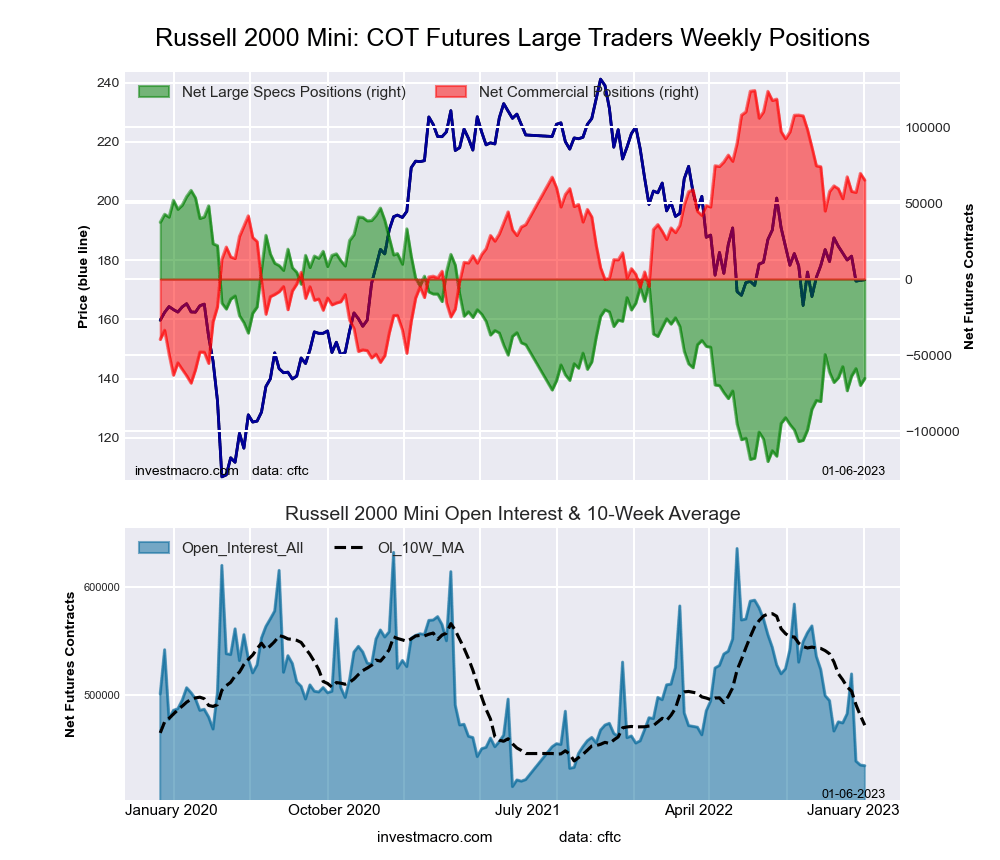
Russell 2000 Mini Futures:
The Russell 2000 Mini large speculator standing this week resulted in a net position of -65,361 contracts in the data reported through Tuesday. This was a weekly boost of 4,563 contracts from the previous week which had a total of -69,924 net contracts.
This week’s current strength score (the trader positioning range over the past three years, measured from 0 to 100) shows the speculators are currently Bearish with a score of 30.6 percent. The commercials are Bullish with a score of 69.4 percent and the small traders (not shown in chart) are Bearish with a score of 27.5 percent.
Russell 2000 Mini Futures Statistics
SPECULATORS
COMMERCIALS
SMALL TRADERS
– Percent of Open Interest Longs:
10.1
83.6
5.1
– Percent of Open Interest Shorts:
25.1
68.6
5.0
– Net Position:
-65,361
65,079
282
– Gross Longs:
43,799
363,125
21,973
– Gross Shorts:
109,160
298,046
21,691
– Long to Short Ratio:
0.4 to 1
1.2 to 1
1.0 to 1
NET POSITION TREND:
– Strength Index Score (3 Year Range Pct):
30.6
69.4
27.5
– Strength Index Reading (3 Year Range):
Bearish
Bullish
Bearish
NET POSITION MOVEMENT INDEX:
– 6-Week Change in Strength Index:
-0.2
3.0
-16.3
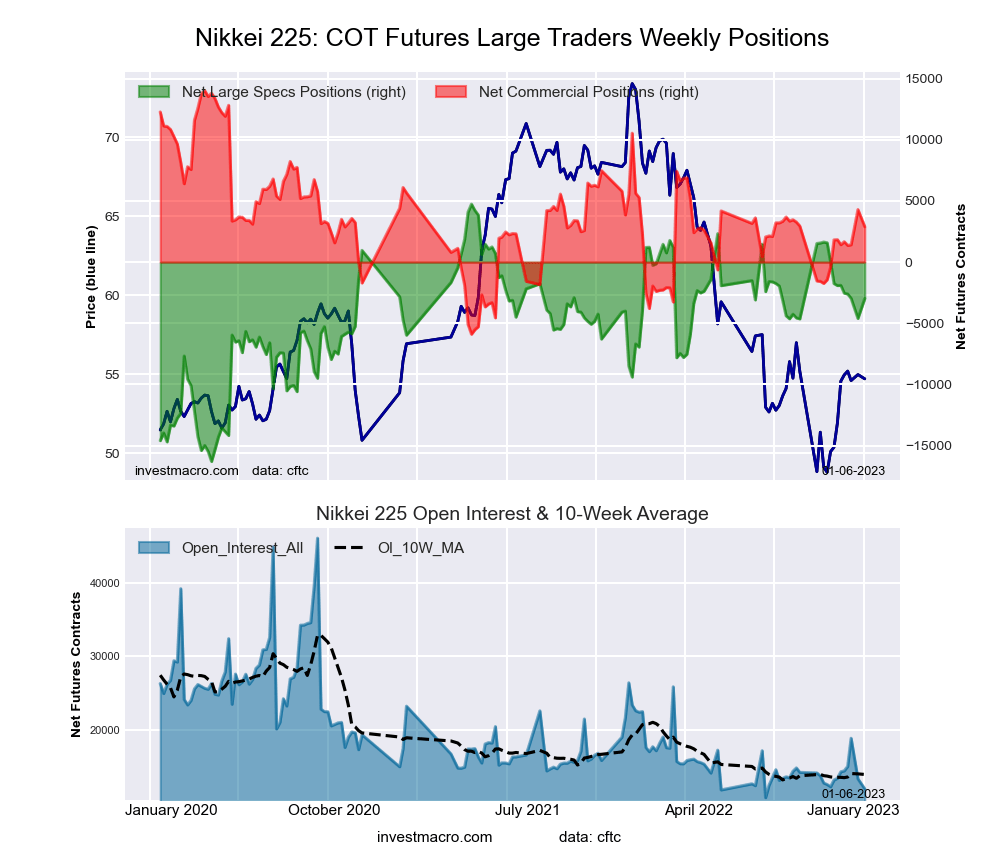
Nikkei Stock Average (USD) Futures:
The Nikkei Stock Average (USD) large speculator standing this week resulted in a net position of -2,974 contracts in the data reported through Tuesday. This was a weekly boost of 1,633 contracts from the previous week which had a total of -4,607 net contracts.
This week’s current strength score (the trader positioning range over the past three years, measured from 0 to 100) shows the speculators are currently Bullish with a score of 63.3 percent. The commercials are Bearish with a score of 44.1 percent and the small traders (not shown in chart) are Bearish with a score of 29.4 percent.
Nikkei Stock Average Futures Statistics
SPECULATORS
COMMERCIALS
SMALL TRADERS
– Percent of Open Interest Longs:
21.9
52.5
25.6
– Percent of Open Interest Shorts:
47.0
28.2
24.9
– Net Position:
-2,974
2,892
82
– Gross Longs:
2,609
6,242
3,038
– Gross Shorts:
5,583
3,350
2,956
– Long to Short Ratio:
0.5 to 1
1.9 to 1
1.0 to 1
NET POSITION TREND:
– Strength Index Score (3 Year Range Pct):
63.3
44.1
29.4
– Strength Index Reading (3 Year Range):
Bullish
Bearish
Bearish
NET POSITION MOVEMENT INDEX:
– 6-Week Change in Strength Index:
-5.0
5.3
-0.0
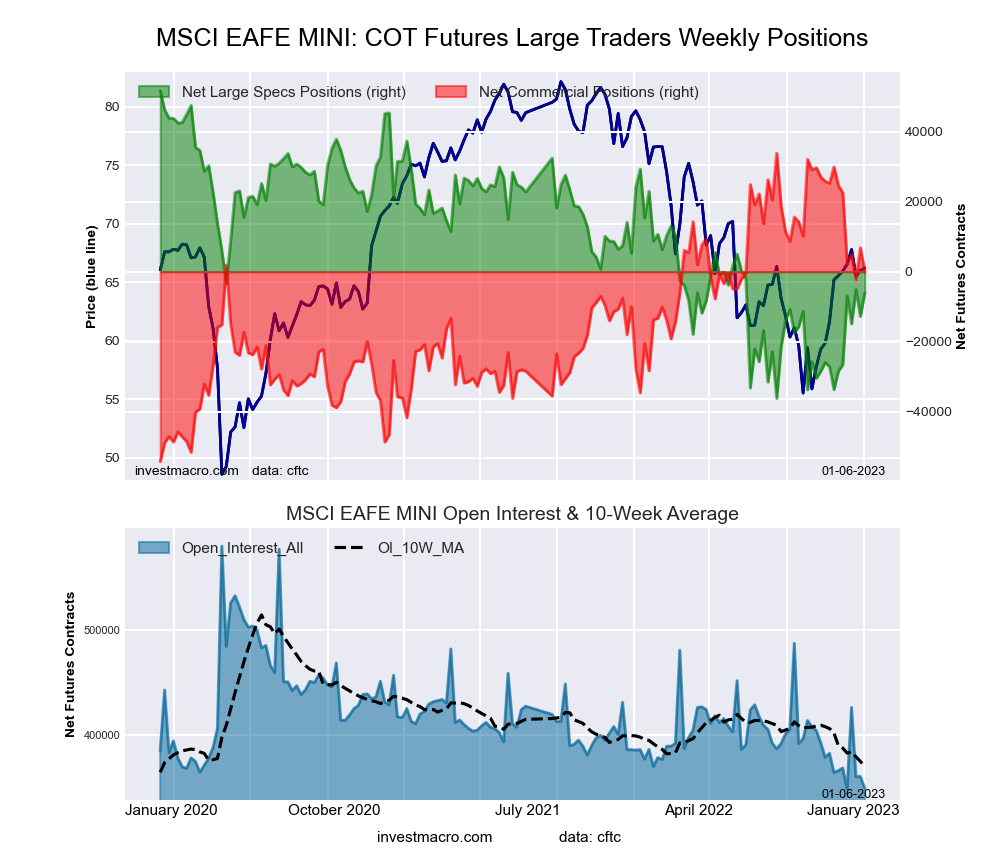
MSCI EAFE Mini Futures:
The MSCI EAFE Mini large speculator standing this week resulted in a net position of -5,996 contracts in the data reported through Tuesday. This was a weekly gain of 6,738 contracts from the previous week which had a total of -12,734 net contracts.
This week’s current strength score (the trader positioning range over the past three years, measured from 0 to 100) shows the speculators are currently Bearish with a score of 36.1 percent. The commercials are Bullish with a score of 60.4 percent and the small traders (not shown in chart) are Bullish with a score of 70.5 percent.
MSCI EAFE Mini Futures Statistics
SPECULATORS
COMMERCIALS
SMALL TRADERS
– Percent of Open Interest Longs:
4.8
91.7
3.1
– Percent of Open Interest Shorts:
6.5
91.7
1.3
– Net Position:
-5,996
-9
6,005
– Gross Longs:
16,843
320,467
10,720
– Gross Shorts:
22,839
320,476
4,715
– Long to Short Ratio:
0.7 to 1
1.0 to 1
2.3 to 1
NET POSITION TREND:
– Strength Index Score (3 Year Range Pct):
36.1
60.4
70.5
– Strength Index Reading (3 Year Range):
Bearish
Bullish
Bullish
NET POSITION MOVEMENT INDEX:
– 6-Week Change in Strength Index:
26.9
-28.8
16.1
Article By InvestMacro – Receive our weekly COT Newsletter
*COT Report: The COT data, released weekly to the public each Friday, is updated through the most recent Tuesday (data is 3 days old) and shows a quick view of how large speculators or non-commercials (for-profit traders) were positioned in the futures markets.
The CFTC categorizes trader positions according to commercial hedgers (traders who use futures contracts for hedging as part of the business), non-commercials (large traders who speculate to realize trading profits) and nonreportable traders (usually small traders/speculators) as well as their open interest (contracts open in the market at time of reporting). See CFTC criteria here.
Because of the green light from the U.S. Food and Drug Administration, H.C. Wainwright & Co. raised its target price on the developer of this drug, according to a recent report.
Vericel Corp.’s (VCEL:NASDAQ) NexoBrid, a product that removes nonviable burn tissue, was recently approved and given a wider label than expected by the U.S. Food and Drug Administration (FDA), reported H.C. Wainwright & Co. analyst Dr. Swayampakula Ramakanth in a Jan. 3 research note. Vericel expects to commercially launch the drug in Q2/23.
“We expect management to provide additional details of the commercial launch in Q1/23 at an investor conference,” Ramakanth wrote.
On the news of the FDA approval, H.C. Wainwright increased its price target on Vericel to US$37 per share from US$35, the analyst pointed out. The biopharma is trading now at about $26.34 per share. The investment bank also reiterated its Buy rating on it.
Approved Uses
Ramakanth reported that NexoBrid is approved for adults with deep partial thickness and/or full-thickness thermal burns.
Patients may apply it to these burns twice within a 24-hour period, first to an area of up to 15% of their body surface area and second to an area of up to 20% of their body surface area.
Milestone Payment Due
NexoBrid is the result of a collaboration between Vericel and MediWound, Ramakanth indicated. Now that the drug is FDA approved, Vericel owes MediWound a milestone payment of US$7.5 million ($7.5M), payable in this first quarter of 2023.
Rationale for a New Target
H.C. Wainwright derived its new price target on Vericel based on a few assumptions, Ramakanth noted. One is that Vericel will initially garner US$6,500 per patient per burn treatment.
Another is that the biopharma will start generating revenue from NexoBrid in Q3/23. The third is that Vericel’s revenue from NexoBrid in 2023 will be an estimated US$8.5M and, by year-end 2026, will be about US$31M.
Disclosures: 1) Doresa Banning wrote this article for Streetwise Reports LLC and provides services to Streetwise Reports as an independent contractor. She or members of her household own securities of the following companies mentioned in the article: None. She or members of her household are paid by the following companies mentioned in this article: None.
2) The following companies mentioned in this article are billboard sponsors of Streetwise Reports: None. Click here for important disclosures about sponsor fees. The information provided above is for informational purposes only and is not a recommendation to buy or sell any security.
3) Statements and opinions expressed are the opinions of the author and not of Streetwise Reports or its officers. The author is wholly responsible for the validity of the statements. The author was not paid by Streetwise Reports for this article. Streetwise Reports was not paid by the author to publish or syndicate this article. Streetwise Reports requires contributing authors to disclose any shareholdings in, or economic relationships with, companies that they write about. Streetwise Reports relies upon the authors to accurately provide this information and Streetwise Reports has no means of verifying its accuracy.
4) This article does not constitute investment advice. Each reader is encouraged to consult with his or her individual financial professional and any action a reader takes as a result of information presented here is his or her own responsibility. By opening this page, each reader accepts and agrees to Streetwise Reports’ terms of use and full legal disclaimer. This article is not a solicitation for investment. Streetwise Reports does not render general or specific investment advice and the information on Streetwise Reports should not be considered a recommendation to buy or sell any security. Streetwise Reports does not endorse or recommend the business, products, services or securities of any company mentioned on Streetwise Reports.
5) From time to time, Streetwise Reports LLC and its directors, officers, employees or members of their families, as well as persons interviewed for articles and interviews on the site, may have a long or short position in securities mentioned. Directors, officers, employees or members of their immediate families are prohibited from making purchases and/or sales of those securities in the open market or otherwise from the time of the decision to publish an article until three business days after the publication of the article. The foregoing prohibition does not apply to articles that in substance only restate previously published company releases.
6) This article does not constitute medical advice. Officers, employees and contributors to Streetwise Reports are not licensed medical professionals. Readers should always contact their healthcare professionals for medical advice.
Disclosures For H.C.Wainwright & Co., MediWound Ltd., January 3, 2023
H.C. Wainwright & Co, LLC (the “Firm”) is a member of FINRA and SIPC and a registered U.S. Broker-Dealer. I, Swayampakula Ramakanth, Ph.D., Arthur He, Ph.D. and Sean Lee , certify that 1) all of the views expressed in this report accurately reflect my personal views about any and all subject securities or issuers discussed; and 2) no part of my compensation was, is, or will be directly or indirectly related to the specific recommendation or views expressed in this research report; and 3) neither myself nor any members of my household is an officer, director or advisory board member of these companies.
None of the research analysts or the research analyst’s household has a financial interest in the securities of Vericel Corporation and MediWound Ltd. (including, without limitation, any option, right, warrant, future, long or short position). As of December 31, 2022 neither the Firm nor its affiliates beneficially own 1% or more of any class of common equity securities of Vericel Corporation and MediWound Ltd.
Neither the research analyst nor the Firm knows or has reason to know of any other material conflict of interest at the time of publication of this research report. The research analyst principally responsible for preparation of the report does not receive compensation that is based upon any specific investment banking services or transaction but is compensated based on factors including total revenue and profitability of the Firm, a substantial portion of which is derived from investment banking services.
The Firm or its affiliates did not receive compensation from Vericel Corporation for investment banking services within twelve months before, but will seek compensation from the companies mentioned in this report for investment banking services within three months following publication of the research report. The Firm or its affiliates did receive compensation from MediWound Ltd. for investment banking services within twelve months before, and will seek compensation from the companies mentioned in this report for investment banking services within three months following publication of the research report. H.C. Wainwright & Co., LLC managed or co-managed a public offering of securities for MediWound Ltd. during the past 12 months.
The Firm does not make a market in Vericel Corporation and MediWound Ltd. as of the date of this research report. The securities of the company discussed in this report may be unsuitable for investors depending on their specific investment objectives and financial position. Past performance is no guarantee of future results. This report is offered for informational purposes only, and does not constitute an offer or solicitation to buy or sell any securities discussed herein in any jurisdiction where such would be prohibited. This research report is not intended to provide tax advice or to be used to provide tax advice to any person.
H.C. Wainwright & Co., LLC does not provide individually tailored investment advice in research reports. This research report is not intended to provide personal investment advice and it does not take into account the specific investment objectives, financial situation and the particular needs of any specific person. Investors should seek financial advice regarding the appropriateness of investing in financial instruments and implementing investment strategies discussed or recommended in this research report.
H.C. Wainwright & Co., LLC’s and its affiliates’ salespeople, traders, and other professionals may provide oral or written market commentary or trading strategies that reflect opinions that are contrary to the opinions expressed in this research report. H.C. Wainwright & Co., LLC and its affiliates, officers, directors, and employees, excluding its analysts, will from time to time have long or short positions in, act as principal in, and buy or sell, the securities or derivatives (including options and warrants) thereof of covered companies referred to in this research report.
The information contained herein is based on sources which we believe to be reliable but is not guaranteed by us as being accurate and does not purport to be a complete statement or summary of the available data on the company, industry or security discussed in the report. All opinions and estimates included in this report constitute the analyst’s judgment as of the date of this report and are subject to change without notice. Securities and other financial instruments discussed in this research report: may lose value; are not insured by the Federal Deposit Insurance Corporation; and are subject to investment risks, including possible loss of the principal amount invested.
Meta Materials Inc. wins an innovation award at the Consumer Electronics Show and shows off its tech giving a clearer view of the contents of your microwave.
Another new year means another chance for the tech industry to show off at the Consumer Electronics Show.
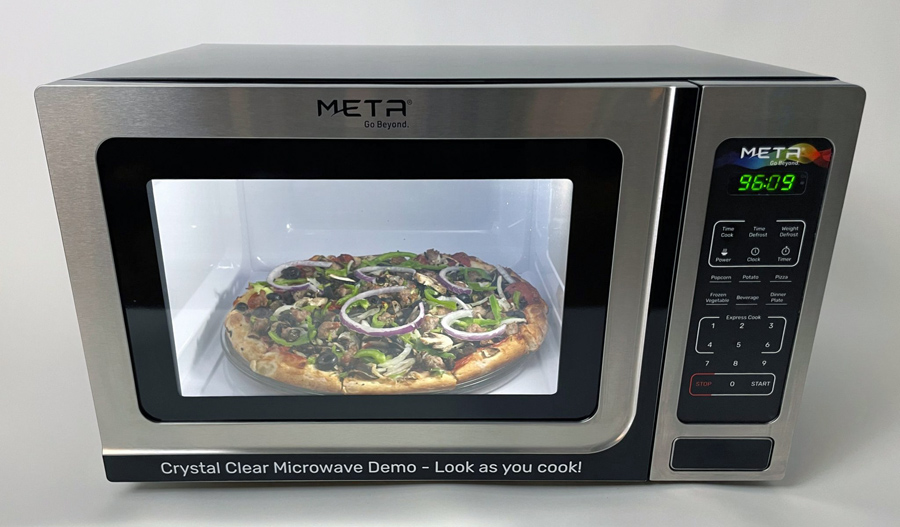
META was named a CES 2023 Innovation Awards Honoree for the NANOWEB® transparent EMI shielding film, which promises to make it easier to tell when your leftovers are ready in the microwave by clearing up the radiation shielding used on the window.
The technology is also used to de-ice auto sensors and manufacture antennas and electrochromic lenses for augmented reality and 5G reflector films.
The company will also demonstrate its electric vehicle (EV)-related products, like its NPORE® nanocomposite ceramic battery separator and current collectors, to reduce copper usage and improve safety at the show.
It promises to be a busy year for the company, analyst Graham Mattison of Water Tower Research wrote.
It promises to be a busy year for the company, analyst Graham Mattison of Water Tower Research wrote in a Dec. 19 research note.
“We expect that META will announce at least one production contract this year, delivering a major milestone in the company’s growth of commercial revenues,” Mattison wrote. “While META has yet to announce anything, we see NANOWEB® as the likely technology to be commercially incorporated into a product.”
The Catalyst: NANOWEB®
Source: META Materials Inc.
But it’s the microwave application of the technology that may attract crowds for META in Las Vegas. Mattison said an estimated 70 million microwaves are sold every year.
“All microwave ovens produce radiation, which is why windows within their doors have significant shielding,” wrote ROTH Capital Partners analyst Gerry Sweeney in a research note.
“But this also obscures visibility into the oven. MMAT EMI shielding uses nanostructures to divert radiation waves back into the oven, allowing for a clear window. Furthermore, initial testing indicates lower amounts of radiation escape. Initial testing, results, and NANOWEB® line production likely open the door to increasing conversations with OEMs in coming quarters.”
ROTH has a Buy rating on META with a target of US$2.
“META is at the early stage of what we expect will be a significant growth curve as its technologies are incorporated into many of today’s products in a range of industries,” Mattison wrote.
“The company’s growing portfolio of technologies, along with its production capabilities, partnerships, and deep patent portfolio, give META a competitive advantage as it works to penetrate addressable markets that are collectively well in excess of US$50 billion.”
META’s total revenue grew year-over-year (YOY) in the third quarter by 329% to US$2.5 million and 388% to US$8.8 million over the first nine months versus the same period in 2021.
But operating expenses also doubled YOY to US$23.9 million following several important acquisitions, analyst MacMurray Whale of Cormark Securities pointed out.
The company’s Q3 net loss increased to US$24.5 million, or US$0.07 per share, on 362.2 million weighted average shares, compared to US$11.4 million, or US$0.04 per share, on 280 million weighted average shares in Q3 2021.
But operating expenses also doubled YOY to US$23.9 million following several important acquisitions, analyst MacMurray Whale of Cormark Securities pointed out.
“MMAT has many early-stage projects across a number of different verticals, most of which have not entered into commercial-scale production,” he wrote.
Hundreds of Patents
Metamaterials were first developed in the 1960s but only came into their own in the 2000s, when design and manufacturing capabilities caught up to the technology. The company is using them to develop nanotechnology products like self-deicing and defogging car and truck headlights and windows, see-through antennas, augmented reality glasses that look like regular glasses, and special eyewear that protects pilots’ eyes from laser strikes.
META is applying its futuristic technology to the communications, health and wellness, aerospace, automotive, and clean energy sectors.
ROTH has a Buy rating on META with a target of US$2.
The company has 472 active patent documents, of which 292 patents have been granted across all its technologies.
“META has been innovating over the last ten years,” President, Chief Executive Officer, and founder George Palikaras said in a video on META’s website. “We start with the design using computer algorithms that design the functions of the designed material . . . We can use a single computer with a single engineer and reduce the time to designing and innovating in the material space from six months down to a few hours.”
He said that reduces costs and makes META “a preferred partner and a preferred developer that enables a wide range of applications in the industry.”
Its NANOWEB® product is the “most transparent and conductive film available today on the market,” Palikaras said.
The global market for lithium-ion battery separators was estimated at US$5.1 billion in 2021 and is projected to reach US$9 billion by 2025, Yano Research Institute Ltd. said.
META also was granted U.S. patents for its second-generation NPORE® nanoporous ceramic separator and its third-generation NPORE® ECS (electrode-coated separator) for lithium-ion batteries.
The global market for lithium-ion battery separators was estimated at US$5.1 billion in 2021 and is projected to reach US$9 billion by 2025, Yano Research Institute Ltd. said.
META also has entered a memo of understanding with DuPont Teijin Films and Mitsubishi Electric Europe to use Meta’s PLASMAfusion to scale a high-volume manufacturing system for film-based, coated copper current collectors. The process reduces the amount of the red metal needed for EV batteries.
Ownership and Share Structure
Major shareholders include Thomas Gordon Welch, with 6.64% or 24 million shares; Anne Barber Lambert, with 6.39% or 23.14 million shares; Lamda Guard Technologies Ltd., with 6.35% or 22.98 million shares; Nova Scotia Innovation Corp., with 3.45% or 12.5 million shares; and Georgios Palikaras, with 1.92% or 6.96 million shares. About 14% of META is held institutionally held.
The stock is covered by numerous analysts, including SingularResearch’s Christopher J. Sakai, ROTH Capital Partners’ Gerry Sweeney, as well as Cormark Securities’ MacMurray Whale, and newsletter writer Clive Maund of Clivemaund.com. Click “See More Live Data” in the data box above to review more.
The company has a market cap of $419.84 million with 361.9 million shares outstanding, 267 million of them free-floating. It trades in a 52-week range of US$2.95 and US$0.63.
Disclosures: 1) Steve Sobek wrote this article for Streetwise Reports LLC. He or members of his household own securities of the following companies mentioned in the article: None. He or members of his household are paid by the following companies mentioned in this article: None. His/her company has a financial relationship with the following companies referred to in this article: None.
2) The following companies mentioned in this article are billboard sponsors of Streetwise Reports: Meta Materials Inc. Click here for important disclosures about sponsor fees. The information provided above is for informational purposes only and is not a recommendation to buy or sell any security.
3) The article does not constitute investment advice. Each reader is encouraged to consult with his or her individual financial professional and any action a reader takes as a result of information presented here is his or her own responsibility. By opening this page, each reader accepts and agrees to Streetwise Reports’ terms of use and full legal disclaimer. This article is not a solicitation for investment. Streetwise Reports does not render general or specific investment advice and the information on Streetwise Reports should not be considered a recommendation to buy or sell any security. Streetwise Reports does not endorse or recommend the business, products, services or securities of any company mentioned on Streetwise Reports.
4) From time to time, Streetwise Reports LLC and its directors, officers, employees or members of their families, as well as persons interviewed for articles and interviews on the site, may have a long or short position in securities mentioned. Directors, officers, employees or members of their immediate families are prohibited from making purchases and/or sales of those securities in the open market or otherwise from the time of the decision to publish an article until three business days after the publication of the article. The foregoing prohibition does not apply to articles that in substance only restate previously published company releases. As of the date of this article, officers and/or employees of Streetwise Reports LLC (including members of their household) own securities of Meta Materials Inc., a company mentioned in this article.
Technical analyst Clive Maund reviews Algernon Pharmaceuticals Inc.’s 6-month, 3-year, and 9-year charts to tell you whether you should be interested in this pharma company.
Another stock that appears to be at stony rock bottom is Algernon Pharmaceuticals Inc. (AGN:CSE; AGNPF:OTCQB; AGN0:XFRA), and it has two things going for it — one is that it could come out with positive news at any time that could get it moving and the other is that, with only 2.3 million shares in issue, when it does move it is likely to result in big percentage gains, as happened back last January when it rocketed from CA$4 to CA$12 in a matter of a couple of weeks, a move which we rode.
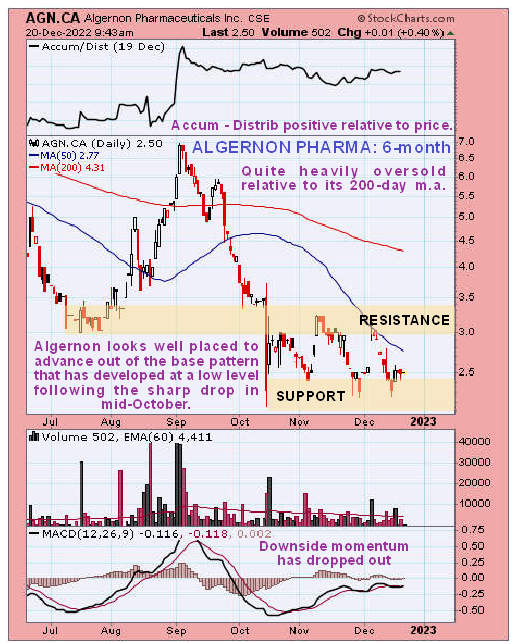
On its 6-month chart, we can see that after dropping hard in mid-October, it has marked out a low trading range that has allowed downside momentum to drop out and the 50-day moving average has dropped down close to the price, in the process opening up a quite large gap between it and the 200-day and these factors taken together make a rally soon increasingly likely with the relatively strong Accumulation line over the past several months being another positive factor.
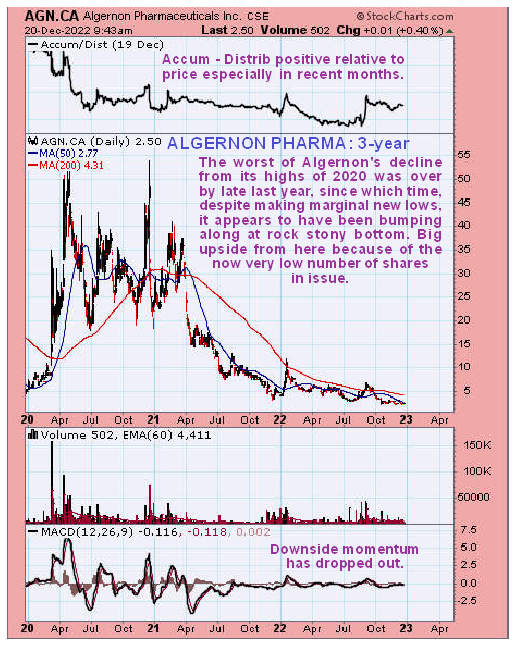
Zooming out on a 3-year chart enables us to put recent action in more perspective (note that this chart and the 9-year we are also looking at have been adjusted for a one-for-100-share rollback about a year ago, which explains the low number of shares in issue).
On this chart, we see that Algernon is now extraordinarily cheap as it has dropped back from a peak at over CA$53 in 2020 to the current miserly price of CA$2.50. The worst decline was behind it by late last year, since which time, although it has continued to make new lows, the rate of decline has slowed, with, as mentioned above, the Accumulation line showing a marked positive divergence in recent months.
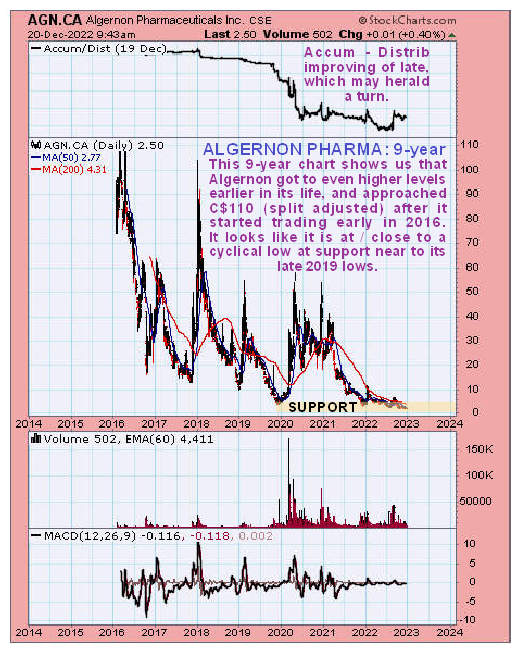
The 9-year chart shows us the entire history of the stock, and on this chart, we see that it got to even higher levels than we saw in 2020, as back in 2016, shortly after it started trading, it got close to CA$110 and at the start of 2018 it spiked to about CA$103.
It looks like it is making a cyclical low here, close to the late 2019 lows.
Even without factoring in the extremely low number of shares in issue, Algernon looks like it is at a low here with a very favorable risk/reward ratio, which is magnified enormously by the low number of shares in issue, as any good news coming through – and there is believed to be some coming through soon — could see it take off strongly higher.
Algernon is therefore rated a strong speculative Buy here.
Algernon Pharmaceuticals Inc. closed at CA$2.50, $1.76 on December 20, 2022.
CliveMaund.com Disclosures
The above represents the opinion and analysis of Mr. Maund, based on data available to him, at the time of writing. Mr. Maund’s opinions are his own, and are not a recommendation or an offer to buy or sell securities. Mr. Maund is an independent analyst who receives no compensation of any kind from any groups, individuals or corporations mentioned in his reports. As trading and investing in any financial markets may involve serious risk of loss, Mr. Maund recommends that you consult with a qualified investment advisor, one licensed by appropriate regulatory agencies in your legal jurisdiction and do your own due diligence and research when making any kind of a transaction with financial ramifications. Although a qualified and experienced stock market analyst, Clive Maund is not a Registered Securities Advisor. Therefore Mr. Maund’s opinions on the market and stocks can only be construed as a solicitation to buy and sell securities when they are subject to the prior approval and endorsement of a Registered Securities Advisor operating in accordance with the appropriate regulations in your area of jurisdiction.
Disclosures: 1) Clive Maund: I, or members of my immediate household or family, own securities of the following companies mentioned in this article: None. I personally am, or members of my immediate household or family are, paid by the following companies mentioned in this article: None.
2) The following companies mentioned in this article are billboard sponsors of Streetwise Reports:Algernon Pharmaceuticals Inc. Click here for important disclosures about sponsor fees. As of the date of this article, an affiliate of Streetwise Reports has a consulting relationship with Algernon Pharmaceuticals Inc. Please click here for more information.
3) Statements and opinions expressed are the opinions of the author and not of Streetwise Reports or its officers. The author is wholly responsible for the validity of the statements. The author was not paid by Streetwise Reports for this article. Streetwise Reports was not paid by the author to publish or syndicate this article. Streetwise Reports requires contributing authors to disclose any shareholdings in, or economic relationships with, companies that they write about. Streetwise Reports relies upon the authors to accurately provide this information and Streetwise Reports has no means of verifying its accuracy.
4) This article does not constitute investment advice. Each reader is encouraged to consult with his or her individual financial professional and any action a reader takes as a result of information presented here is his or her own responsibility. By opening this page, each reader accepts and agrees to Streetwise Reports’ terms of use and full legal disclaimer. This article is not a solicitation for investment. Streetwise Reports does not render general or specific investment advice and the information on Streetwise Reports should not be considered a recommendation to buy or sell any security. Streetwise Reports does not endorse or recommend the business, products, services or securities of any company mentioned on Streetwise Reports.
5) From time to time, Streetwise Reports LLC and its directors, officers, employees or members of their families, as well as persons interviewed for articles and interviews on the site, may have a long or short position in securities mentioned. Directors, officers, employees or members of their immediate families are prohibited from making purchases and/or sales of those securities in the open market or otherwise from the time of the decision to publish an article until three business days after the publication of the article. The foregoing prohibition does not apply to articles that in substance only restate previously published company releases. As of the date of this article, officers and/or employees of Streetwise Reports LLC (including members of their household) own securities of Algernon Pharmaceuticals Inc., a company mentioned in this article.
6) This article does not constitute medical advice. Officers, employees and contributors to Streetwise Reports are not licensed medical professionals. Readers should always contact their healthcare professionals for medical advice.
These upcoming events relate to this firm’s efforts to get one or more of its technologies integrated into an existing product and sold commercially, noted a Water Tower Research report.
In 2023 Meta Materials Inc. (MMAT:NASDAQ; MMAX:CSE; MMAT:FSE) is slated to showcase some of its technologies at the Consumer Electronics Show (CES) Jan. 5 to 8, 2023, in Las Vegas, Nev., and is expected to announce its first commercial production contract sometime during the year, reported Graham Mattison, a senior research analyst at Water Tower Research, in a Dec. 19 research note.
Mattison wrote that on the first day of the expo, Meta Materials will participate in ShowStoppers at CES 2023, a presentation of new technologies to the media, industry leaders, and advocates.
During all four days of CES, the Nova Scotia, Canada-based company will host Booth 9417 in the North Hall, where some of its technologies, all of which improve existing products in an important way, will be on exhibit.
Another catalyst to watch for in 2023 is the announcement of Meta Materials’ first technology being commercially incorporated into a product. This would constitute “a major milestone in the company’s growth of commercial revenues,” Mattison wrote.
Meta Materials will showcase its NANOWEB transparent electromagnetic interference shield installed in the door of a microwave oven.
The company also will demonstrate its NANOWEB heaters for deicing/defogging of advanced driver-assistance systems sensors; its NANOWEB antennas and electrochromic lenses for augmented reality eyewear; its NANOWEB 5G reflector films for managing signal propagation indoors and outdoors; and its NPORE nanocomposite ceramic battery separator.
These collectors, which reduce copper usage and improve safety, will be displayed in the company’s booth and incorporated into the exhibited Project Arrow concept electric vehicle.
Another catalyst to watch for in 2023 is the announcement of Meta Materials’ first technology being commercially incorporated into a product. This would constitute “a major milestone in the company’s growth of commercial revenues,” Mattison wrote.
Water Tower Research purported this technology likely will be NANOWEB for application in microwave oven doors, given several factors. One, this could be brought to the consumer product market quickly. High-end microwaves are an ideal initial target market, given their consumers will be less price-conscious and their manufacturers seek new technology to gain market share. Also, microwave ovens are ideal for the product size Meta Materials can currently produce.
To get an idea of the size of the market for these appliances, Mattison noted, “it is estimated that about 70 million microwaves are sold each year, with the typical replacement being about seven to 10 years.”
Meta Materials is currently trading at about $1.41 per share.
Disclosures: 1) Doresa Banning wrote this article for Streetwise Reports LLC and provides services to Streetwise Reports as an independent contractor. She or members of her household own securities of the following companies mentioned in the article: None. She or members of her household are paid by the following companies mentioned in this article: None.
2) The following companies mentioned in this article are billboard sponsors of Streetwise Reports: Meta Materials Inc. Click here for important disclosures about sponsor fees. The information provided above is for informational purposes only and is not a recommendation to buy or sell any security.
3) Statements and opinions expressed are the opinions of the author and not of Streetwise Reports or its officers. The author is wholly responsible for the validity of the statements. The author was not paid by Streetwise Reports for this article. Streetwise Reports was not paid by the author to publish or syndicate this article. Streetwise Reports requires contributing authors to disclose any shareholdings in, or economic relationships with, companies that they write about. Streetwise Reports relies upon the authors to accurately provide this information and Streetwise Reports has no means of verifying its accuracy.
4) This article does not constitute investment advice. Each reader is encouraged to consult with his or her individual financial professional and any action a reader takes as a result of information presented here is his or her own responsibility. By opening this page, each reader accepts and agrees to Streetwise Reports’ terms of use and full legal disclaimer. This article is not a solicitation for investment. Streetwise Reports does not render general or specific investment advice and the information on Streetwise Reports should not be considered a recommendation to buy or sell any security. Streetwise Reports does not endorse or recommend the business, products, services or securities of any company mentioned on Streetwise Reports.
5) From time to time, Streetwise Reports LLC and its directors, officers, employees or members of their families, as well as persons interviewed for articles and interviews on the site, may have a long or short position in securities mentioned. Directors, officers, employees or members of their immediate families are prohibited from making purchases and/or sales of those securities in the open market or otherwise from the time of the decision to publish an article until three business days after the publication of the article. The foregoing prohibition does not apply to articles that in substance only restate previously published company releases.
Disclosures For Water Tower Research, Meta Materials Inc., December 19, 2022
Water Tower Research (“WTR”) is a professional publisher of investment research reports on public companies and, to a lesser extent, private firms (“the Companies”). WTR provides investor-focused content and digital distribution strategies designed to help companies communicate with investors.
WTR is not a registered investment adviser or a broker/dealer nor does WTR provide investment banking services. WTR operates as an exempt investment adviser under the so called “publishers’ exemption” from the definition of investment adviser under Section 202(a)(11) of the Investment Advisers Act of 1940. WTR does not provide investment ratings / recommendations or price targets on the companies it reports on. Readers are advised that the research reports are published and provided solely for informational purposes and should not be construed as an offer to sell or the solicitation of an offer to buy securities or the rendering of investment advice.
The information provided in this report should not be construed in any manner whatsoever as personalized advice. All users and readers of WTR’s reports are cautioned to consult their own independent financial, tax and legal advisors prior to purchasing or selling securities. Graham Mattison, who is the writer of this report, covers the ClimateTech & Sustainable Investing sector for WTR. Mr. Mattison and members of his household have no personal or business-related relationship to the subject company other than providing digital content and any ancillary services WTR may offer.
Unless otherwise indicated, WTR intends to provide continuing coverage of the covered companies. WTR will notify its readers through website postings or other appropriate means if WTR determines to terminate coverage of any of the companies covered. WTR is being compensated for its research by the company which is the subject of this report. WTR may receive up to $14,000 per month [for research and potentially other services] from a given client and is required to have at least a 1-year commitment. None of the earned fees are contingent on, and WTR’s client agreements are not cancellable for the content of its reports. WTR does not accept any compensation in the form of warrants or stock options or other equity instruments that could increase in value based on positive coverage in its reports.
WTR or an affiliate may seek to receive compensation for non-research services to covered companies, such as charges for presenting at sponsored investor conferences, distributing press releases, advising on investor relations and broader corporate communications and public relations strategies as well as performing certain other related services (“Ancillary Services”). The companies that WTR covers in our research are not required to purchase or use Ancillary Services that WTR or an affiliate might offer to clients.
The manner of WTR’s research compensation and Ancillary Services to covered companies raise actual and perceived conflicts of interest. WTR is committed to manage those conflicts to protect its reputation and the objectivity of employees/analysts by adhering to strictly-written compliance guidelines. The views and analyses included in our research reports are based on current public information that we consider to be reliable, but no representation or warranty, expressed or implied, is made as to their accuracy, completeness, timeliness, or correctness. Neither we nor our analysts, directors, officers, employees, representatives, independent contractors, agents or affiliate shall be liable for any omissions, errors or inaccuracies, regardless of cause, foreseeability or the lack of timeliness of, or any delay or interruptions in the transmission of our reports to content users.
This lack of liability extends to direct, indirect, incidental, exemplary, compensatory, punitive, special or consequential damages, costs, expenses, legal fees, losses, lost income, lost profit or opportunity costs. All investment information contained herein should be independently verified by the reader or user of this report. For additional information, all readers of this report are encouraged to visit WTR’s website www.watertowerresearch.com.
The US indices traded yesterday without a single trend. By Tuesday’s stock market close, the Dow Jones Index (US30) increased by 0.11%, while the S&P 500 Index (US500) decreased by 0.40%. The NASDAQ Technology Index (US100) fell by 1.38%.
A Wedbush Securities research report indicated that the decline in tech stocks, including Apple, Amazon, and Microsoft, should turn into a sharp rebound next year as companies think about protecting their profitability and the US Federal Reserve will sooner or later begin to wind down its rate hike campaign. The undeniable fact remains that US inflation is too high. And if the US economy does enter a recession with a Consumer Price Index over 5%, the Fed would be in a quandary because they have little room to stimulate the economy. This would be a scenario that the Federal Reserve would try to avoid, which also helps explain why the Fed is moving forward so aggressively.
Joseph Trevisani, the senior analyst at FXStreet.com, said historical patterns suggest that investors next month are likely to benefit from the recent gains in the euro and yen, which could support the dollar in the short term.
Equity markets in Europe were mostly up yesterday. Germany’s DAX (DE30) gained 0.39% yesterday, France’s CAC 40 (FR40) added 0.70%, Spain’s IBEX 35 index (ES35) closed around opening levels, and Britain’s FTSE 100 (UK100) not trading due to the bank holiday.
European Central Bank President Luis de Guindos believes that the Eurozone is in a very difficult economic situation. Inflation remains high and economic growth in Europe remains low, so the ECB finds itself in a difficult position when it has to raise rates amid the recession, as is happening in the UK at the moment. The main question analysts are asking is whether the ECB can stay hawkish, with inflation above 10%, without hurting the European economy too much. The same can be said for the Bank of England, and that makes the prospect of a weaker euro and sterling an attractive scenario for next year.
Oil hit a 3-week-high amid loosening COVID-19 restrictions in China, with US production levels down due to the winter storm. About 450,000-500,000 barrels a day of oil were cut over the Christmas weekend in the United States. The weather in the US is predicted to improve this week, which could lead to a slight decline in oil prices.
Russian President Vladimir Putin on Tuesday signed a decree banning the supply of oil and petroleum products to countries participating in the price cap for five months from February 1.
Part of the Asian market did not trade yesterday. Japan’s Nikkei 225 (JP225) gained 0.16%, China’s FTSE China A50 (CHA50) added 0.76%, India’s NIFTY 50 (IND50) increased by 0.65%, Hong Kong’s Hang Seng (HK50) and S&P/ASX 200 (AU200) were not trading due to the bank holiday.
China said it would abolish the COVID-19 quarantine rule for incoming travelers, an important step toward opening its borders even as the number of COVID-19 cases has surged. China will stop requiring incoming travelers to undergo quarantine as of January 8.
Bank of Japan (BOJ) policymakers discussed the growing prospect that higher wages could finally eliminate the risk of a return to deflation. While markets are growing expectations that Japan’s Central Bank is likely to change its policies, investors’ attention is likely to focus on who will lead the BOJ when Governor Haruhiko Kuroda steps down in April. Analysts are confident that a policy review will follow the appointment of a new governor in the second quarter of 2023.
S&P 500 (F) (US500) 3,829.25 −15.57 (−0.40%)
Dow Jones (US30) 33,241.56 +37.63 (+0.11%)
DAX (DE40) 13,995.10 +54.17 (+0.39%)
FTSE 100 (UK100) 7,473.01 0 (0%)
USD Index 104.19 -0.13 (-0.12%)
Important events for today:
– Japan Industrial Production (m/m) at 01:50 (GMT+2);
This article reflects a personal opinion and should not be interpreted as an investment advice, and/or offer, and/or a persistent request for carrying out financial transactions, and/or a guarantee, and/or a forecast of future events.
Markets are very much in holiday mode with very thin volumes and light liquidity.
This means we see choppy price action with swings between gains and losses in very quick time. Big trading desks at banks and funds are manned with skeletal staff so position sizing is minimal and new bets are not being taken until the new year.
The well-known Santa Rally in US stocks may struggle this year with the broader S&P 500 index closing lower by 0.4% after clawing back some early losses.
What does the “Santa Rally” typically look like?
The fabled festive move higher in stocks implies gains over the last five trading days of the year and the first two of the new year.
Returns over that period average 1.3% compared with 0.2% for any rolling seven-day trading period.
Growth stocks were hurt yesterday by various factors including higher Treasury yields.
The tech-laden Nasdaq finished 1.4% lower with some individual megacap growth stocks especially hit by selling.
Apple finished 1.4% lower as worries still linger about covid-19 and its China production facilities. Earlier in the session, the tech giant hit their lowest point since June 2021. The June low from this year at $129.04 is strong support for the bulls.
Meanwhile, Tesla tanked again, plunging 11.4% and bringing the total of this month’s losses to nearly 44%. The worst month in at least 10 years has been brought about by the distraction for CEO Elon Musk running his new company, Twitter. A potential sales slowdown at the EV-maker has also not helped, with Reuters reporting that a reduced production schedule in China would be extended into January.
Some of the former darlings of the market have suffered hugely with Facebook parent Meta slumping 65% and once-all-conquering Amazon falling around 50%.
Investors are keen to see the 2022 exit door with the Nasdaq Composite tumbling close to 34% so far this year.
Key for the new year will be inflation and the Fed’s policy tightening path with questions around a recession or soft landing.
Research shows that a bear market has never bottomed before the start of a recession.
On H4, the quotes are under the 200-day Moving Average, which indicates prevalence of a downtrend. The RSI has exited the overbought area. A test of 2/8 (81.25) should be expected, followed by a breakaway and falling to the support level of 1/8 (78.12). The scenario can be cancelled by an upwards breakaway of the resistance level of 3/8 (84.38), which might lead to a trend reversal and price growth to the resistance level of 4/8 (87.50).
On M15, the lower line of VoltyChannel is broken away, which confirms the downtrend and increases the chances for further price falling.
S&P 500
On H4, the quotes have bounced off 0/8 (3750.0), which is the upper border of the oversold area. The RSI is testing the resistance line. The quotes are expected to rise above 1/8 (3906.2) and then reach the resistance level of 2/8 (4062.5). The scenario can be cancelled by a downward breakaway of the support level of 0/8 (3750.0). In this case, the S&P 500 index will continue falling, and the quotes might reach -1/8 (3593.8).
On M15, an additional signal confirming growth will be a breakaway of the upper border of VoltyChannel.
Attention! Forecasts presented in this section only reflect the author’s private opinion and should not be considered as guidance for trading. RoboForex LP bears no responsibility for trading results based on trading recommendations described in these analytical reviews.
Stock markets found some buyers amid low volumes and holiday liquidity yesterday, with the benchmark S&P 500 enjoying its best session in over a week.
The clue-chip index added close to 1.5%, likewise the other Wall Street indices in a session that got bulls talking about a Santa Rally.
What is a ‘Santa Rally’?
Market commentators tend to use the ‘Santa Rally’ term quite broadly to refer to either the entire month of December or a relatively longer time period.
But this term actually refers to the last week of December and the first two trading days of the new year. That is when markets increase in value.
Research shows that this single 7-day period has produced a positive return for the S&P 500 79% of the time. No other similar time period is more likely to be higher.
Of course, seasonality and calendar theories are not a guaranteed way to make profits as it is tough to predict what will impact markets in any given year.
But the January effect when institutional investors ready themselves for the new year to set up positions for the coming weeks can be a positive phenomenon.
These types of investors may also rebalance portfolios for tax-loss selling in December to close out losses, followed by repurchasing in January.
Why are stocks climbing this week?
The risk mood rebounded as US headline consumer confidence improved to the highest level since April while better-than-expected earnings from Nike and FedEx also helped boost sentiment.
That said, markets ignored more depressing housing data.
Existing home sales fell for a tenth straight month as the historic surge in US mortgage rate this year continue to pressure the US housing market. This theme may play out across the new year and slowly impact other parts of the economy.
With such macro data in mind, the S&P 500 has bounced off a Fib level (23.6%) of the market’s year-to-date declines.
The index is now toying with the 50-day simple moving average at 3893.4 as the immediate resistance level, with the 100-day simple moving average above at 3917.6.