Investors around the world will be closely following China’s National People’s Congress (NPC), which kicks off this weekend, for signals about which sectors are likely to benefit from President Xi’s latest political and economic developments.
The NPC is one of the most important political events in the world’s second-largest economy. It is the annual meeting of the highest organ of state power and the country’s top legislative body.
Nigel Green, CEO and founder of deVere Group, one of the world’s largest independent financial advisory, asset management and fintech organizations, says: “Investors always closely watch the NPC for any indicators about changes in economic policies that could impact financial markets and business in China – but this year’s event is more critical.
“This is the first NPC since China has moved away from its zero-Covid policy to combat the pandemic. It also comes as Xi tightens his grip on power.”
“Global investors will be looking for signals on China’s policy priorities and goals, and potential opportunities and risks.”
He believes that there are likely to be five sectors that could benefit from the latest policy agenda to be set out this weekend.
First, tech. “China’s focus on innovation and tech has been a major theme in previous NPC events. Beijing has committed to increasing investment in areas such as artificial intelligence, semiconductors, and 5G.
“Domestic and foreign companies involved in these sectors could receive increased government support,” affirms Nigel Green.
Second, infrastructure. “The NPC typically includes rhetoric about infrastructure investment, including plans for new roads, railways, amongst other public works projects.”
Third, healthcare. The deVere Group CEO notes that “China’s aging population has led to increased demand for healthcare services, and the government has made improving healthcare a priority, including further investment in areas such as medical research, new hospitals and pharmaceuticals.”
Fourth, renewable energy. “Beijing has set ambitious targets for slashing greenhouse gas emissions, and the NPC often includes highlights on how it aims to achieve these targets.”
Fifth, consumer goods. Nigel Green says: “As China’s middle class continues to grow, there’s increasing demand for quality consumer goods. Entities involved in areas such as retail, luxury goods, and e-commerce will benefit from increased consumer spending.”
Last week, President Xi encouraged bankers in China to ‘clean up’ their western lifestyles and be less ‘hedonistic.’
“This reflects his wider aim to promote traditional Chinese values, tackle corruption, and maintain social stability and a more modest way of life,” says the deVere CEO.
“The importance of this event for global investors, which will shape the world’s second-largest economy, cannot be overestimated,” he concludes.
About:
deVere Group is one of the world’s largest independent advisors of specialist global financial solutions to international, local mass affluent, and high-net-worth clients. It has a network of more than 70 offices across the world, over 80,000 clients and $12bn under advisement.
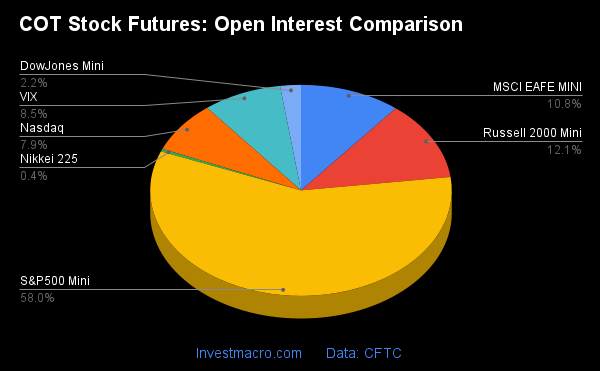
Here are the latest charts and statistics for the Commitment of Traders (COT) data published by the Commodities Futures Trading Commission (CFTC).
The latest COT data is updated through Tuesday January 31st and shows a quick view of how large traders (for-profit speculators and commercial entities) were positioned in the futures markets.
*** This data is almost a month old because the CFTC up-to-date data has been delayed due to a cybersecurity event that happened in early February to ION Cleared Derivatives (a subsidiary of ION Markets). This hack of ION has created a problem for the large trader positions to be reported and reconciled. The CFTC states that they will be back-filling the data over the next couple weeks and will get the data back up to date.
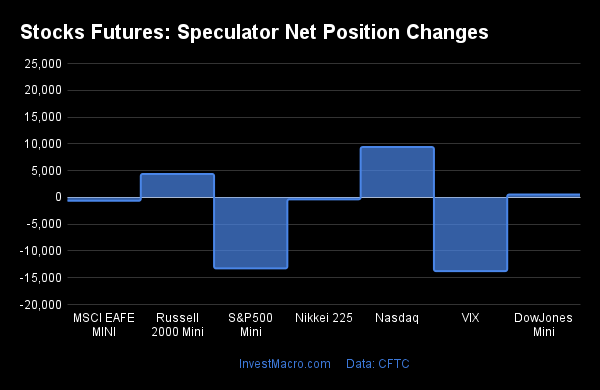
Weekly Speculator Changes led by Nasdaq-Mini
The COT stock markets speculator bets were mixed as four out of the eight stock markets we cover had higher positioning while the other four markets had lower speculator contracts.
Leading the gains for the stock markets was the Nasdaq-Mini (9,403 contracts) with the Russell-Mini (4,377 contracts), Nikkei 225 Yen (2,632 contracts) and DowJones-Mini (538 contracts) also showing positive weeks.
The markets with the declines in speculator bets for the week were the S&P500-Mini (-13,266 contracts) and VIX (-13,769 contracts) with the MSCI EAFE-Mini (-638 contracts) and the Nikkei 225 (-360 contracts) also registering lower bets on the week.
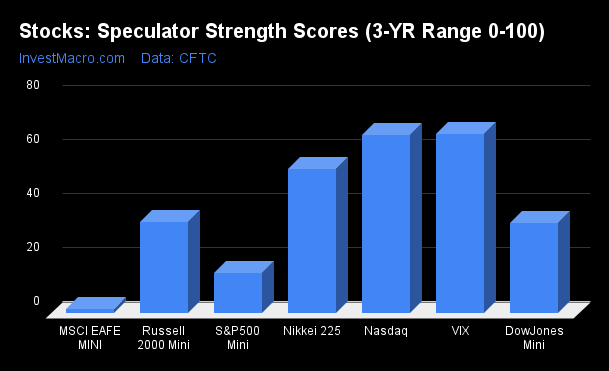
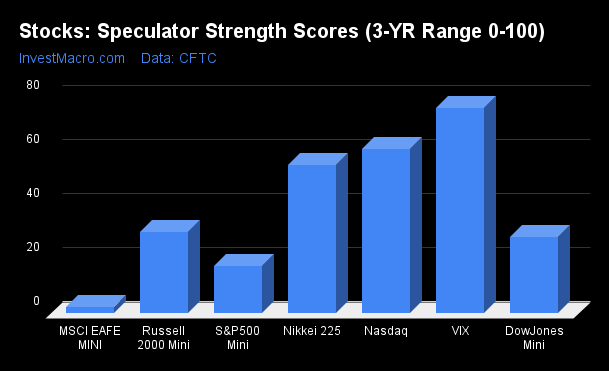
COT Strength Scores (a normalized measure of Speculator positions over a 3-Year range, from 0 to 100 where above 80 is Extreme-Bullish and below 20 is Extreme-Bearish) showed that the Nasdaq-Mini (66 percent) and the VIX (66 percent) led the stock markets. The Nikkei 225 Yen (62 percent) and Nikkei 225 (53 percent) come in as the next highest in the weekly strength scores.
On the downside, the MSCI EAFE-Mini (2 percent) and the S&P500-Mini (15 percent) come in at the lowest strength level currently and were in Extreme-Bearish territory (below 20 percent).
Strength Statistics: VIX (66.5 percent) vs VIX previous week (76.0 percent) S&P500-Mini (15.0 percent) vs S&P500-Mini previous week (17.5 percent) DowJones-Mini (33.4 percent) vs DowJones-Mini previous week (32.4 percent) Nasdaq-Mini (66.2 percent) vs Nasdaq-Mini previous week (60.9 percent) Russell2000-Mini (33.9 percent) vs Russell2000-Mini previous week (31.3 percent) Nikkei USD (53.4 percent) vs Nikkei USD previous week (55.1 percent) EAFE-Mini (1.6 percent) vs EAFE-Mini previous week (2.4 percent)
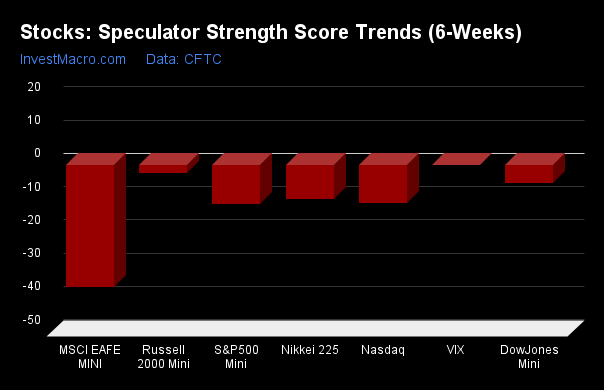
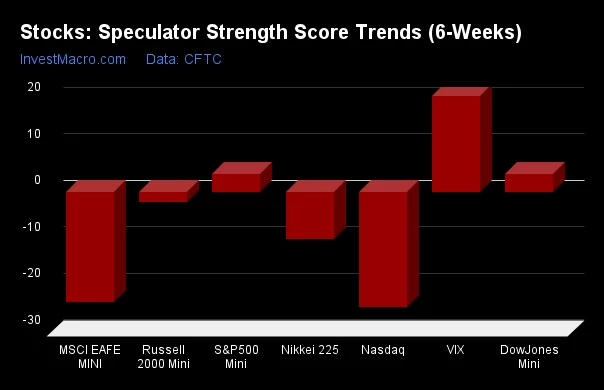
VIX led the 6-Week Strength Trends
COT Strength Score Trends (or move index, calculates the 6-week changes in strength scores) showed that just about all the markets had lower trend scores. The VIX was the only market with a score above 0 at a 0.2 percent trend score. The EAFE-Mini (-36.5 percent) had the lowest or most negative score that week followed by the S&P500-Mini (-11.6 percent).
Strength Trend Statistics: VIX (0.2 percent) vs VIX previous week (20.6 percent) S&P500-Mini (-11.6 percent) vs S&P500-Mini previous week (3.9 percent) DowJones-Mini (-5.2 percent) vs DowJones-Mini previous week (4.4 percent) Nasdaq-Mini (-11.4 percent) vs Nasdaq-Mini previous week (-24.8 percent) Russell2000-Mini (-2.4 percent) vs Russell2000-Mini previous week (-2.2 percent) Nikkei USD (-10.0 percent) vs Nikkei USD previous week (-10.0 percent) EAFE-Mini (-36.5 percent) vs EAFE-Mini previous week (-23.7 percent)
Individual Stock Market Charts:
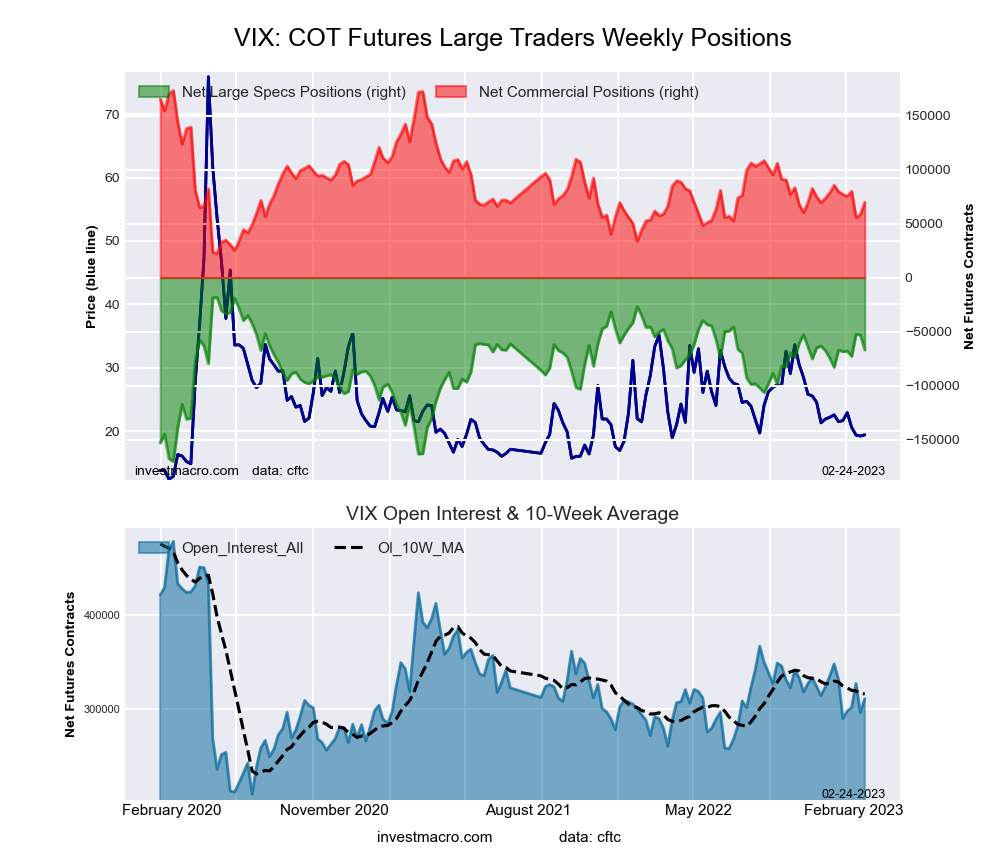
VIX Volatility Futures:
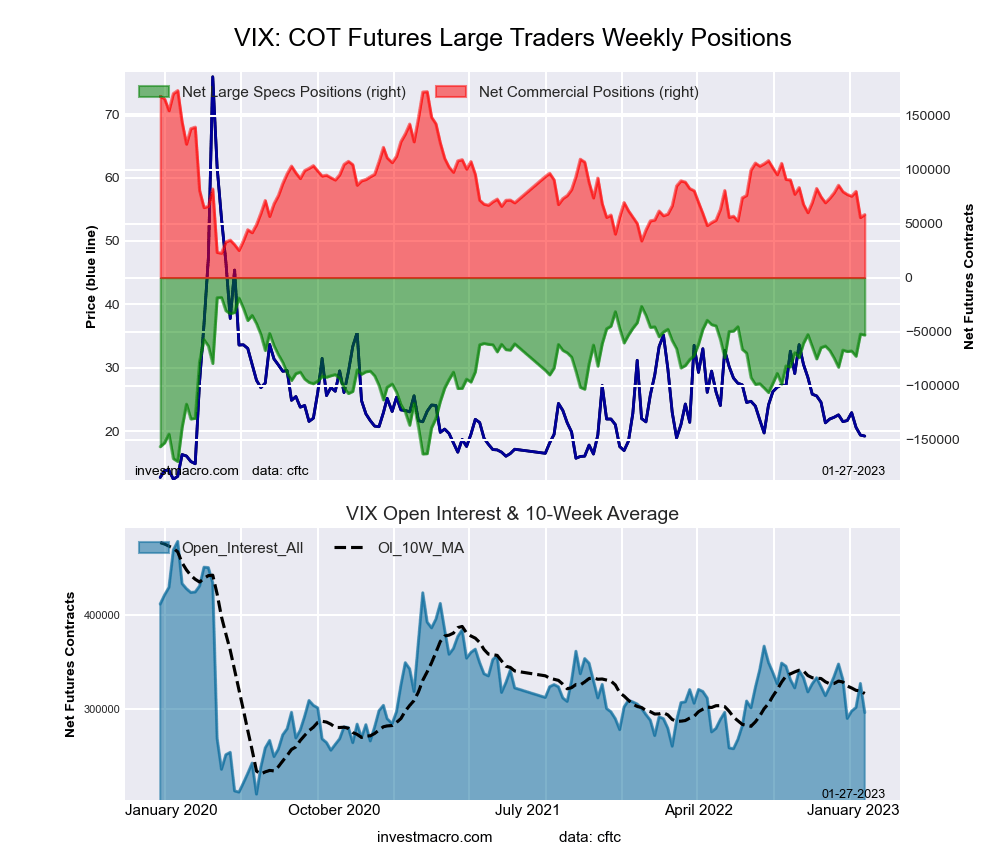
The VIX Volatility large speculator standing for the week totaled a net position of -66,918 contracts in the data reported through January 31st. This was a weekly lowering of -13,769 contracts from the previous week which had a total of -53,149 net contracts.
This week’s current strength score (the trader positioning range over the past three years, measured from 0 to 100) shows the speculators are currently Bullish with a score of 66.5 percent. The commercials are Bearish with a score of 31.5 percent and the small traders (not shown in chart) are Bullish with a score of 77.7 percent.
VIX Volatility Futures Statistics
SPECULATORS
COMMERCIALS
SMALL TRADERS
– Percent of Open Interest Longs:
17.0
57.7
7.9
– Percent of Open Interest Shorts:
38.6
35.2
8.8
– Net Position:
-66,918
69,707
-2,789
– Gross Longs:
52,935
178,998
24,430
– Gross Shorts:
119,853
109,291
27,219
– Long to Short Ratio:
0.4 to 1
1.6 to 1
0.9 to 1
NET POSITION TREND:
– Strength Index Score (3 Year Range Pct):
66.5
31.5
77.7
– Strength Index Reading (3 Year Range):
Bullish
Bearish
Bullish
NET POSITION MOVEMENT INDEX:
– 6-Week Change in Strength Index:
0.2
-6.5
46.0
S&P500 Mini Futures:
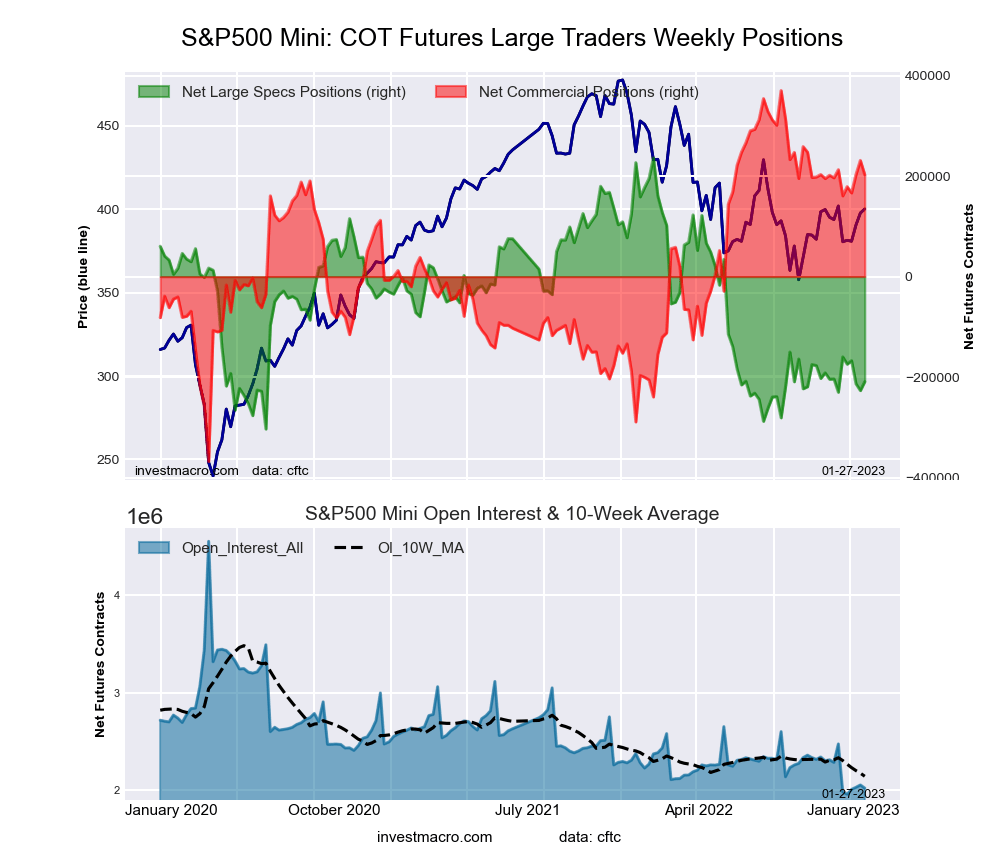
The S&P500 Mini large speculator standing for the week totaled a net position of -222,257 contracts in the data reported through January 31st. This was a weekly fall of -13,266 contracts from the previous week which had a total of -208,991 net contracts.
This week’s current strength score (the trader positioning range over the past three years, measured from 0 to 100) shows the speculators are currently Bearish-Extreme with a score of 15.0 percent. The commercials are Bullish-Extreme with a score of 81.6 percent and the small traders (not shown in chart) are Bearish with a score of 23.7 percent.
S&P500 Mini Futures Statistics
SPECULATORS
COMMERCIALS
SMALL TRADERS
– Percent of Open Interest Longs:
12.3
73.7
11.9
– Percent of Open Interest Shorts:
23.1
62.3
12.5
– Net Position:
-222,257
234,786
-12,529
– Gross Longs:
253,439
1,519,069
245,628
– Gross Shorts:
475,696
1,284,283
258,157
– Long to Short Ratio:
0.5 to 1
1.2 to 1
1.0 to 1
NET POSITION TREND:
– Strength Index Score (3 Year Range Pct):
15.0
81.6
23.7
– Strength Index Reading (3 Year Range):
Bearish-Extreme
Bullish-Extreme
Bearish
NET POSITION MOVEMENT INDEX:
– 6-Week Change in Strength Index:
-11.6
10.0
-2.4
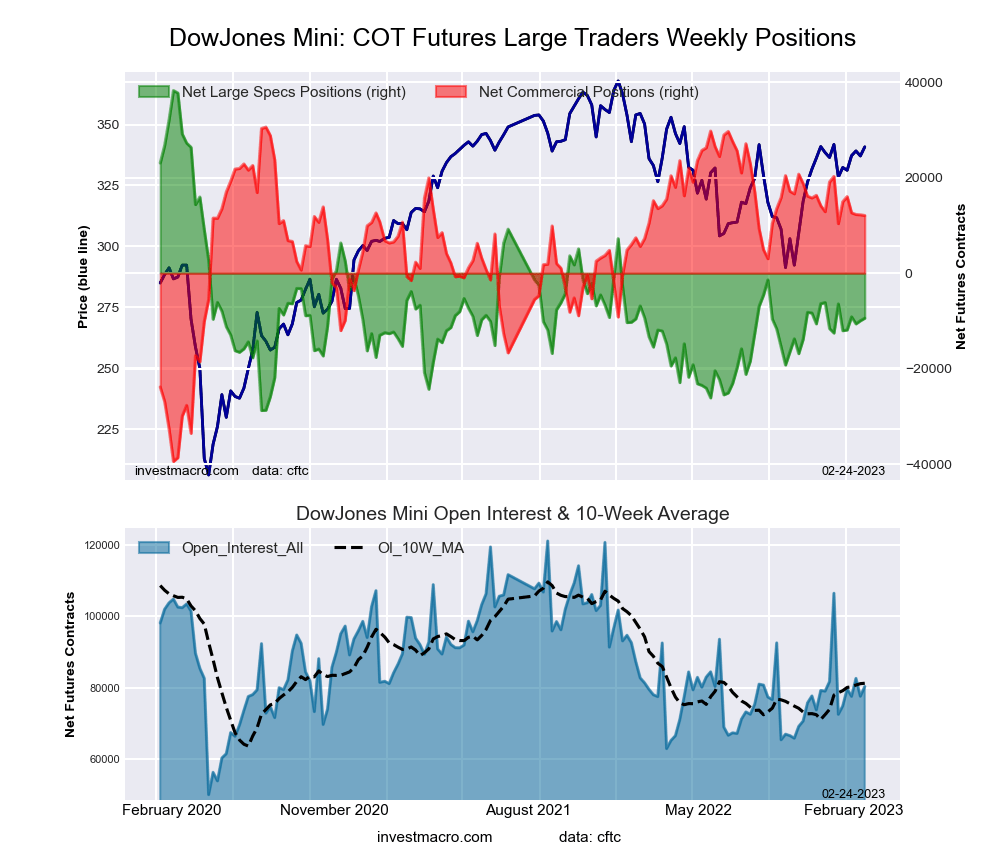
Dow Jones Mini Futures:
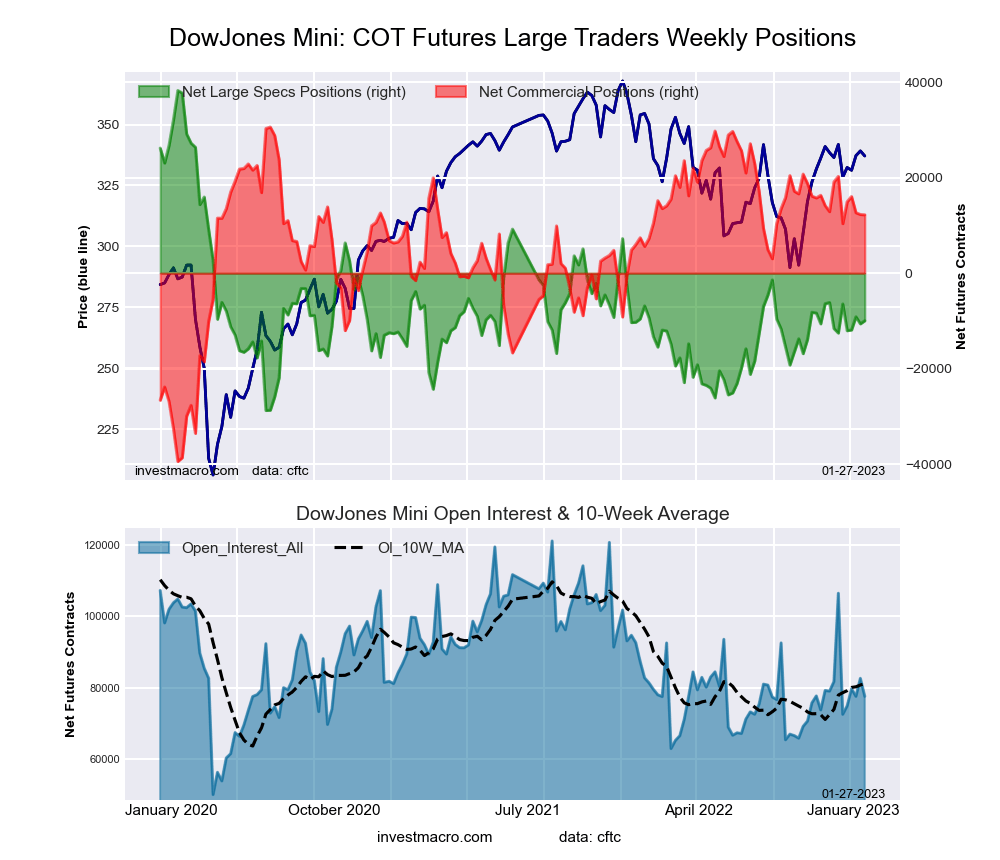
The Dow Jones Mini large speculator standing for the week totaled a net position of -9,428 contracts in the data reported through January 31st. This was a weekly advance of 538 contracts from the previous week which had a total of -9,966 net contracts.
This week’s current strength score (the trader positioning range over the past three years, measured from 0 to 100) shows the speculators are currently Bearish with a score of 33.4 percent. The commercials are Bullish with a score of 71.1 percent and the small traders (not shown in chart) are Bearish with a score of 27.2 percent.
Dow Jones Mini Futures Statistics
SPECULATORS
COMMERCIALS
SMALL TRADERS
– Percent of Open Interest Longs:
26.5
52.1
16.9
– Percent of Open Interest Shorts:
38.3
37.1
20.1
– Net Position:
-9,428
12,077
-2,649
– Gross Longs:
21,339
41,874
13,546
– Gross Shorts:
30,767
29,797
16,195
– Long to Short Ratio:
0.7 to 1
1.4 to 1
0.8 to 1
NET POSITION TREND:
– Strength Index Score (3 Year Range Pct):
33.4
71.1
27.2
– Strength Index Reading (3 Year Range):
Bearish
Bullish
Bearish
NET POSITION MOVEMENT INDEX:
– 6-Week Change in Strength Index:
-5.2
2.7
6.6
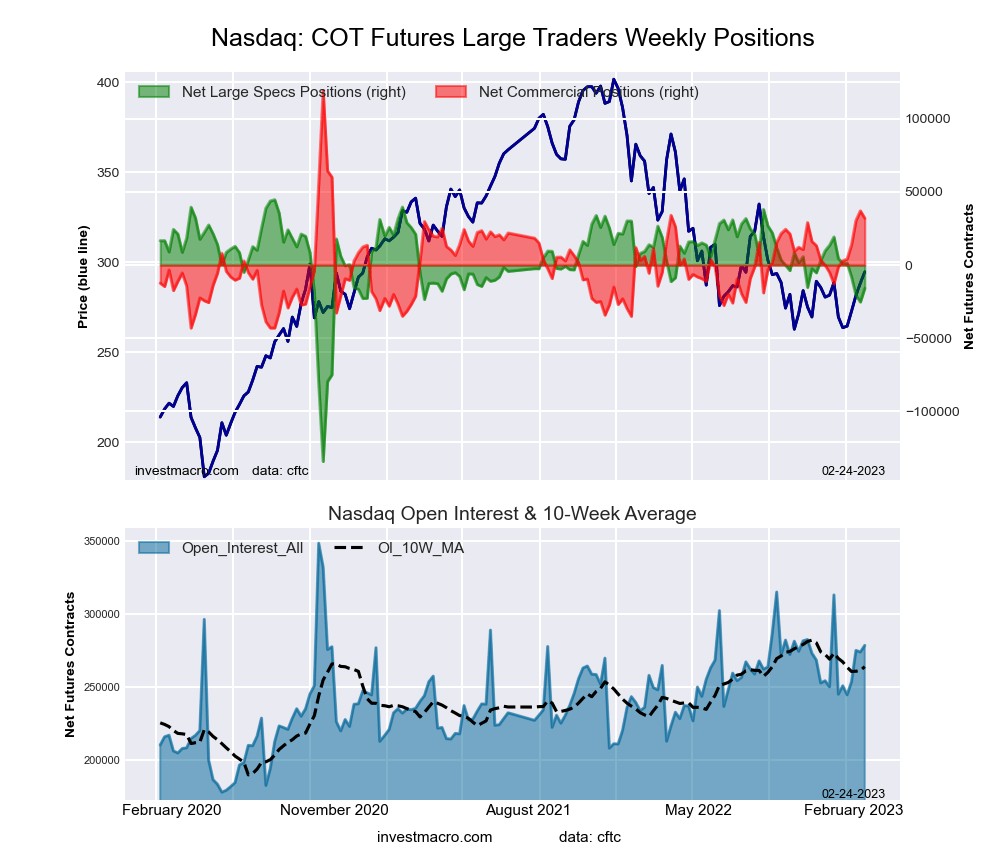
Nasdaq Mini Futures:
The Nasdaq Mini large speculator standing for the week totaled a net position of -15,858 contracts in the data reported through January 31st. This was a weekly boost of 9,403 contracts from the previous week which had a total of -25,261 net contracts.
This week’s current strength score (the trader positioning range over the past three years, measured from 0 to 100) shows the speculators are currently Bullish with a score of 66.2 percent. The commercials are Bearish with a score of 46.2 percent and the small traders (not shown in chart) are Bearish with a score of 21.3 percent.
Nasdaq Mini Futures Statistics
SPECULATORS
COMMERCIALS
SMALL TRADERS
– Percent of Open Interest Longs:
21.3
65.8
11.1
– Percent of Open Interest Shorts:
27.0
54.2
16.9
– Net Position:
-15,858
32,053
-16,195
– Gross Longs:
59,439
183,098
30,935
– Gross Shorts:
75,297
151,045
47,130
– Long to Short Ratio:
0.8 to 1
1.2 to 1
0.7 to 1
NET POSITION TREND:
– Strength Index Score (3 Year Range Pct):
66.2
46.2
21.3
– Strength Index Reading (3 Year Range):
Bullish
Bearish
Bearish
NET POSITION MOVEMENT INDEX:
– 6-Week Change in Strength Index:
-11.4
20.5
-24.8
Russell 2000 Mini Futures:
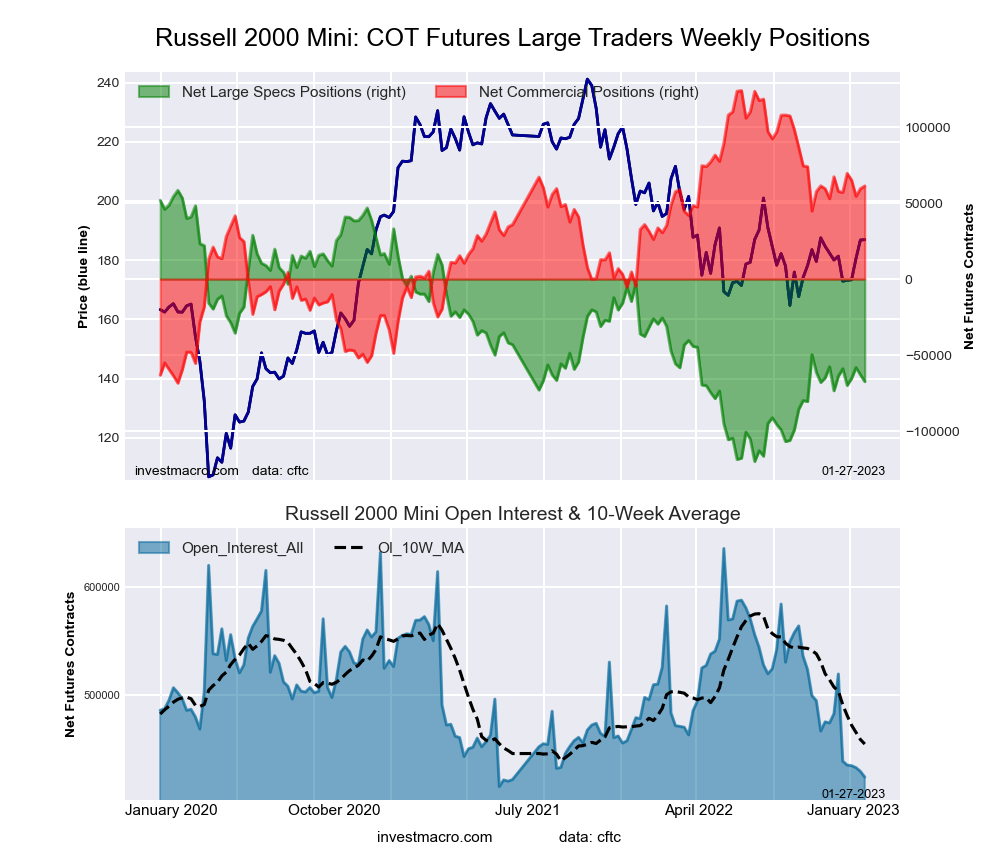
The Russell 2000 Mini large speculator standing for the week totaled a net position of -63,024 contracts in the data reported through January 31st. This was a weekly gain of 4,377 contracts from the previous week which had a total of -67,401 net contracts.
This week’s current strength score (the trader positioning range over the past three years, measured from 0 to 100) shows the speculators are currently Bearish with a score of 33.9 percent. The commercials are Bullish with a score of 62.7 percent and the small traders (not shown in chart) are Bearish with a score of 44.8 percent.
Russell 2000 Mini Futures Statistics
SPECULATORS
COMMERCIALS
SMALL TRADERS
– Percent of Open Interest Longs:
9.9
82.7
5.9
– Percent of Open Interest Shorts:
24.5
69.4
4.6
– Net Position:
-63,024
57,143
5,881
– Gross Longs:
42,702
356,143
25,493
– Gross Shorts:
105,726
299,000
19,612
– Long to Short Ratio:
0.4 to 1
1.2 to 1
1.3 to 1
NET POSITION TREND:
– Strength Index Score (3 Year Range Pct):
33.9
62.7
44.8
– Strength Index Reading (3 Year Range):
Bearish
Bullish
Bearish
NET POSITION MOVEMENT INDEX:
– 6-Week Change in Strength Index:
-2.4
0.1
12.4
Nikkei Stock Average (USD) Futures:
The Nikkei Stock Average (USD) large speculator standing for the week totaled a net position of -5,072 contracts in the data reported through January 31st. This was a weekly fall of -360 contracts from the previous week which had a total of -4,712 net contracts.
This week’s current strength score (the trader positioning range over the past three years, measured from 0 to 100) shows the speculators are currently Bullish with a score of 53.4 percent. The commercials are Bullish with a score of 57.0 percent and the small traders (not shown in chart) are Bearish with a score of 23.6 percent.
Nikkei Stock Average Futures Statistics
SPECULATORS
COMMERCIALS
SMALL TRADERS
– Percent of Open Interest Longs:
15.8
65.9
18.3
– Percent of Open Interest Shorts:
51.2
27.8
20.9
– Net Position:
-5,072
5,452
-380
– Gross Longs:
2,269
9,440
2,621
– Gross Shorts:
7,341
3,988
3,001
– Long to Short Ratio:
0.3 to 1
2.4 to 1
0.9 to 1
NET POSITION TREND:
– Strength Index Score (3 Year Range Pct):
53.4
57.0
23.6
– Strength Index Reading (3 Year Range):
Bullish
Bullish
Bearish
NET POSITION MOVEMENT INDEX:
– 6-Week Change in Strength Index:
-10.0
20.2
-24.2
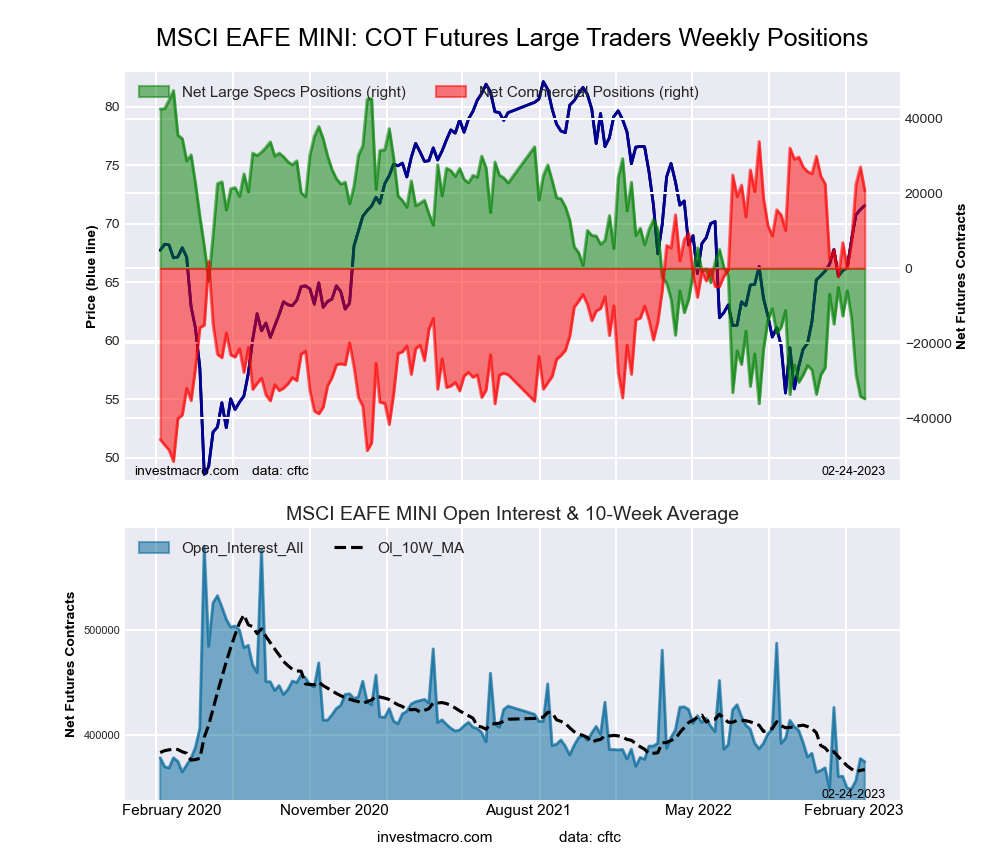
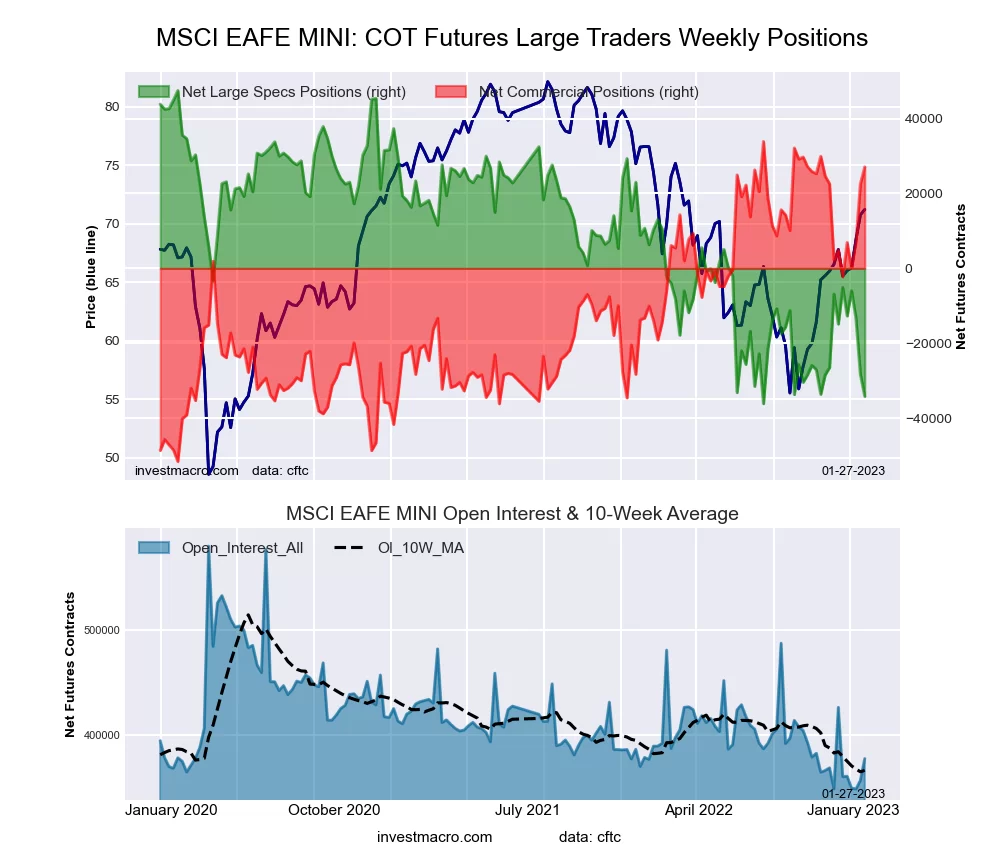
MSCI EAFE Mini Futures:
The MSCI EAFE Mini large speculator standing for the week totaled a net position of -34,840 contracts in the data reported. This was a weekly lowering of -638 contracts from the previous week which had a total of -34,202 net contracts.
This week’s current strength score (the trader positioning range over the past three years, measured from 0 to 100) shows the speculators are currently Bearish-Extreme with a score of 1.6 percent. The commercials are Bullish-Extreme with a score of 84.1 percent and the small traders (not shown in chart) are Bullish-Extreme with a score of 100.0 percent.
MSCI EAFE Mini Futures Statistics
SPECULATORS
COMMERCIALS
SMALL TRADERS
– Percent of Open Interest Longs:
6.5
87.5
5.1
– Percent of Open Interest Shorts:
15.8
82.0
1.3
– Net Position:
-34,840
20,734
14,106
– Gross Longs:
24,465
327,871
18,967
– Gross Shorts:
59,305
307,137
4,861
– Long to Short Ratio:
0.4 to 1
1.1 to 1
3.9 to 1
NET POSITION TREND:
– Strength Index Score (3 Year Range Pct):
1.6
84.1
100.0
– Strength Index Reading (3 Year Range):
Bearish-Extreme
Bullish-Extreme
Bullish-Extreme
NET POSITION MOVEMENT INDEX:
– 6-Week Change in Strength Index:
-36.5
27.9
38.4
Article By InvestMacro – Receive our weekly COT Newsletter
*COT Report: The COT data, released weekly to the public each Friday, is updated through the most recent Tuesday (data is 3 days old) and shows a quick view of how large speculators or non-commercials (for-profit traders) were positioned in the futures markets.
The CFTC categorizes trader positions according to commercial hedgers (traders who use futures contracts for hedging as part of the business), non-commercials (large traders who speculate to realize trading profits) and nonreportable traders (usually small traders/speculators) as well as their open interest (contracts open in the market at time of reporting). See CFTC criteria here.
Companies have been buying back their own stock at record levels – something President Joe Biden doesn’t care for. In his state of the union address, Biden said “corporations ought to do the right thing” and invest more of their profits in producing more goods and less in stock buybacks. To encourage them to do so, he proposed quadrupling the new tax on buybacks to 4%.
But what are stock buybacks, and why do some people consider them to be a bad thing? We tapped D. Brian Blank, who studies company financial decision-making at Mississippi State University, to fill us in.
1. What are stock buybacks?
Before we can answer that question, first we need to understand the basics of how stock works.
Most stockholders, however, obtain stock by buying it on a secondary market, like the New York Stock Exchange. In this case, one person chooses to sell their ownership in the company, while another person buys it.
As partial owners, shareholders see the value of their stock rise when the company does well.
One way investors can benefit from holding the stock is that some corporations pay dividends, which are payments made directly to shareholders. Another way that stockholders can benefit is by selling the stock for more than they paid for it. Together, this creates a return on investment.
When companies have extra capital, they might go into the secondary market and buy back stock from investors. This is often referred to as a stock repurchase or buyback program. Companies that are older and less focused on rapid growth tend to do them more often.
Shareholders like buybacks because companies often pay a premium over market price. And when companies buy their own stock, this removes it from the market, which has the effect of lifting share prices as supply goes down, benefiting existing stockholders.
Critics like Biden contend that share buybacks represent short-term thinking that doesn’t actually create any real value. They argue instead that companies should use more of their profits to invest in more productive activities like business operations, innovation or employees.
But the decision whether to invest to increase domestic production is a complicated one. For example, the reason companies aren’t investing in new wells right now is not simply because they are buying back stock. The reason has more to do with how oil companies, and their shareholders, don’t think it is profitable to invest in more supply for a whole host of reasons, including the global push for greener energy by both policymakers and consumers, which is bound to reduce demand for fossil fuels in the future.
It’s also worth noting that while share repurchases are becoming increasingly common and controversial, they remain very similar to dividends, which don’t prompt the same concerns among politicians.
4. Would increasing the tax result in fewer buybacks?
The 1% tax on buybacks is actually brand new.
Congress passed the tax in 2022 as part of the Inflation Reduction Act. It took effect at the beginning of 2023 and only affects buyback programs of $1 million or more.
Usually when an activity is taxed, it happens less frequently. So, I expect the tax to nudge companies to spend less on buybacks and more elsewhere. While politicians intend more of the money to be used to invest in their productive capacity, companies may simply spend more on paying shareholders dividends.
Since the tax is new, it’s hard to evaluate its actual impact. Companies reportedly accelerated their repurchase programs in 2022 to avoid paying the tax.
But early data from 2023 suggest the 1% tax isn’t significantly deterring buybacks. Companies announced $132 billion in buybacks in January, three times as much as a year earlier and the most for the month on record.
Biden’s proposal to boost the tax to 4% may alter corporate behavior more. But again, it may just lead to greater dividend payments, not the other types of investments he and others hope for.
In addition, given that Republicans control the House, and Democrats have only a narrow majority in the Senate, this proposal has little chance of becoming law anytime soon.
The reasons why large corporations make the decisions they do about where to allocate capital – whether to build a factory, hire more workers or buy back stock – are complicated and, in my view, never taken lightly. These decisions have many facets and implications, and are not necessarily bad. I believe this is something worth remembering the next time you hear politicianssaying “corporations should do the right thing.”
European markets flashed green on Wednesday, tracking gains in Wall Street overnight. A less hawkish than feared Jerome Powell injected global equity bulls with renewed confidence, propelling the S&P500 more than 1%. Stock markets also drew fresh support from positive earnings which boosted market sentiment and sweetened the risk appetite. In the currency space. The dollar slightly dipped thanks to Powell, providing some room for G10 currencies to fight back. Gold continues to linger around $1880 while oil prices stabilized after rising the most in three months.
Today, our focus will be directed toward the global equity and commodity space, especially US indices which remain reactive to rate hike expectations.
S&P 500 waits for catalyst
Despite rallying overnight, the S&P 500 remains in a range on the daily charts with support at 4100 and resistance at 4200. A breakout could be on the horizon with the correct fundamental spark. Should prices breach above 4200, the next key point of interest can be found at 4320. Alternatively, a breakdown below 4100 could signal a selloff towards 3950 – a level just above the 50 and 200-day SMA.
Nasdaq eyes 12800
Just like the S&P 500, the Nasdaq 100 jumped overnight with bulls eying 12800. Overall, the Index remains firmly bullish on the daily charts as there have been consistently higher highs and higher lows while the MACD trades above zero. A solid breakout and daily close above 12800 could inspire and incline towards 13150. Should prices slip back below 12400, the Nasdaq could sink back to the 200-day SMA around 11900.
FTSE 100 hits record highs!
The FTSE100 set fresh record highs this morning after risk appetite was boosted by the rally on Wall Street overnight. Prices are trading above the 50, 100, and 200-day SMA while the MACD trades above zero. The trend remains heavily bullish with the next key level of interest found at 8000. Alternatively, a move below the 7730 support level could signal a selloff towards 7620 and 7490, respectively.
STOX50 breakout…
After breaking above 4200, the STOX50 Index could be poised for further upside with 4380 acting as the next key level of interest. Prices remain bullish on the daily charts with the candlesticks trading firmly above the 50, 100, and 200-day SMA. It may be wise to keep a close eye on the RSI which is pointing to overbought levels. Should this lead to a decliner back below 4200, prices may slip back toward the 4105 support.
Gold
It’s been a shaky week for the precious metal with prices struggling to push back above $1880. Sustained weakness below this level may trigger a selloff towards the 50-day SMA and the next key level at $1825. A solid breakout above $1880 could see gold test $1900.
The tech titans Meta (Facebook), Apple, Alphabet (Google) and Amazon are all reporting their quarterly earnings this week, after a brutal 2022 for the tech sector.
Investors around the world are scrutinising these market-moving big tech earnings reports for not only profit and revenue information, but also guidance as to the companies’ trajectories.
Despite the likely mixed set of reports, the CEO and founder of one of the world’s largest independent financial advisory, asset management and fintech organizations, is predicting that they will “herald the start of The Great Rotation back into growth stocks.”
Nigel Green of deVere Group says: “Facebook’s parent company Meta has exceeded estimates for revenue in its fourth-quarter earnings report, with the stock soaring in extended trading on the results.
“For Apple, a considerable number of factors suggest the company’s first year-on-year revenue may have declined since early 2019.
“Alphabet, the parent company of Google is expected to report a third consecutive quarter of declining earnings.
“While Amazon’s earnings are expected at $0.15 per share, which would be an 89% decrease from the same quarter in 2021.”
But the deVere CEO says tech stocks are becoming more appealing again for investors.
“As market conditions shifted in 2022, investors dumped growth stocks, like tech, in favour of value stocks which were deemed more suitable to the challenging environment,” he observes.
“But what is happening now, we believe, is the beginning of a rebound.
“These big tech reports herald the start of The Great Rotation back to growth stocks for two key reasons.
“First, valuations of tech and other growth stocks are currently low, having been hit by the previous rotation into value stocks. Investors are now eyeing these super attractive entry points to top-up their portfolios as the trend is reversing.
“And second, inflation has seemingly peaked and interest rates are set to stabilize, which takes away a major obstacle for tech stocks.”
As The Great Rotation gets underway, Nigel Green says that investors must act judiciously.
“Investors should avoid the ‘buy everything’ approach, as there will be big winners and losers. They must concentrate on high quality, profitable companies which can consistently maintain or steadily grow margin.”
Ahead of earnings season, the deVere chief executive told the media that investors shouldn’t bet against big tech in the longer term.
He noted the tech heavyweights – which got carried away during the pandemic era amid soaring revenues and profits and which are now being forced to regroup – still have piles of cash and remain enormously profitable.
In addition, these companies maintain considerable user bases, world-class research and development, plus some of the smartest talent on the planet.
Nigel Green concludes: “Tech stocks are back. Rotation into the right growth stocks will provide strong returns.”
About:
deVere Group is one of the world’s largest independent advisors of specialist global financial solutions to international, local mass affluent, and high-net-worth clients. It has a network of more than 70 offices across the world, over 80,000 clients and $12bn under advisement
This is what investors look for at or near a stock market low
By Elliott Wave International
Elliott Wave International’s analysts have been observing financial markets for decades. They monitor dozens of stock market indicators, in addition to Elliott wave patterns.
No single indicator can tell the whole story of what’s going on with the market, but sometimes, a single observation can carry a lot of weight.
One current observation is that many investors are still looking for reasons to be bullish, even though stocks have been in a downtrend for more than a year. In other words, they think the bear market is over.
For example, the view of a prominent market researcher is unequivocal, according to this Jan. 11 headline (Bloomberg):
Bull Market Is Back as Recession Worries Fade, [Market Research Firm Founder] Says
In Elliott Wave International’s view, if recession concerns are dwindling, that’s a reason to be on the lookout for a recession — or, something worse.
But, setting aside whether a recession is pending or not, the point is the latching on to reasons why the bull market is back.
This Jan. 11 headline captures the view of a vice-chairman of a financial firm (CNBC):
The market is telling you that the economy’s not going to be as bad as expected: Financial services firm
Of course, this is close to the same message as the first headline.
Other headlines mention lower inflation as a reason for rising stock prices.
But, let’s get back to Elliott Wave International’s observations over the years. The Jan. 11 U.S. Short Term Update, a thrice weekly Elliott Wave International publication which provides near-term forecasts for major U.S. financial markets, noted:
Investors are still searching for rationalizations to buy, which is a strong sign that [the] bear market has yet to run its course. People do not look for reasons to buy at or near a low, they look for rationalizations to sell.
Consider the last major bear market from 2007 to 2009. On Feb. 23, 2009, the “reason” stated for the continuation of the then bear market was “uncertainty about the latest potential U.S. government action to shore up beleaguered banks.” As a headline said (Reuters):
Dow tumbles to 11-year low on fear about banks
Fears about a big drop in business in the technology sector was also mentioned as a catalyst for plummeting stock prices.
Well, 10 days after that headline published, the stock market bottomed.
Observations about investor rationalizations is just one sign that the bear market may not be over. There are others, including the Elliott wave patterns of the major U.S. stock indexes.
If you’re unfamiliar with Elliott wave analysis, or simply need a refresher, read Frost & Prechter’s Wall Street classic, Elliott Wave Principle: Key to Market Behavior. Here’s a quote from the book:
In markets, progress ultimately takes the form of five waves of a specific structure. Three of these waves, which are labeled 1, 3 and 5, actually effect the directional movement. They are separated by two countertrend interruptions, which are labeled 2 and 4. The two interruptions are apparently a requisite for overall directional movement to occur.
[R.N.] Elliott noted three consistent aspects of the five-wave form. They are: Wave 2 never moves beyond the start of wave 1; wave 3 is never the shortest wave; wave 4 never enters the price territory of wave 1.
If you’d like to learn more (or continue with your refresher if you’re already acquainted with the Wave Principle), here’s some good news: You can access the entire online version of the book for free once you become a member of Club EWI, the world’s largest Elliott wave educational community.
Club EWI is free to join, and members are under no obligations. At the same time, members enjoy complimentary access to a wealth of Elliott wave resources on financial markets and investing.
This article was syndicated by Elliott Wave International and was originally published under the headline Here’s a Strong Indication That the Bear Market Has Legs. EWI is the world’s largest market forecasting firm. Its staff of full-time analysts led by Chartered Market Technician Robert Prechter provides 24-hour-a-day market analysis to institutional and private investors around the world.
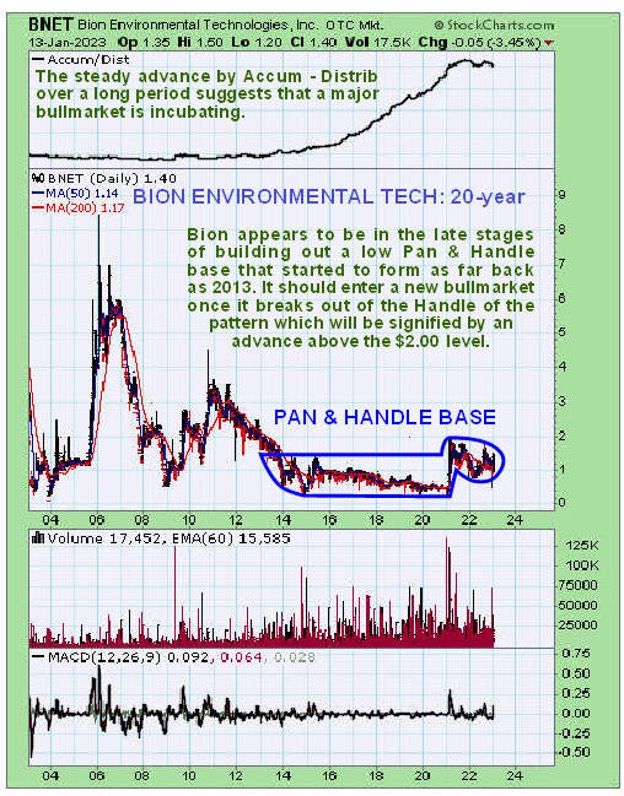
Bion Environmental Technologies Inc. is creating a “mutually beneficial strategic relationship” with another company looking to improve the cattle industry.
Bion’s Gen3Tech technology transforms cattle waste into renewable natural gas, fertilizer, and clean water. BetterFedFoods LLC has developed a technology that uses algae to supplement cattle feed with Omega 3 EPA long-chain fatty acids.
Source: Stockwatch
Newsletter writer Clive Maund of CliveMaund.com said looking at Bion’s 20-year chart, he sees a “steady advance by the accumulation line over a long period.”
This “strongly suggests a positive resolution to the pattern — i.e., a major new bull market with a breakout from the entire base pattern being signified by the price advancing through the US$2.00 level,” he wrote on Jan. 16.
Maund rated the stock an immediate Buy, saying it “is considered to be a solid long-term investment.”
BetterFedFoods has made a “significant equity investment” in Bion, Bion said. The two companies will work over the next two to three months to determine how to leverage their individual strengths in the partnership.
The Catalyst: More Demand for Sustainable Beef
BetterFedFoods’ values fit Bion’s values, said Bion Chief Executive Officer Bill O’Neill.
“BetterFedFoods’ commitment to creating healthier feed, animals, and people is a perfect fit with our own vision,” he said. “Today’s consumers increasingly want products that are sustainable, transparent, and ‘better for you.’ Working with BetterFedFoods will help Bion and its partners check those consumer boxes.”
Over the last decade, BetterFedFoods has been incorporating algae in livestock feeding systems, improving their overall health and providing a higher feed-to-weight gain ratio, creating better marbling of the meat and reducing methane emissions from the animals.
Omega 3 also reduces joint inflammation, increases stress tolerance, improving respiratory issues, and reducing heart disease for animals — just like it does for humans.
“Aligning our goals (with Bion’s) makes perfect sense,” said Todd Hansen, BetterFedFoods’ chief executive officer.
A Sustainable System
The livestock industry creates more than 1.5 billion tons of manure annually, contributing to climate change and the excess nutrient contamination of surface waters and groundwater aquifers.
Bion’s platform transforms that pollution into revenue-producing renewable natural gas, fertilizer, and clean water. It both prevents pollution and recovers lost value simultaneously, and consumers get grain-fed and independently verified sustainable meat with a pedigree they can trace back to the source.
Company officials said meat produced through its system creates a truly sustainable product that also goes a long way toward eliminating the environmental impacts of meat production.
According to the U.S. Environmental Protection Agency, livestock manure nutrients “have real value as a fertilizer” for farmers, gardeners, and landscapers. However, untreated manure from animal feeding operations can contaminate surface water with pathogens such as E. coli, hormones, antibiotics, and chemicals like nitrates, phosphorous, and ammonia, the Centers for Disease Control stated.
Untreated waste can contribute to greenhouse gases such as methane, cause algae blooms and dead zones in bodies of water, contaminate groundwater, and contribute to antibiotic resistance.
“The company is involved in the green technology space, which is a good area to be in with the climate change movement driving a lot of changes and developments,” Maund wrote.
The EPA is now saying it will look at strengthening regulations for large livestock farms. The agency didn’t commit to any changes but acknowledged needing more recent data.
Bion’s Gen3Tech uses a specially designed barn and separately housed treatment system to apply biological, thermal, and mechanical processes to animal waste, creating pipeline-quality natural gas, fertilizers, clean water, and clean air and water credits.
But the main product is blockchain-verified, USDA-certified, sustainable meat for the US$66 billion-a-year beef industry.
In a column last August, Maund said Bion is well-positioned.
“The company is involved in the green technology space, which is a good area to be in with the climate change movement driving a lot of changes and developments,” Maund wrote. “It certainly cannot be claimed that the company has not been preparing for the times that we now find ourselves in and the times ahead.”
About 44% of the company is held by management/insiders; the rest is retail.
The stock is covered by several newsletter writers, including Maund, Matt Badiali, and Chris Temple, editor of The National Investor. Click “See More Live Data” in the data box above to view more of what they are saying.
Bion has a market cap of US$79.14 million and 44,279,884 million shares outstanding, 21,841,554 million of them free-floating. It trades in a 52-week range of US$1.75 and US$0.505.
1) Steve Sobek wrote this article for Streetwise Reports LLC. He or members of his household own securities of the following companies mentioned in the article: None. He or members of his household are paid by the following companies mentioned in this article: None.
2) The following companies mentioned in this article are billboard sponsors of Streetwise Reports: None. Click here for important disclosures about sponsor fees. As of the date of this article, an affiliate of Streetwise Reports has a consulting relationship with Bion Environmental Technologies Inc. Please click here for more information. The information provided above is for informational purposes only and is not a recommendation to buy or sell any security.
3) The article does not constitute investment advice. Each reader is encouraged to consult with his or her individual financial professional and any action a reader takes as a result of information presented here is his or her own responsibility. By opening this page, each reader accepts and agrees to Streetwise Reports’ terms of use and full legal disclaimer. This article is not a solicitation for investment. Streetwise Reports does not render general or specific investment advice and the information on Streetwise Reports should not be considered a recommendation to buy or sell any security. Streetwise Reports does not endorse or recommend the business, products, services or securities of any company mentioned on Streetwise Reports.
4) From time to time, Streetwise Reports LLC and its directors, officers, employees or members of their families, as well as persons interviewed for articles and interviews on the site, may have a long or short position in securities mentioned. Directors, officers, employees or members of their immediate families are prohibited from making purchases and/or sales of those securities in the open market or otherwise from the time of the decision to publish an article until three business days after the publication of the article. The foregoing prohibition does not apply to articles that in substance only restate previously published company releases. As of the date of this article, officers and/or employees of Streetwise Reports LLC (including members of their household) own securities of Bion Environmental Technologies Inc., a company mentioned in this article.
Streetwise Reports sat down with Øyvind Schanke, the chief investment officer of TD Veen and the former investment officer of one of the world’s largest sovereign wealth funds as he shares his current focus.
While some investment companies focus solely on the bottom line, some have a much brighter goal in mind. And while money is still important to TD Veen, it is not the mission. Instead, TD Veen is a family-centered investment company with one goal in mind: to invest only in that which benefits society. We at Streetwise Reports were intrigued by TD Veen’s premise, so we sat down with its chief investment officer Øyvind Schanke to learn more about TD Veen and the companies it invests in.
Øyvind Schanke joined the company in 2020 after years of investment experience. Before working with TD, Veen Schanke spent almost 16 years at the Norwegian Sovereign Wealth fund, one of the world’s largest sovereign wealth funds, the last years as the CIO for asset management based in London.
Main Investment Positions
The public companies TD Veen invests in are listed below.
You can download a full list of their investment positions. However, no matter the investment, TD Veen was founded under the premise that people needed to invest in social entrepreneurship, so the company keeps a boutique list of companies under its list, with a special focus on the health and life science sectors, especially mental health.
Why TD Invests in Mental Health
While Schanke spoke positively about emergency care within Norway’s public health system, he pointed out an incredible need to increase the quality of preventative care in his country.
He said, “there is no cure, just a bandaid,” especially regarding addiction and other mental health disorders.
In fact, according to The Borgen Project, “about half of all people in Norway experience a mental health disorder at some point in their life.”
Not only are Norwegians experiencing higher rates of mental illness due to Covid-19, but the lack of light during the winter months can make things a lot worse by adding seasonal affective disorder on top of general issues.
Linda Geddes from The Atlantic gave an overview of this issue and spoke with those in Northern European countries to get their personal take on how the lack of light in winter months affects them here.
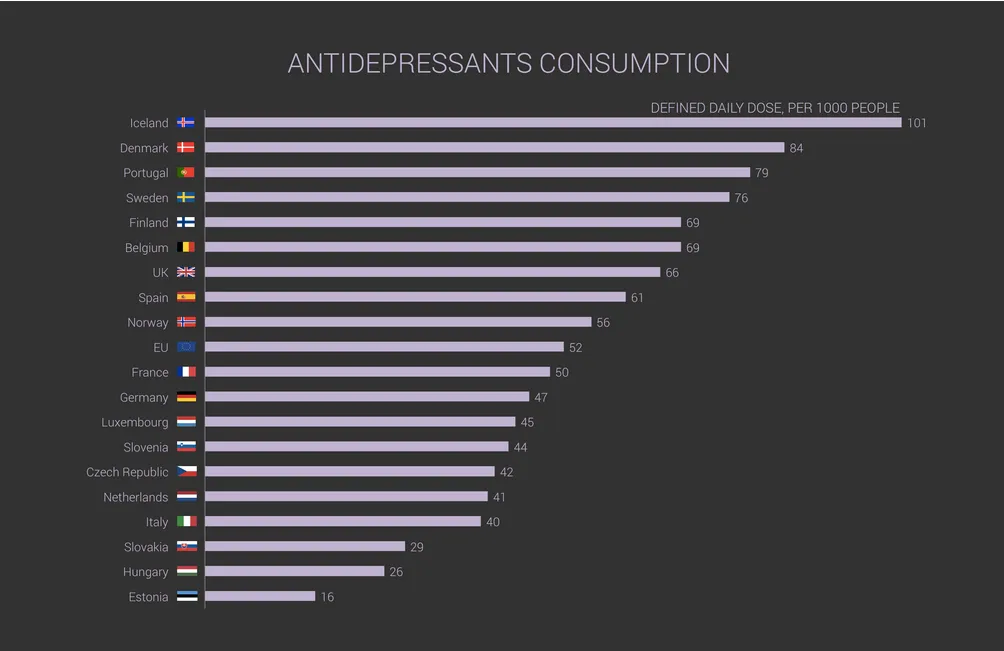
The main treatment for depression is currently therapy and antidepressants, which Norwegians take a lot of. However, while antidepressants can calm the symptoms of depression, they don’t go to the root of the problem. This is why the team at TD Veen saw an overarching need for more comprehensive mental health care within Norway and the world, so they put their money where their heart is and began investing in it — literally.
TD Veen first built a relationship with Atai Life Sciences NV (ATAI:NASDAQ), a mental-health-focused bio-pharmaceutical company headquartered in Berlin, Germany. This began in 2018, as Øyvind Schanke had a call with the company and decided he needed to learn more about the medicinal use of psychedelics in treating mental health disorders. He then met with the company in Oslo, where he was introduced to
Awakn Life Sciences Corp. (AWKN:NEO; AWKNF:OTCQB),a biopharma company using controversial drugs to treat alcohol use disorder and other addictions. Currently, Awakn is using ketamin in their clinics, with five clinics in total, two of which are in Norway. They are also in the middle of trials for MDMA.
Psychedelics a Burgeoning Market
While the use of psychedelics is a controversial practice, it is gaining more and more traction. Research and Markets predicted that the global psychedelic drugs market would reach US$10.75 billion by 2027. And this is not for recreational use but rather for its ability to aid in treating mental illness. A study from the Centre for Psychedelic Research at Imperial College London found that psilocybin, the active compound in magic mushrooms, could be just as effective as anti-depressants in a clinical setting.
In 2022, Netflix released a docu-series on the waves psychedelics have been making in the bio-pharma world titled “How to Change Your Mind.”
The third episode of the series focuses heavily on the history of MDMA, its effects, and how it could be used to treat both PTSD and addiction as the drug turns off the fear center of the brain, allowing for a patient and therapist to dig into deepest wounds without pain or fear.
“The unmet medical need and opportunity for innovative approaches to treatment is very high,” Maxim Equity Research’s Jason McCarthy wrote.
Overall, studies have shown the positive effects of MDMA on these patients, and this is one of the reasons TD Veen is now a proud investor in Awakn. Øyvind Schanke told Streetwise Reports, “We believe in combining the [MDMD] compound with therapy at Awakn, and that is our belief that it needs to happen . . . I know this is needed.”
It seems many analysts agree with him. In July, H.C. Wainright & Co. Senior Healthcare Analyst Patrick Trucchio noted that “Awakn is advancing MDMA-assisted therapy for AUD in Europe, which we estimate could have blockbuster drug potential based on the significant unmet medical need and evidence generated to-date pointing to the potential of MDMA-assisted therapy in a variety of mood disorders.”
Then in November, Maxim Equity Research’s Jason McCarthy wrote, “Considering that private addiction treatment comes with a 70%-80% fail rate and treatment can cost north of US$30K, the opportunity for Awakn to improve this model is significant.” He went on to say, “The unmet medical need and opportunity for innovative approaches to treatment is very high.”
Awakn currently has five main clinics in Norway, and both the company and TD Veen hope this will continue to expand.
What’s Next?
Going forward, TD Veen will continue to invest in companies that, in their eyes, improve the world. They aim to generate enough funds so that exits aren’t needed because the fewer exists, the better. In 2022, TD Veen only had four exits and invested in six new companies. As Schanke said, “We want to be the world’s best minority shareholder.”
TD Veen was founded by Tor Dagfinn Veen in 1986. According to the company, “Today, Tor Dagfinn and Tone Veen own 28% of the shares, while daughters Camilla and Silje Veen own 36% each.
TD Veen has US$250 million under management, and they do not currently take money globally but focus on their family-centered business model. They are headquartered in Stavanger, Norway, and no matter what they invest in, they will do so under their mantra: An investment is only good if it also benefits society.
Disclosures: 1) Katherine DeGilio wrote this article for Streetwise Reports LLC. She or members of her household own securities of the following companies mentioned in the article: None. She or members of her household are paid by the following companies mentioned in this article: None.
2) The following companies mentioned in this article are billboard sponsors of Streetwise Reports: Awakn Life Sciences Corp. Click here for important disclosures about sponsor fees. As of the date of this article, an affiliate of Streetwise Reports has a consulting relationship with: Awakn Life Sciences Corp.Please click here for more information.
3) Statements and opinions expressed are the opinions of the author and not of Streetwise Reports or its officers. The author is wholly responsible for the validity of the statements. The author was not paid by Streetwise Reports for this article. Streetwise Reports was not paid by the author to publish or syndicate this article. Streetwise Reports requires contributing authors to disclose any shareholdings in, or economic relationships with, companies that they write about. Streetwise Reports relies upon the authors to accurately provide this information and Streetwise Reports has no means of verifying its accuracy.
4) This article does not constitute investment advice. Each reader is encouraged to consult with his or her individual financial professional and any action a reader takes as a result of information presented here is his or her own responsibility. By opening this page, each reader accepts and agrees to Streetwise Reports’ terms of use and full legal disclaimer. This article is not a solicitation for investment. Streetwise Reports does not render general or specific investment advice and the information on Streetwise Reports should not be considered a recommendation to buy or sell any security. Streetwise Reports does not endorse or recommend the business, products, services or securities of any company mentioned on Streetwise Reports.
5) From time to time, Streetwise Reports LLC and its directors, officers, employees or members of their families, as well as persons interviewed for articles and interviews on the site, may have a long or short position in securities mentioned. Directors, officers, employees or members of their immediate families are prohibited from making purchases and/or sales of those securities in the open market or otherwise from the time of the decision to publish an article until three business days after the publication of the article. The foregoing prohibition does not apply to articles that in substance only restate previously published company releases. As of the date of this article, officers and/or employees of Streetwise Reports LLC (including members of their household) own securities of Awakn Life Sciences Corp., a company mentioned in this article.
Here are the latest charts and statistics for the Commitment of Traders (COT) data published by the Commodities Futures Trading Commission (CFTC).
The latest COT data is updated through Tuesday January 24th and shows a quick view of how large traders (for-profit speculators and commercial entities) were positioned in the futures markets.
Weekly Speculator Changes led by S&P500-Mini
The COT stock markets speculator bets were lower this week as just two out of the seven stock markets we cover had higher positioning while the other five markets had lower speculator contracts.
Leading the gains for the stock markets was the S&P500-Mini (17,827 contracts) with the DowJones-Mini (647 contracts) also showing a positive week.
The markets with the declines in speculator bets this week were MSCI EAFE-Mini (-5,924 contracts) with the Nasdaq-Mini (-4,628 contracts), Russell-Mini (-4,486 contracts), Nikkei 225 (-887 contracts) and the VIX (-794 contracts) also registering lower bets on the week.
COT Strength Scores (a normalized measure of Speculator positions over a 3-Year range, from 0 to 100 where above 80 is Extreme-Bullish and below 20 is Extreme-Bearish) showed that the VIX (76 percent) and the Nasdaq-Mini (61 percent) lead the stock markets this week. The Nikkei 225 (55 percent) and Nikkei 225 Yen (54 percent) come in as the next highest in the weekly strength scores.
On the downside, the MSCI EAFE-Mini (2 percent) comes in at the lowest strength level currently and is in Extreme-Bearish territory (below 20 percent). The next lowest strength score is the S&P500-Mini (17 percent).
Strength Statistics: VIX (76.0 percent) vs VIX previous week (76.5 percent) S&P500-Mini (17.5 percent) vs S&P500-Mini previous week (14.2 percent) DowJones-Mini (28.3 percent) vs DowJones-Mini previous week (27.3 percent) Nasdaq-Mini (60.9 percent) vs Nasdaq-Mini previous week (63.5 percent) Russell2000-Mini (30.3 percent) vs Russell2000-Mini previous week (32.9 percent) Nikkei USD (55.1 percent) vs Nikkei USD previous week (59.3 percent) EAFE-Mini (2.4 percent) vs EAFE-Mini previous week (9.7 percent)
VIX & S&P500-Mini top the 6-Week Strength Trends
COT Strength Score Trends (or move index, calculates the 6-week changes in strength scores) showed that the VIX (21 percent) leads the past six weeks trends for the stock markets. The S&P500-Mini (4 percent) and the DowJones-Mini (4 percent) are the next highest positive movers in the latest trends data.
The Nasdaq-Mini (-25 percent) leads the downside trend scores currently with the MSCI EAFE-Mini (-24 percent) coming in as the next market with lower trend scores.
Strength Trend Statistics: VIX (20.6 percent) vs VIX previous week (15.3 percent) S&P500-Mini (3.9 percent) vs S&P500-Mini previous week (-4.3 percent) DowJones-Mini (3.9 percent) vs DowJones-Mini previous week (1.5 percent) Nasdaq-Mini (-24.8 percent) vs Nasdaq-Mini previous week (-19.1 percent) Russell2000-Mini (-2.1 percent) vs Russell2000-Mini previous week (6.1 percent) Nikkei USD (-10.0 percent) vs Nikkei USD previous week (-6.1 percent) EAFE-Mini (-23.7 percent) vs EAFE-Mini previous week (-26.2 percent)
Individual Stock Market Charts:
VIX Volatility Futures:
The VIX Volatility large speculator standing this week resulted in a net position of -53,149 contracts in the data reported through Tuesday. This was a weekly decrease of -794 contracts from the previous week which had a total of -52,355 net contracts.
This week’s current strength score (the trader positioning range over the past three years, measured from 0 to 100) shows the speculators are currently Bullish with a score of 76.0 percent. The commercials are Bearish with a score of 23.9 percent and the small traders (not shown in chart) are Bullish with a score of 66.5 percent.
VIX Volatility Futures Statistics
SPECULATORS
COMMERCIALS
SMALL TRADERS
– Percent of Open Interest Longs:
17.9
56.0
6.7
– Percent of Open Interest Shorts:
35.8
36.3
8.4
– Net Position:
-53,149
58,259
-5,110
– Gross Longs:
52,816
165,673
19,828
– Gross Shorts:
105,965
107,414
24,938
– Long to Short Ratio:
0.5 to 1
1.5 to 1
0.8 to 1
NET POSITION TREND:
– Strength Index Score (3 Year Range Pct):
76.0
23.9
66.5
– Strength Index Reading (3 Year Range):
Bullish
Bearish
Bullish
NET POSITION MOVEMENT INDEX:
– 6-Week Change in Strength Index:
20.6
-18.2
-12.7
S&P500 Mini Futures:
The S&P500 Mini large speculator standing this week resulted in a net position of -208,991 contracts in the data reported through Tuesday. This was a weekly rise of 17,827 contracts from the previous week which had a total of -226,818 net contracts.
This week’s current strength score (the trader positioning range over the past three years, measured from 0 to 100) shows the speculators are currently Bearish-Extreme with a score of 17.5 percent. The commercials are Bullish with a score of 77.3 percent and the small traders (not shown in chart) are Bearish with a score of 27.7 percent.
S&P500 Mini Futures Statistics
SPECULATORS
COMMERCIALS
SMALL TRADERS
– Percent of Open Interest Longs:
12.4
73.4
12.1
– Percent of Open Interest Shorts:
22.7
63.4
11.8
– Net Position:
-208,991
202,765
6,226
– Gross Longs:
250,474
1,485,629
244,122
– Gross Shorts:
459,465
1,282,864
237,896
– Long to Short Ratio:
0.5 to 1
1.2 to 1
1.0 to 1
NET POSITION TREND:
– Strength Index Score (3 Year Range Pct):
17.5
77.3
27.7
– Strength Index Reading (3 Year Range):
Bearish-Extreme
Bullish
Bearish
NET POSITION MOVEMENT INDEX:
– 6-Week Change in Strength Index:
3.9
-1.3
-2.3
Dow Jones Mini Futures:
The Dow Jones Mini large speculator standing this week resulted in a net position of -9,966 contracts in the data reported through Tuesday. This was a weekly boost of 647 contracts from the previous week which had a total of -10,613 net contracts.
This week’s current strength score (the trader positioning range over the past three years, measured from 0 to 100) shows the speculators are currently Bearish with a score of 28.3 percent. The commercials are Bullish with a score of 73.5 percent and the small traders (not shown in chart) are Bearish with a score of 29.2 percent.
Dow Jones Mini Futures Statistics
SPECULATORS
COMMERCIALS
SMALL TRADERS
– Percent of Open Interest Longs:
27.2
50.9
17.9
– Percent of Open Interest Shorts:
40.0
35.1
20.8
– Net Position:
-9,966
12,227
-2,261
– Gross Longs:
21,106
39,500
13,893
– Gross Shorts:
31,072
27,273
16,154
– Long to Short Ratio:
0.7 to 1
1.4 to 1
0.9 to 1
NET POSITION TREND:
– Strength Index Score (3 Year Range Pct):
28.3
73.5
29.2
– Strength Index Reading (3 Year Range):
Bearish
Bullish
Bearish
NET POSITION MOVEMENT INDEX:
– 6-Week Change in Strength Index:
3.9
-11.6
28.0
Nasdaq Mini Futures:
The Nasdaq Mini large speculator standing this week resulted in a net position of -25,261 contracts in the data reported through Tuesday. This was a weekly fall of -4,628 contracts from the previous week which had a total of -20,633 net contracts.
This week’s current strength score (the trader positioning range over the past three years, measured from 0 to 100) shows the speculators are currently Bullish with a score of 60.9 percent. The commercials are Bearish with a score of 49.3 percent and the small traders (not shown in chart) are Bearish with a score of 29.7 percent.
Nasdaq Mini Futures Statistics
SPECULATORS
COMMERCIALS
SMALL TRADERS
– Percent of Open Interest Longs:
22.0
63.4
12.0
– Percent of Open Interest Shorts:
31.2
49.8
16.3
– Net Position:
-25,261
37,079
-11,818
– Gross Longs:
60,241
173,611
32,846
– Gross Shorts:
85,502
136,532
44,664
– Long to Short Ratio:
0.7 to 1
1.3 to 1
0.7 to 1
NET POSITION TREND:
– Strength Index Score (3 Year Range Pct):
60.9
49.3
29.7
– Strength Index Reading (3 Year Range):
Bullish
Bearish
Bearish
NET POSITION MOVEMENT INDEX:
– 6-Week Change in Strength Index:
-24.8
30.7
-10.3
Russell 2000 Mini Futures:
The Russell 2000 Mini large speculator standing this week resulted in a net position of -67,401 contracts in the data reported through Tuesday. This was a weekly reduction of -4,486 contracts from the previous week which had a total of -62,915 net contracts.
This week’s current strength score (the trader positioning range over the past three years, measured from 0 to 100) shows the speculators are currently Bearish with a score of 30.3 percent. The commercials are Bullish with a score of 65.8 percent and the small traders (not shown in chart) are Bearish with a score of 45.5 percent.
Russell 2000 Mini Futures Statistics
SPECULATORS
COMMERCIALS
SMALL TRADERS
– Percent of Open Interest Longs:
8.9
83.7
6.2
– Percent of Open Interest Shorts:
24.8
69.2
4.7
– Net Position:
-67,401
61,283
6,118
– Gross Longs:
37,737
354,541
26,065
– Gross Shorts:
105,138
293,258
19,947
– Long to Short Ratio:
0.4 to 1
1.2 to 1
1.3 to 1
NET POSITION TREND:
– Strength Index Score (3 Year Range Pct):
30.3
65.8
45.5
– Strength Index Reading (3 Year Range):
Bearish
Bullish
Bearish
NET POSITION MOVEMENT INDEX:
– 6-Week Change in Strength Index:
-2.1
2.0
-0.1
Nikkei Stock Average (USD) Futures:
The Nikkei Stock Average (USD) large speculator standing this week resulted in a net position of -4,712 contracts in the data reported through Tuesday. This was a weekly decline of -887 contracts from the previous week which had a total of -3,825 net contracts.
This week’s current strength score (the trader positioning range over the past three years, measured from 0 to 100) shows the speculators are currently Bullish with a score of 55.1 percent. The commercials are Bullish with a score of 57.4 percent and the small traders (not shown in chart) are Bearish-Extreme with a score of 17.9 percent.
Nikkei Stock Average Futures Statistics
SPECULATORS
COMMERCIALS
SMALL TRADERS
– Percent of Open Interest Longs:
19.2
63.8
16.9
– Percent of Open Interest Shorts:
51.6
25.7
22.7
– Net Position:
-4,712
5,546
-834
– Gross Longs:
2,786
9,279
2,461
– Gross Shorts:
7,498
3,733
3,295
– Long to Short Ratio:
0.4 to 1
2.5 to 1
0.7 to 1
NET POSITION TREND:
– Strength Index Score (3 Year Range Pct):
55.1
57.4
17.9
– Strength Index Reading (3 Year Range):
Bullish
Bullish
Bearish-Extreme
NET POSITION MOVEMENT INDEX:
– 6-Week Change in Strength Index:
-10.0
21.0
-26.1
MSCI EAFE Mini Futures:
The MSCI EAFE Mini large speculator standing this week resulted in a net position of -34,202 contracts in the data reported through Tuesday. This was a weekly lowering of -5,924 contracts from the previous week which had a total of -28,278 net contracts.
This week’s current strength score (the trader positioning range over the past three years, measured from 0 to 100) shows the speculators are currently Bearish-Extreme with a score of 2.4 percent. The commercials are Bullish-Extreme with a score of 91.8 percent and the small traders (not shown in chart) are Bullish with a score of 78.9 percent.
MSCI EAFE Mini Futures Statistics
SPECULATORS
COMMERCIALS
SMALL TRADERS
– Percent of Open Interest Longs:
6.5
89.8
3.0
– Percent of Open Interest Shorts:
15.5
82.7
1.2
– Net Position:
-34,202
27,075
7,127
– Gross Longs:
24,429
339,047
11,492
– Gross Shorts:
58,631
311,972
4,365
– Long to Short Ratio:
0.4 to 1
1.1 to 1
2.6 to 1
NET POSITION TREND:
– Strength Index Score (3 Year Range Pct):
2.4
91.8
78.9
– Strength Index Reading (3 Year Range):
Bearish-Extreme
Bullish-Extreme
Bullish
NET POSITION MOVEMENT INDEX:
– 6-Week Change in Strength Index:
-23.7
26.8
-21.1
Article By InvestMacro – Receive our weekly COT Newsletter
*COT Report: The COT data, released weekly to the public each Friday, is updated through the most recent Tuesday (data is 3 days old) and shows a quick view of how large speculators or non-commercials (for-profit traders) were positioned in the futures markets.
The CFTC categorizes trader positions according to commercial hedgers (traders who use futures contracts for hedging as part of the business), non-commercials (large traders who speculate to realize trading profits) and nonreportable traders (usually small traders/speculators) as well as their open interest (contracts open in the market at time of reporting). See CFTC criteria here.
A rallying call for investors has been sounded by the CEO and founder of one of the world’s largest independent financial advisory, asset management and fintech organizations.
It comes from Nigel Green of deVere Group as global markets have got off to a confident start to the year.
The MSCI gauge – the global stock market index – has rallied 9% so far this year after slumping nearly 20% in 2022.
He notes: “The re-opening of China, weaker gas prices, and growing signs of a ‘soft landing’ for the U.S. economy as it appears that the Federal Reserve is reducing inflation without creating significant unemployment, are amongst the factors which have improved the outlook for global markets.
“This is causing a bullish sentiment as investors believe that many of 2022’s headwinds are now in the rear-view mirror.”
He continues: “The worry over corporate earnings in the first half of 2023 is a near-term concern, but one that investors appear reasonably happy to look beyond.
“Investors are looking ahead to the second half of the year, and to a global economic recovery underlined by an end to interest rate hikes from the major central banks by mid-summer, and possibly rate cuts at the end of the year as inflation falls sharply on a year-on-year basis.”
Market volatility in recent times has lowered valuations of some high-quality equities. This, says Nigel Green, will now be being used by savvy investors “to create better long-term investment opportunities and generate higher income for investors. They will be currently viewing this backdrop as a buying opportunity to top-up their portfolios.
“Inflation will still be an issue for a while to come, but less so as we move through the year.
“But it is likely that investors will be seeking to increase exposure to growth stocks, especially the currently undervalued ones, as cost of living eases and global growth picks up momentum.”
The deVere CEO concludes: “With a better year already underway way and the market currently low, investors should be positioning portfolios to take advantage of a brighter outlook. Many will be moving fast, so as not to miss the opportunities.”
About:
deVere Group is one of the world’s largest independent advisors of specialist global financial solutions to international, local mass affluent, and high-net-worth clients. It has a network of more than 70 offices across the world, over 80,000 clients and $12bn under advisement.


