
Source: Streetwise Reports (3/30/23)
Onboarding will begin in April for the health care system that has more than 1,200 care centers in seven states.
Telemedicine company Reliq Health Technologies Inc. (RHT:TSX.V; RQHTF:OTCQB; A2AJTB:WKN) announced it has signed a contract with its largest client yet, a healthcare system with more than 1,200 care centers in seven states.
Onboarding will begin in April at 20 of their skilled nursing facilities, which are expected to add more than 2,000 new patients per month to Reliq’s iUGO platform by the end of the year at an average revenue of US$65 per patient per month.
Skilled nursing facilities are “a very big space for us,” Chief Executive Lisa Crossley said.
Over the last six months, the company has signed three large networks of such facilities, including the newest client.
“That market segment has become incredibly important to us over a very short period of time,” Crossley said. “I think it really speaks to the value proposition we offer to that market segment that we’ve gotten such strong traction in such a short period of time.”
The U.S. skilled nursing facility and rehabilitation market is expected to grow at a compound annual growth rate of 4.5% to US$308.8 billion by 2023, according to a report by Markets and Research.
The U.S. skilled nursing facility and rehabilitation market is expected to grow at a compound annual growth rate of 4.5% to US$308.8 billion by 2023, according to a report by Markets and Research.
“The growing incidences of chronic conditions such as diabetes, paralysis, hypertension, etc., and the rising geriatric population is expected to fuel the market over the next few years,” the report said. “Medicare and Medicaid availability and the growing technologies will play a driving role for the market in the coming years.”
The global telehealth market Reliq serves is anticipated to reach US$380 billion by 2023, according to another Research and Markets report.
The pandemic “led to increased awareness about telemedicine solutions, propelled the adoption rates among patients and providers, and increased the investment activities in the market,” the report said.
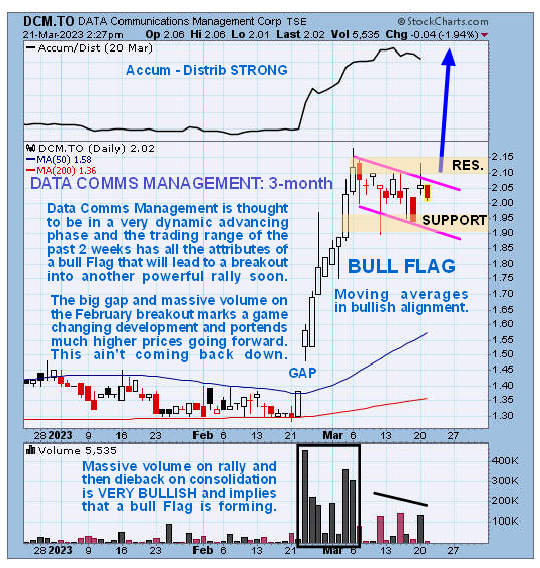
Technical analyst Clive Maund of CliveMaund.com recommended the stock shortly after news broke last year that the company’s cash intake went up 485% from the fiscal year 2021 to the fiscal year 2022.
“We, therefore, stay long,” Maund wrote for Streetwise Reports.
The Catalyst: ‘A Very Large Opportunity’
The new client network, which was not identified, has more than 10 million patient encounters per year in New York, Ohio, Maryland, Virginia, Florida, Kentucky, and South Carolina, Reliq said.
Newly discharged patients will get long-term virtual care at home using Reliq’s Transitional Care Management, Remote Patient Monitoring, and Chronic Care Management, and Behavioral Health Integration modules on its platform.
Those patients will bring in an average revenue of US$60 per patient for their first 30 days after discharge and US$65 per patient per month after that.
Technical analyst Clive Maund of CliveMaund.com recommended the stock shortly after news broke last year that the company’s cash intake went up 485% from the fiscal year 2021 to the fiscal year 2022. “We, therefore, stay long,” Maund wrote for Streetwise Reports.
The new client manages a wide variety of care settings, such as primary care clinics, hospice agencies, home health agencies, and hospitals.
“It’s a very large opportunity for us,” Crossley said. “This client is really representative of that very comprehensive, holistic offering that our product and platform represents, and (have) very broad appeal in the market.”
The company also recently announced it had signed 40 new skilled nursing facility clients in California, Florida, and Pennsylvania, adding more than 4,000 new patients per month to iUGO.
This week, it announced it had signed ten new contracts with eight physician practices in Nevada and California and two home health agencies in Texas.
Crossley has said the company services more than 100,000 on iUGO and expects to have as many as 200,000 patients on the platform by the middle of 2023.
Managing Patients at Home
Diseases the company aims to manage at home with iUGO include chronic obstructive pulmonary disease (COPD), congestive heart failure, diabetes, hypertension, and others. Patients get audible reminders to step on a scale, take their blood pressure, or prick their fingers for glucose monitoring. The information is automatically uploaded to the cloud.
iUGO draws on data from fall detection devices, medication tracking, and vitals data to flag patients at home or in facilities who need additional monitoring. It even uses artificial intelligence algorithms in its software.
Reliq is on the cutting edge there, as AI has yet to be widely deployed in health care. But a recent report from McKinsey & Co. and Harvard researchers said that AI adoption could result in savings of 5% to 10% of health care spending, or US$200 billion to US$360 billion annually.
Streetwise Ownership Overview*
Reliq Health Technologies Inc. (RHT:TSX.V; RQHTF:OTCQB; A2AJTB:WKN)
| Retail: 91.7% | |
| Management & Insiders: 8% | |
| Institutions: 0.3% | |
| Strategic Investors: 0% |
“For hospitals, the savings come largely from use cases that improve clinical operations . . . and quality and safety,” the report’s authors wrote. “For physician groups, the savings also mostly come from use cases that improve clinical operations.”
Ownership and Share Structure
About 8% of Reliq’s shares are owned by insiders, including Crossley, with 1.61% or 3.22 million shares. About 0.3% of the company is owned by institutional investors, including FNB Wealth Management, with 0.02% or 0.03 million shares, according to Reuters.
Other top investors include Eugene Beukman, who owns 0.11% or 0.23 million shares, and Brian Storseth, who owns 0.07% or 0.14 million shares, Reuters said.
Crossley said 91.7% of the company is retail.
The company has 200.6 million shares outstanding, with about 197 million free-floating. It has a market cap of CA$97.4 million and trades in a 52-week range of CA$0.92 and CA$0.36.
Disclosures:
1) Steve Sobek wrote this article for Streetwise Reports LLC and provides services to Streetwise Reports. He or members of his household own securities of the following companies mentioned in the article: None. He or members of his household are paid by the following companies mentioned in this article: None.
2) The following companies mentioned in this article are billboard sponsors of Streetwise Reports: Reliq Health Technologies Inc. Click here for important disclosures about sponsor fees.
3) The article does not constitute investment advice. Each reader is encouraged to consult with his or her individual financial professional and any action a reader takes as a result of information presented here is his or her own responsibility. By opening this page, each reader accepts and agrees to Streetwise Reports’ terms of use and full legal disclaimer. This article is not a solicitation for investment. Streetwise Reports does not render general or specific investment advice and the information on Streetwise Reports should not be considered a recommendation to buy or sell any security. Streetwise Reports does not endorse or recommend the business, products, services or securities of any company mentioned on Streetwise Reports.
4) From time to time, Streetwise Reports LLC and its directors, officers, employees or members of their families, as well as persons interviewed for articles and interviews on the site, may have a long or short position in securities mentioned. Directors, officers, employees or members of their immediate families are prohibited from making purchases and/or sales of those securities in the open market or otherwise from the time of the decision to publish an article until three business days after the publication of the article. The foregoing prohibition does not apply to articles that in substance only restate previously published company releases.
5) This article does not constitute medical advice. Officers, employees and contributors to Streetwise Reports are not licensed medical professionals. Readers should always contact their healthcare professionals for medical advice.


