
By InvestMacro

Here are the latest charts and statistics for the Commitment of Traders (COT) data published by the Commodities Futures Trading Commission (CFTC).
The latest COT data is updated through Tuesday March 21st and shows a quick view of how large traders (for-profit speculators and commercial entities) were positioned in the futures markets.
* This COT data is fully up-to-date after weeks of delays due to a cybersecurity event that happened in early February to ION Cleared Derivatives (a subsidiary of ION Markets). The hacking incident had disrupted the ability for the CFTC to report large trader positions.
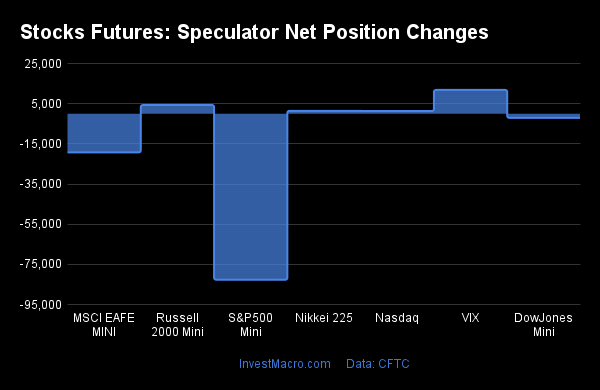
Weekly Speculator Changes led by Russell-Mini & VIX
Free Reports:
 Sign Up for Our Stock Market Newsletter – Get updated on News, Charts & Rankings of Public Companies when you join our Stocks Newsletter
 Get our Weekly Commitment of Traders Reports - See where the biggest traders (Hedge Funds and Commercial Hedgers) are positioned in the futures markets on a weekly basis.
The COT stock markets speculator bets were higher this week as four out of the seven stock markets we cover had higher positioning while the other four markets had lower speculator contracts.
Leading the gains for the stock markets was the VIX (11,856 contracts) with the Russell-Mini (4,315 contracts), the Nikkei 225 (1,438 contracts) and the Nasdaq-Mini (1,352 contracts) also showing positive weeks.
The markets with the declines in speculator bets this week were the S&P500-Mini (-82,661 contracts) with the MSCI EAFE-Mini (-19,234 contracts) and the DowJones-Mini (-2,068 contracts) also registering lower bets on the week.
Highlighting the COT stocks data this week is the bearish bets in the S&P500-Mini speculative positions. The large speculator position in S&P500-Mini futures dropped this week by over -80,000 contracts and fell for the second time in three weeks. The S&P500-Mini bets have now been in a bearish net position for the past 40 straight weeks, dating back to June 14th of 2022.
The current overall speculator level is currently at a highly bearish net position level of -202,480 speculator contracts with a bearish-extreme strength score level (18.7 percent) and while the 6-week strength trend actually posted a small gain of 2.8 percent (see strength scores further below).
The S&P500 stock futures price has been very resilient over the past month with a combination of rate hikes and a banking crisis not being able to knock the price from its short-term uptrend that started in October. The S&P500 stock futures price closed the week right around the psychological level of 4000.00 after making small gains in the past two weeks.
| Mar-21-2023 | OI | OI-Index | Spec-Net | Spec-Index | Com-Net | COM-Index | Smalls-Net | Smalls-Index |
|---|---|---|---|---|---|---|---|---|
| S&P500-Mini | 2,149,005 | 12 | -202,480 | 19 | 266,455 | 84 | -63,975 | 13 |
| Nikkei 225 | 10,419 | 0 | -930 | 73 | 795 | 34 | 135 | 30 |
| Nasdaq-Mini | 214,876 | 22 | -5,120 | 72 | 16,858 | 37 | -11,738 | 31 |
| DowJones-Mini | 81,747 | 41 | -22,148 | 17 | 30,063 | 99 | -7,915 | 0 |
| VIX | 330,622 | 57 | -49,649 | 78 | 52,093 | 20 | -2,444 | 79 |
| Nikkei 225 Yen | 34,599 | 9 | 3,577 | 45 | 8,390 | 34 | -11,967 | 63 |
Strength Scores led by VIX & Nikkei 225

COT Strength Scores (a normalized measure of Speculator positions over a 3-Year range, from 0 to 100 where above 80 is Extreme-Bullish and below 20 is Extreme-Bearish) showed that the VIX (78 percent) and the Nikkei 225 (73 percent) lead the stock markets this week. The Nasdaq-Mini (72 percent) comes in as the next highest in the weekly strength scores.
On the downside, the DowJones-Mini (17 percent) and the S&P500-Mini (19 percent) are the lowest strength levels currently and are in Extreme-Bearish territory (below 20 percent).
Strength Statistics:
VIX (78.4 percent) vs VIX previous week (70.2 percent)
S&P500-Mini (18.7 percent) vs S&P500-Mini previous week (34.0 percent)
DowJones-Mini (17.4 percent) vs DowJones-Mini previous week (22.8 percent)
Nasdaq-Mini (72.2 percent) vs Nasdaq-Mini previous week (71.4 percent)
Russell2000-Mini (45.0 percent) vs Russell2000-Mini previous week (42.4 percent)
Nikkei USD (73.1 percent) vs Nikkei USD previous week (66.2 percent)
EAFE-Mini (27.1 percent) vs EAFE-Mini previous week (50.7 percent)
Russell-Mini & MSCI EAFE-Mini top the 6-Week Strength Trends
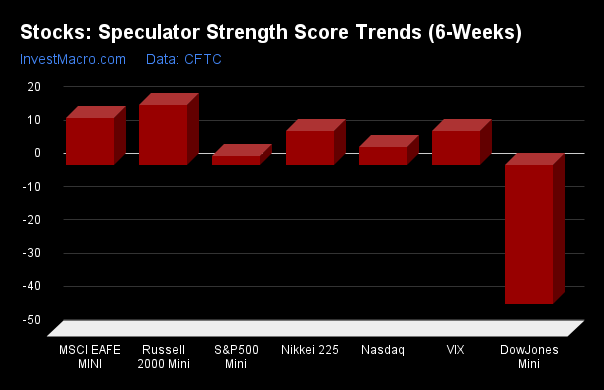
COT Strength Score Trends (or move index, calculates the 6-week changes in strength scores) showed that the Russell-Mini (18 percent) leads the past six weeks trends for the stock markets. The MSCI EAFE-Mini (14 percent), the Nikkei 225 (10 percent) and the VIX (10 percent) are the next highest positive movers in the latest trends data.
The DowJones-Mini (-42 percent) leads the downside trend scores currently.
Strength Trend Statistics:
VIX (10.4 percent) vs VIX previous week (3.7 percent)
S&P500-Mini (2.8 percent) vs S&P500-Mini previous week (19.0 percent)
DowJones-Mini (-41.8 percent) vs DowJones-Mini previous week (-28.1 percent)
Nasdaq-Mini (5.5 percent) vs Nasdaq-Mini previous week (5.2 percent)
Russell2000-Mini (18.1 percent) vs Russell2000-Mini previous week (8.2 percent)
Nikkei USD (10.4 percent) vs Nikkei USD previous week (12.9 percent)
EAFE-Mini (14.4 percent) vs EAFE-Mini previous week (49.1 percent)
Individual Stock Market Charts:
VIX Volatility Futures:
 The VIX Volatility large speculator standing this week totaled a net position of -49,649 contracts in the data reported through Tuesday. This was a weekly boost of 11,856 contracts from the previous week which had a total of -61,505 net contracts.
This week’s current strength score (the trader positioning range over the past three years, measured from 0 to 100) shows the speculators are currently Bullish with a score of 78.4 percent. The commercials are Bearish-Extreme with a score of 19.8 percent and the small traders (not shown in chart) are Bullish with a score of 79.4 percent.
| VIX Volatility Futures Statistics | SPECULATORS | COMMERCIALS | SMALL TRADERS |
| – Percent of Open Interest Longs: | 17.8 | 53.2 | 8.0 |
| – Percent of Open Interest Shorts: | 32.8 | 37.5 | 8.8 |
| – Net Position: | -49,649 | 52,093 | -2,444 |
| – Gross Longs: | 58,803 | 175,971 | 26,589 |
| – Gross Shorts: | 108,452 | 123,878 | 29,033 |
| – Long to Short Ratio: | 0.5 to 1 | 1.4 to 1 | 0.9 to 1 |
| NET POSITION TREND: | |||
| – Strength Index Score (3 Year Range Pct): | 78.4 | 19.8 | 79.4 |
| – Strength Index Reading (3 Year Range): | Bullish | Bearish-Extreme | Bullish |
| NET POSITION MOVEMENT INDEX: | |||
| – 6-Week Change in Strength Index: | 10.4 | -12.9 | 20.2 |
S&P500 Mini Futures:
 The S&P500 Mini large speculator standing this week totaled a net position of -202,480 contracts in the data reported through Tuesday. This was a weekly lowering of -82,661 contracts from the previous week which had a total of -119,819 net contracts.
This week’s current strength score (the trader positioning range over the past three years, measured from 0 to 100) shows the speculators are currently Bearish-Extreme with a score of 18.7 percent. The commercials are Bullish-Extreme with a score of 84.3 percent and the small traders (not shown in chart) are Bearish-Extreme with a score of 13.3 percent.
| S&P500 Mini Futures Statistics | SPECULATORS | COMMERCIALS | SMALL TRADERS |
| – Percent of Open Interest Longs: | 9.5 | 78.2 | 9.6 |
| – Percent of Open Interest Shorts: | 18.9 | 65.8 | 12.6 |
| – Net Position: | -202,480 | 266,455 | -63,975 |
| – Gross Longs: | 203,125 | 1,681,318 | 205,770 |
| – Gross Shorts: | 405,605 | 1,414,863 | 269,745 |
| – Long to Short Ratio: | 0.5 to 1 | 1.2 to 1 | 0.8 to 1 |
| NET POSITION TREND: | |||
| – Strength Index Score (3 Year Range Pct): | 18.7 | 84.3 | 13.3 |
| – Strength Index Reading (3 Year Range): | Bearish-Extreme | Bullish-Extreme | Bearish-Extreme |
| NET POSITION MOVEMENT INDEX: | |||
| – 6-Week Change in Strength Index: | 2.8 | 7.8 | -14.4 |
Dow Jones Mini Futures:
 The Dow Jones Mini large speculator standing this week totaled a net position of -22,148 contracts in the data reported through Tuesday. This was a weekly decrease of -2,068 contracts from the previous week which had a total of -20,080 net contracts.
This week’s current strength score (the trader positioning range over the past three years, measured from 0 to 100) shows the speculators are currently Bearish-Extreme with a score of 17.4 percent. The commercials are Bullish-Extreme with a score of 98.9 percent and the small traders (not shown in chart) are Bearish-Extreme with a score of 0.1 percent.
| Dow Jones Mini Futures Statistics | SPECULATORS | COMMERCIALS | SMALL TRADERS |
| – Percent of Open Interest Longs: | 19.1 | 67.5 | 12.9 |
| – Percent of Open Interest Shorts: | 46.2 | 30.7 | 22.6 |
| – Net Position: | -22,148 | 30,063 | -7,915 |
| – Gross Longs: | 15,604 | 55,161 | 10,581 |
| – Gross Shorts: | 37,752 | 25,098 | 18,496 |
| – Long to Short Ratio: | 0.4 to 1 | 2.2 to 1 | 0.6 to 1 |
| NET POSITION TREND: | |||
| – Strength Index Score (3 Year Range Pct): | 17.4 | 98.9 | 0.1 |
| – Strength Index Reading (3 Year Range): | Bearish-Extreme | Bullish-Extreme | Bearish-Extreme |
| NET POSITION MOVEMENT INDEX: | |||
| – 6-Week Change in Strength Index: | -41.8 | 45.9 | -30.1 |
Nasdaq Mini Futures:
 The Nasdaq Mini large speculator standing this week totaled a net position of -5,120 contracts in the data reported through Tuesday. This was a weekly gain of 1,352 contracts from the previous week which had a total of -6,472 net contracts.
This week’s current strength score (the trader positioning range over the past three years, measured from 0 to 100) shows the speculators are currently Bullish with a score of 72.2 percent. The commercials are Bearish with a score of 36.9 percent and the small traders (not shown in chart) are Bearish with a score of 31.4 percent.
| Nasdaq Mini Futures Statistics | SPECULATORS | COMMERCIALS | SMALL TRADERS |
| – Percent of Open Interest Longs: | 24.7 | 59.1 | 14.8 |
| – Percent of Open Interest Shorts: | 27.1 | 51.3 | 20.2 |
| – Net Position: | -5,120 | 16,858 | -11,738 |
| – Gross Longs: | 53,063 | 127,004 | 31,697 |
| – Gross Shorts: | 58,183 | 110,146 | 43,435 |
| – Long to Short Ratio: | 0.9 to 1 | 1.2 to 1 | 0.7 to 1 |
| NET POSITION TREND: | |||
| – Strength Index Score (3 Year Range Pct): | 72.2 | 36.9 | 31.4 |
| – Strength Index Reading (3 Year Range): | Bullish | Bearish | Bearish |
| NET POSITION MOVEMENT INDEX: | |||
| – 6-Week Change in Strength Index: | 5.5 | -8.2 | 6.5 |
Russell 2000 Mini Futures:
 The Russell 2000 Mini large speculator standing this week totaled a net position of -44,988 contracts in the data reported through Tuesday. This was a weekly gain of 4,315 contracts from the previous week which had a total of -49,303 net contracts.
This week’s current strength score (the trader positioning range over the past three years, measured from 0 to 100) shows the speculators are currently Bearish with a score of 45.0 percent. The commercials are Bullish with a score of 55.6 percent and the small traders (not shown in chart) are Bearish with a score of 27.5 percent.
| Russell 2000 Mini Futures Statistics | SPECULATORS | COMMERCIALS | SMALL TRADERS |
| – Percent of Open Interest Longs: | 8.5 | 85.6 | 4.7 |
| – Percent of Open Interest Shorts: | 17.8 | 76.3 | 4.6 |
| – Net Position: | -44,988 | 44,694 | 294 |
| – Gross Longs: | 40,762 | 411,188 | 22,631 |
| – Gross Shorts: | 85,750 | 366,494 | 22,337 |
| – Long to Short Ratio: | 0.5 to 1 | 1.1 to 1 | 1.0 to 1 |
| NET POSITION TREND: | |||
| – Strength Index Score (3 Year Range Pct): | 45.0 | 55.6 | 27.5 |
| – Strength Index Reading (3 Year Range): | Bearish | Bullish | Bearish |
| NET POSITION MOVEMENT INDEX: | |||
| – 6-Week Change in Strength Index: | 18.1 | -11.9 | -27.7 |
Nikkei Stock Average (USD) Futures:
 The Nikkei Stock Average (USD) large speculator standing this week totaled a net position of -930 contracts in the data reported through Tuesday. This was a weekly boost of 1,438 contracts from the previous week which had a total of -2,368 net contracts.
This week’s current strength score (the trader positioning range over the past three years, measured from 0 to 100) shows the speculators are currently Bullish with a score of 73.1 percent. The commercials are Bearish with a score of 34.0 percent and the small traders (not shown in chart) are Bearish with a score of 30.0 percent.
| Nikkei Stock Average Futures Statistics | SPECULATORS | COMMERCIALS | SMALL TRADERS |
| – Percent of Open Interest Longs: | 21.1 | 52.6 | 26.3 |
| – Percent of Open Interest Shorts: | 30.0 | 44.9 | 25.0 |
| – Net Position: | -930 | 795 | 135 |
| – Gross Longs: | 2,200 | 5,476 | 2,743 |
| – Gross Shorts: | 3,130 | 4,681 | 2,608 |
| – Long to Short Ratio: | 0.7 to 1 | 1.2 to 1 | 1.1 to 1 |
| NET POSITION TREND: | |||
| – Strength Index Score (3 Year Range Pct): | 73.1 | 34.0 | 30.0 |
| – Strength Index Reading (3 Year Range): | Bullish | Bearish | Bearish |
| NET POSITION MOVEMENT INDEX: | |||
| – 6-Week Change in Strength Index: | 10.4 | -13.7 | 6.6 |
MSCI EAFE Mini Futures:
 The MSCI EAFE Mini large speculator standing this week totaled a net position of -14,077 contracts in the data reported through Tuesday. This was a weekly decrease of -19,234 contracts from the previous week which had a total of 5,157 net contracts.
This week’s current strength score (the trader positioning range over the past three years, measured from 0 to 100) shows the speculators are currently Bearish with a score of 27.1 percent. The commercials are Bullish with a score of 68.1 percent and the small traders (not shown in chart) are Bearish with a score of 49.6 percent.
| MSCI EAFE Mini Futures Statistics | SPECULATORS | COMMERCIALS | SMALL TRADERS |
| – Percent of Open Interest Longs: | 7.9 | 89.6 | 2.2 |
| – Percent of Open Interest Shorts: | 11.6 | 87.6 | 0.5 |
| – Net Position: | -14,077 | 7,542 | 6,535 |
| – Gross Longs: | 30,891 | 348,705 | 8,454 |
| – Gross Shorts: | 44,968 | 341,163 | 1,919 |
| – Long to Short Ratio: | 0.7 to 1 | 1.0 to 1 | 4.4 to 1 |
| NET POSITION TREND: | |||
| – Strength Index Score (3 Year Range Pct): | 27.1 | 68.1 | 49.6 |
| – Strength Index Reading (3 Year Range): | Bearish | Bullish | Bearish |
| NET POSITION MOVEMENT INDEX: | |||
| – 6-Week Change in Strength Index: | 14.4 | -14.8 | 2.5 |
Article By InvestMacro – Receive our weekly COT Newsletter
*COT Report: The COT data, released weekly to the public each Friday, is updated through the most recent Tuesday (data is 3 days old) and shows a quick view of how large speculators or non-commercials (for-profit traders) were positioned in the futures markets.
The CFTC categorizes trader positions according to commercial hedgers (traders who use futures contracts for hedging as part of the business), non-commercials (large traders who speculate to realize trading profits) and nonreportable traders (usually small traders/speculators) as well as their open interest (contracts open in the market at time of reporting). See CFTC criteria here.

- COT Metals Charts: Weekly Speculator Bets see small gains for Silver & Gold Jul 12, 2026
- COT Bonds Charts: Speculator Bets led by SOFR 3-Months & 2-Year Bonds Jul 12, 2026
- COT Energy Charts: Weekly Speculator Changes led by Brent Oil Jul 12, 2026
- COT Soft Commodities Charts: Weekly Speculator Changes led by Sugar, Corn & Soybeans Jul 12, 2026
- The US and European stock indices are rising again amid renewed investor interest in the AI industry. Jul 10, 2026
- USD/JPY Falls as Yen Recovers Weekly Losses Jul 10, 2026
- Crude oil prices surged sharply by 7% in reaction to the rapid escalation of the conflict in the Middle East Jul 9, 2026
- Middle East Tensions Weigh on Gold Jul 9, 2026
- Pound Awaits Tighter Policy from Bank of England Jul 8, 2026
- The United States carried out airstrikes on Iran after Iran’s attacked tankers in the Strait of Hormuz. The RBNZ raised the interest rate to 2.5% Jul 8, 2026