By InvestMacro

Here are the latest charts and statistics for the Commitment of Traders (COT) data published by the Commodities Futures Trading Commission (CFTC).
The latest COT data is updated through Tuesday April 4th and shows a quick view of how large traders (for-profit speculators and commercial entities) were positioned in the futures markets.
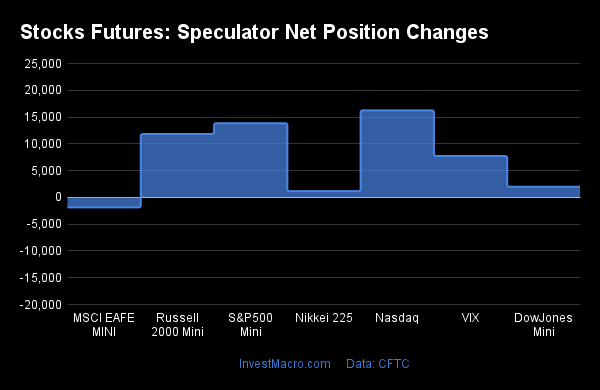
Weekly Speculator Changes are all lower
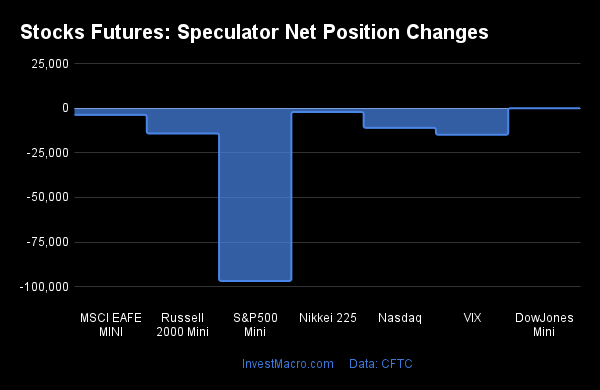
The COT stock markets speculator bets were lower this week as all of the markets we cover had lower speculator contracts.
The markets with the declines in speculator bets this week were the S&P500-Mini (-96,803 contracts), DowJones-Mini (-56 contracts), MSCI EAFE-Mini (-3,797 contracts), Nikkei 225 (-2,185 contracts), VIX (-14,909 contracts), Nasdaq-Mini (-11,037 contracts) and the Russell-Mini (-14,206 contracts) also registering lower bets on the week.
S&P500-Mini Speculators dropped their positions sharply to multi-year low
Highlighting the COT stocks data this week is the continued increases in bearish bets for the S&P500-Mini speculative positions.
The large speculator position in the S&P500-Mini futures dropped sharply this week and fell for the third straight week as well as for the fourth time out of the past five weeks. This week’s speculative decline by -96,803 contracts marks the largest one-week shortfall since last June and the S&P500-Mini bets have now been in a continuous bearish position for the past 42 consecutive weeks, also dating back to last June of 2022.
This week’s overall net speculator position standing of -321,459 contracts is now at the most bearish level since November 8th of 2011, a span dating back for 595 weeks. The speculator strength scores shows a bearish-extreme strength score level at 0 percent (or the absolute bottom) of its 3-year range. The speculator strength score trend (the past 6-weeks change of strength scores) shows a rising downtrend of -16 percent.
The COT speculator’s extreme bearish positioning does not portend a stock market downtrend though as the correlations between speculators and the stock markets are not nearly as strong as other futures markets (which are more trend-following). This can be due to the large amount of hedging positions throughout these markets.
The S&P500-Mini stock futures price has continued on its move higher after bottoming in October near the 3500 level. This week saw the S&P500-Mini futures close above the 4141 level and is up by approximately 18 percent since the most recent bottom in October.
| Apr-04-2023 | OI | OI-Index | Spec-Net | Spec-Index | Com-Net | COM-Index | Smalls-Net | Smalls-Index |
|---|
| S&P500-Mini | 2,219,512 | 17 | -321,459 | 0 | 281,472 | 87 | 39,987 | 36 |
| Nikkei 225 | 10,833 | 2 | -3,279 | 58 | 1,784 | 41 | 1,495 | 47 |
| Nasdaq-Mini | 232,186 | 32 | -18,385 | 65 | 12,556 | 34 | 5,829 | 64 |
| DowJones-Mini | 88,291 | 46 | -23,625 | 14 | 32,621 | 100 | -8,996 | 0 |
| VIX | 355,008 | 68 | -57,086 | 74 | 56,391 | 21 | 695 | 95 |
| Nikkei 225 Yen | 36,670 | 13 | 6,595 | 54 | 9,730 | 37 | -16,325 | 50 |
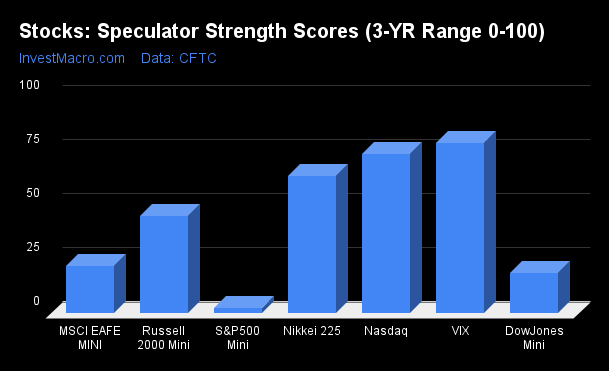
Strength Scores led by VIX & Nasdaq-Mini

COT Strength Scores (a normalized measure of Speculator positions over a 3-Year range, from 0 to 100 where above 80 is Extreme-Bullish and below 20 is Extreme-Bearish) showed that the VIX (74 percent) and the Nasdaq-Mini (65 percent) lead the stock markets this week. The Nikkei 225 (58 percent) and Nikkei 225 Yen (54 percent) come in as the next highest in the weekly strength scores.
On the downside, the S&P500-Mini (0 percent) and the DowJones-Mini (14 percent) come in at the lowest strength level currently and are in Extreme-Bearish territory (below 20 percent).
Strength Statistics:
VIX (73.6 percent) vs VIX previous week (83.9 percent)
S&P500-Mini (0.0 percent) vs S&P500-Mini previous week (17.4 percent)
DowJones-Mini (13.5 percent) vs DowJones-Mini previous week (13.7 percent)
Nasdaq-Mini (64.8 percent) vs Nasdaq-Mini previous week (70.9 percent)
Russell2000-Mini (37.8 percent) vs Russell2000-Mini previous week (46.3 percent)
Nikkei USD (57.9 percent) vs Nikkei USD previous week (69.4 percent)
EAFE-Mini (24.1 percent) vs EAFE-Mini previous week (28.8 percent)
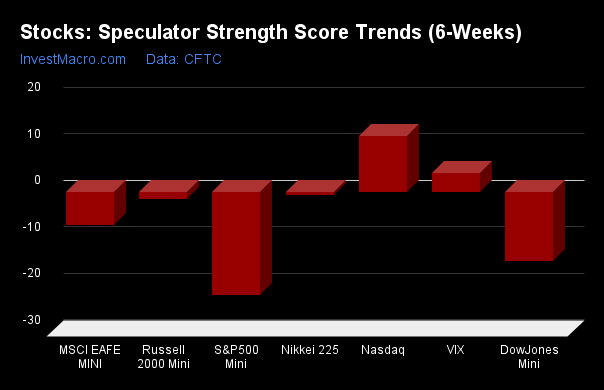
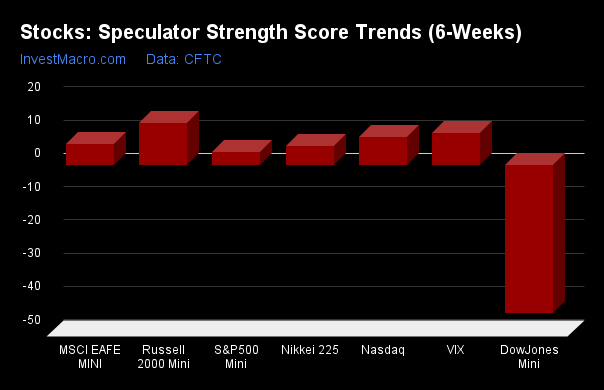
VIX tops the 6-Week Strength Trends

COT Strength Score Trends (or move index, calculates the 6-week changes in strength scores) showed that the VIX (-1 percent) was the highest of the past six weeks trends for the stock markets.
The DowJones-Mini (-19 percent) leads the downside trend scores currently with the Nikkei 225 Yen (-17 percent) coming in as the next market with lower trend scores.
Strength Trend Statistics:
VIX (-0.7 percent) vs VIX previous week (9.7 percent)
S&P500-Mini (-15.6 percent) vs S&P500-Mini previous week (3.9 percent)
DowJones-Mini (-19.4 percent) vs DowJones-Mini previous week (-44.3 percent)
Nasdaq-Mini (-2.4 percent) vs Nasdaq-Mini previous week (8.6 percent)
Russell2000-Mini (-1.4 percent) vs Russell2000-Mini previous week (12.7 percent)
Nikkei USD (-6.6 percent) vs Nikkei USD previous week (6.2 percent)
EAFE-Mini (-1.9 percent) vs EAFE-Mini previous week (6.6 percent)
Individual Stock Market Charts:
VIX Volatility Futures:
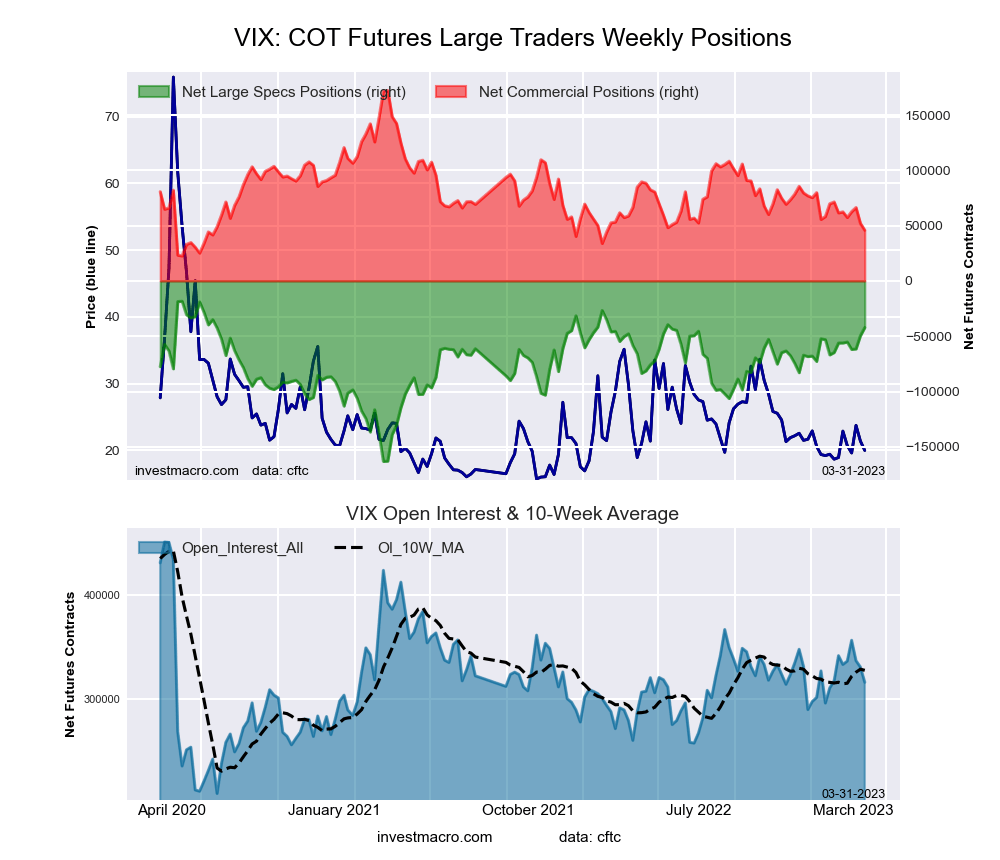
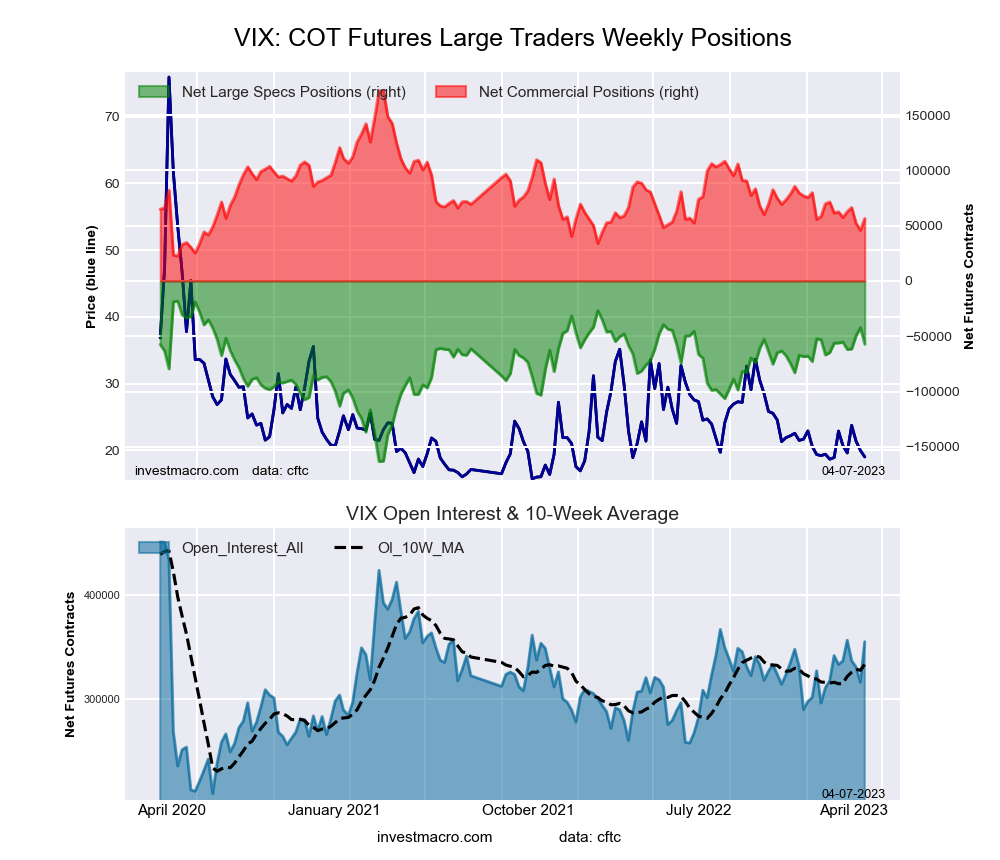 The VIX Volatility large speculator standing this week recorded a net position of -57,086 contracts in the data reported through Tuesday. This was a weekly lowering of -14,909 contracts from the previous week which had a total of -42,177 net contracts.
This week’s current strength score (the trader positioning range over the past three years, measured from 0 to 100) shows the speculators are currently Bullish with a score of 73.6 percent. The commercials are Bearish with a score of 21.3 percent and the small traders (not shown in chart) are Bullish-Extreme with a score of 94.6 percent.
| VIX Volatility Futures Statistics | SPECULATORS | COMMERCIALS | SMALL TRADERS |
| – Percent of Open Interest Longs: | 20.3 | 53.7 | 8.1 |
| – Percent of Open Interest Shorts: | 36.4 | 37.8 | 7.9 |
| – Net Position: | -57,086 | 56,391 | 695 |
| – Gross Longs: | 72,161 | 190,494 | 28,808 |
| – Gross Shorts: | 129,247 | 134,103 | 28,113 |
| – Long to Short Ratio: | 0.6 to 1 | 1.4 to 1 | 1.0 to 1 |
| NET POSITION TREND: | | | |
| – Strength Index Score (3 Year Range Pct): | 73.6 | 21.3 | 94.6 |
| – Strength Index Reading (3 Year Range): | Bullish | Bearish | Bullish-Extreme |
| NET POSITION MOVEMENT INDEX: | | | |
| – 6-Week Change in Strength Index: | -0.7 | -4.1 | 33.8 |
S&P500 Mini Futures:
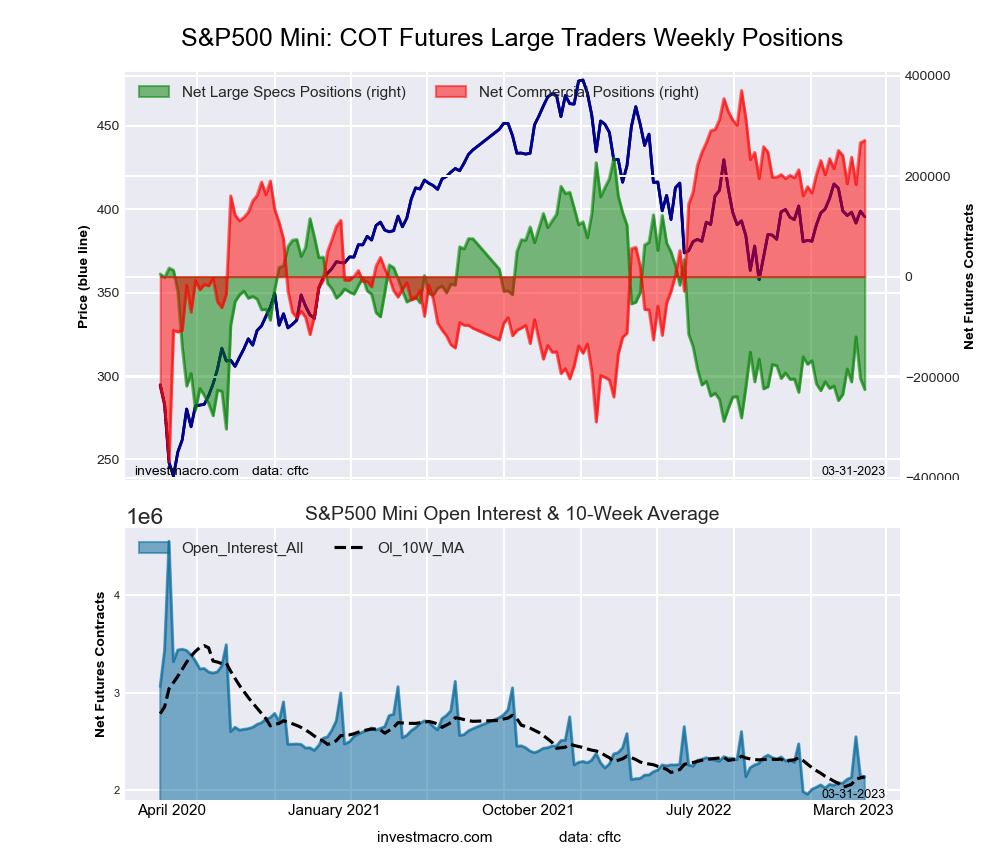
 The S&P500 Mini large speculator standing this week recorded a net position of -321,459 contracts in the data reported through Tuesday. This was a weekly decline of -96,803 contracts from the previous week which had a total of -224,656 net contracts.
This week’s current strength score (the trader positioning range over the past three years, measured from 0 to 100) shows the speculators are currently Bearish-Extreme with a score of 0.0 percent. The commercials are Bullish-Extreme with a score of 86.5 percent and the small traders (not shown in chart) are Bearish with a score of 35.7 percent.
| S&P500 Mini Futures Statistics | SPECULATORS | COMMERCIALS | SMALL TRADERS |
| – Percent of Open Interest Longs: | 7.4 | 76.2 | 13.6 |
| – Percent of Open Interest Shorts: | 21.9 | 63.5 | 11.8 |
| – Net Position: | -321,459 | 281,472 | 39,987 |
| – Gross Longs: | 163,766 | 1,690,406 | 300,962 |
| – Gross Shorts: | 485,225 | 1,408,934 | 260,975 |
| – Long to Short Ratio: | 0.3 to 1 | 1.2 to 1 | 1.2 to 1 |
| NET POSITION TREND: | | | |
| – Strength Index Score (3 Year Range Pct): | 0.0 | 86.5 | 35.7 |
| – Strength Index Reading (3 Year Range): | Bearish-Extreme | Bullish-Extreme | Bearish |
| NET POSITION MOVEMENT INDEX: | | | |
| – 6-Week Change in Strength Index: | -15.6 | 6.1 | 10.1 |
Dow Jones Mini Futures:
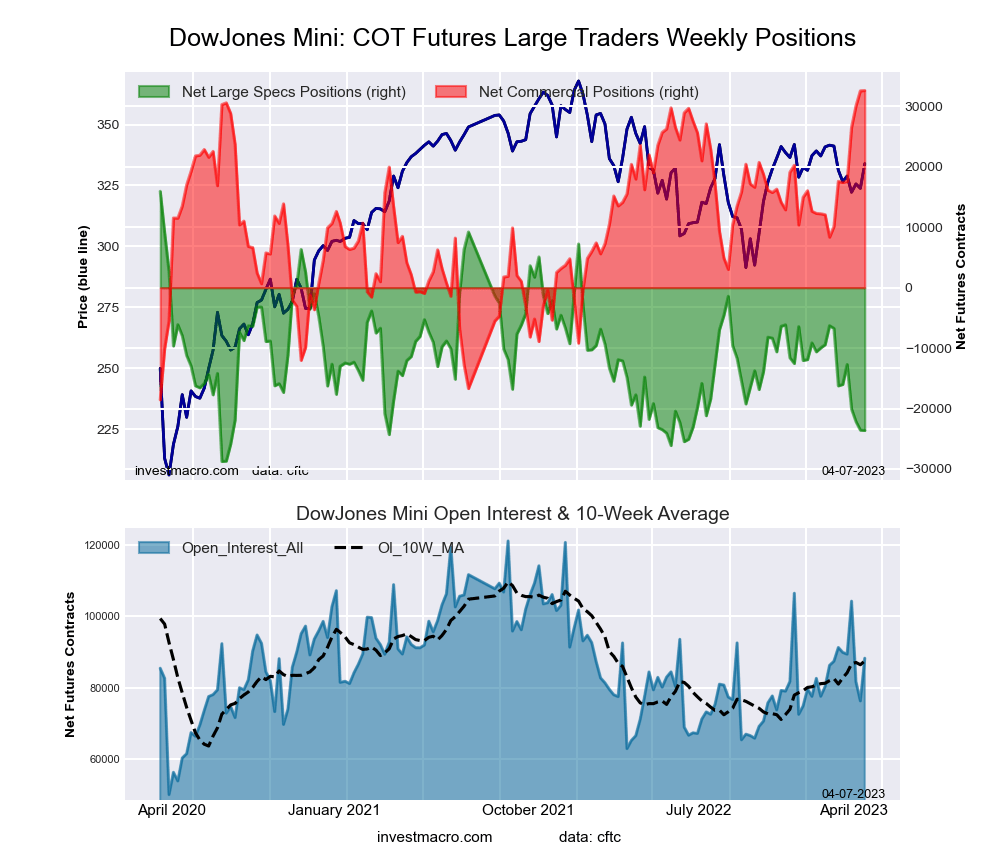 The Dow Jones Mini large speculator standing this week recorded a net position of -23,625 contracts in the data reported through Tuesday. This was a weekly fall of -56 contracts from the previous week which had a total of -23,569 net contracts.
This week’s current strength score (the trader positioning range over the past three years, measured from 0 to 100) shows the speculators are currently Bearish-Extreme with a score of 13.5 percent. The commercials are Bullish-Extreme with a score of 100.0 percent and the small traders (not shown in chart) are Bearish-Extreme with a score of 0.0 percent.
| Dow Jones Mini Futures Statistics | SPECULATORS | COMMERCIALS | SMALL TRADERS |
| – Percent of Open Interest Longs: | 16.2 | 68.3 | 14.7 |
| – Percent of Open Interest Shorts: | 43.0 | 31.4 | 24.8 |
| – Net Position: | -23,625 | 32,621 | -8,996 |
| – Gross Longs: | 14,302 | 60,314 | 12,942 |
| – Gross Shorts: | 37,927 | 27,693 | 21,938 |
| – Long to Short Ratio: | 0.4 to 1 | 2.2 to 1 | 0.6 to 1 |
| NET POSITION TREND: | | | |
| – Strength Index Score (3 Year Range Pct): | 13.5 | 100.0 | 0.0 |
| – Strength Index Reading (3 Year Range): | Bearish-Extreme | Bullish-Extreme | Bearish-Extreme |
| NET POSITION MOVEMENT INDEX: | | | |
| – 6-Week Change in Strength Index: | -19.4 | 30.5 | -37.3 |
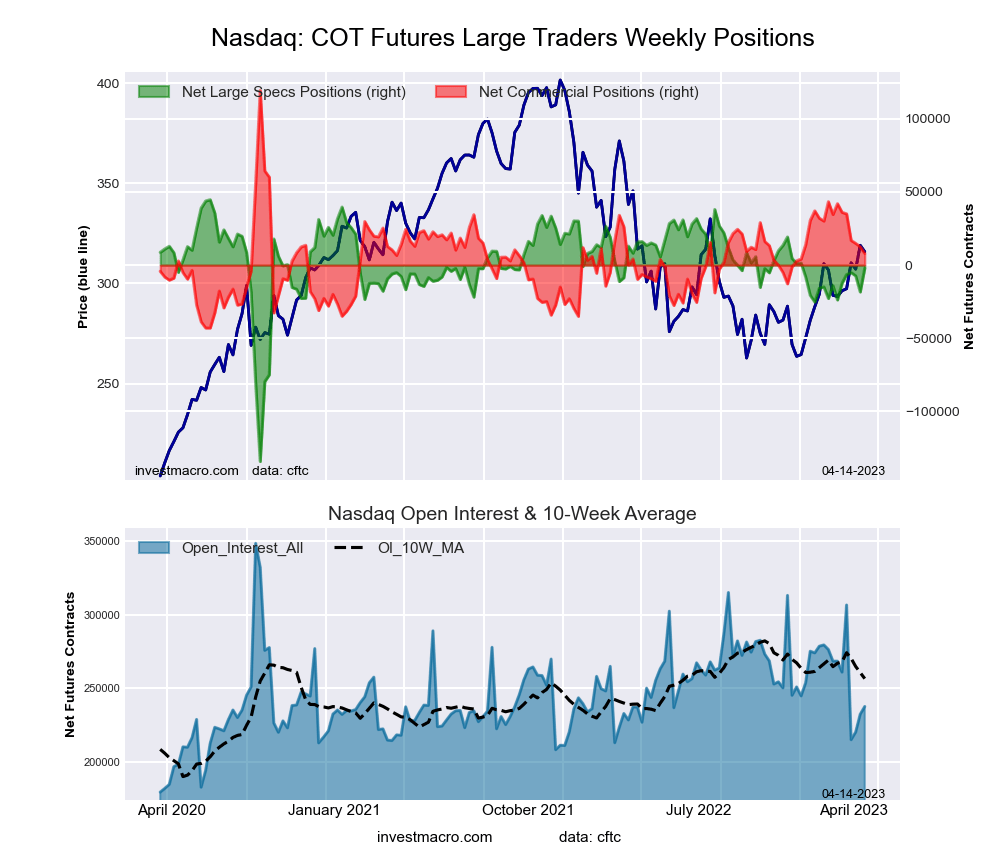
Nasdaq Mini Futures:
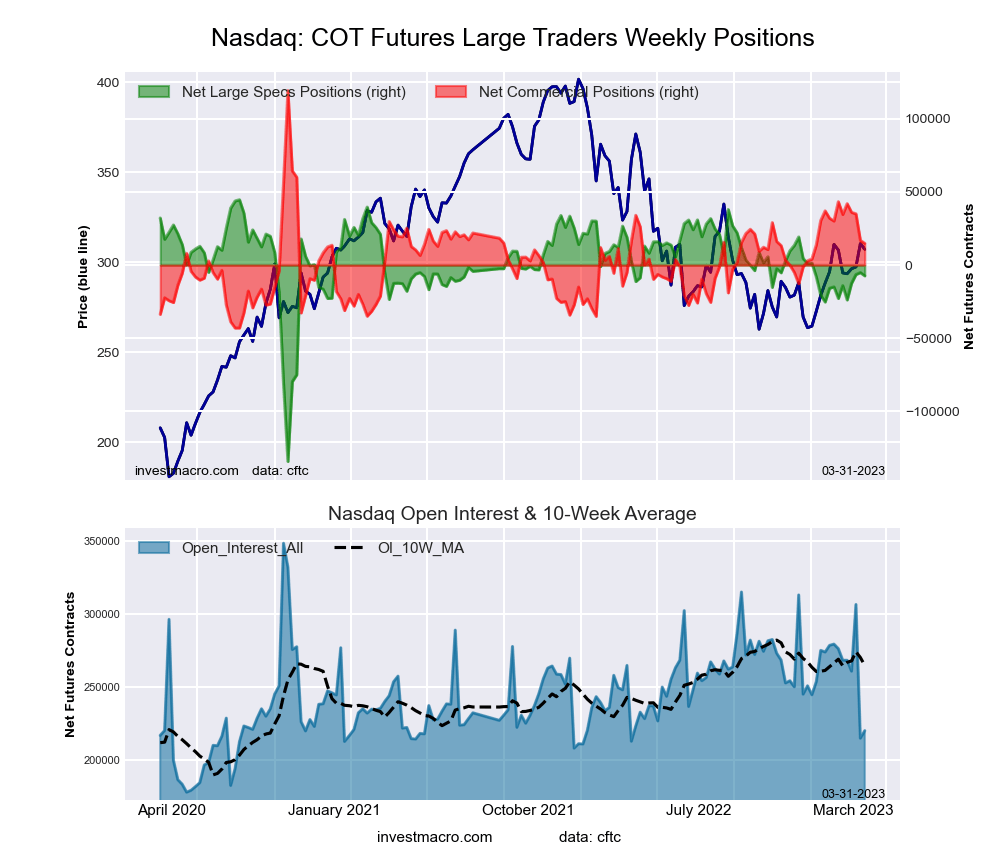
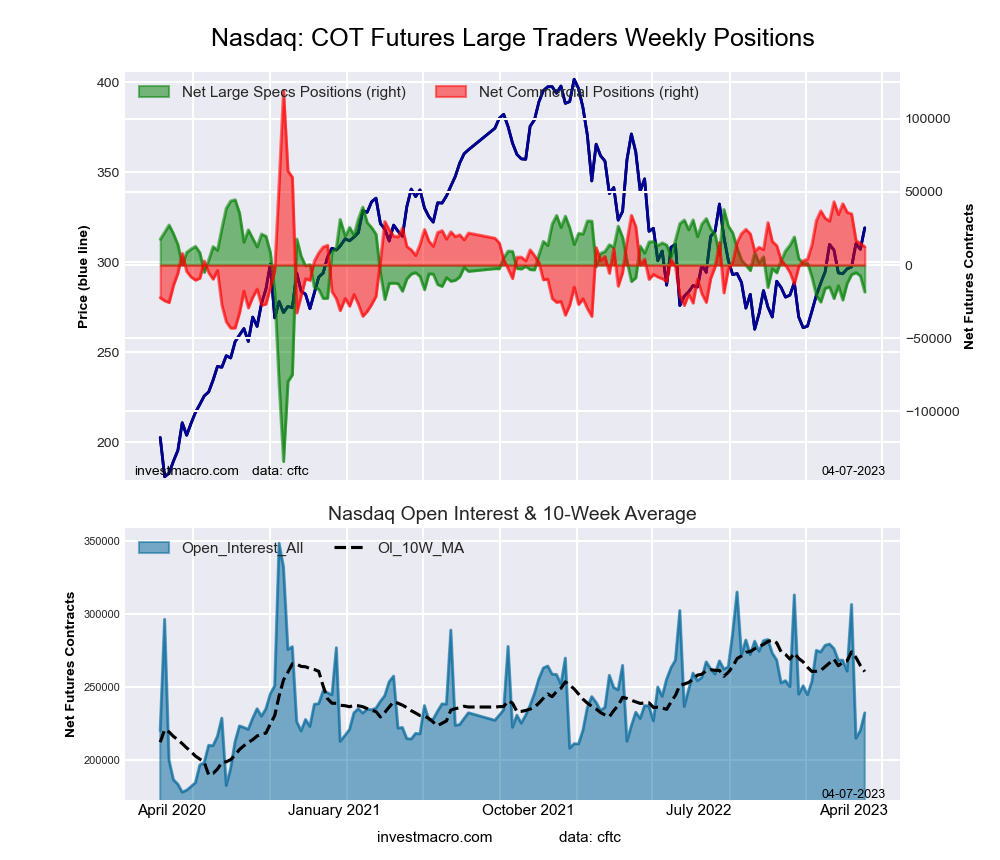 The Nasdaq Mini large speculator standing this week recorded a net position of -18,385 contracts in the data reported through Tuesday. This was a weekly lowering of -11,037 contracts from the previous week which had a total of -7,348 net contracts.
This week’s current strength score (the trader positioning range over the past three years, measured from 0 to 100) shows the speculators are currently Bullish with a score of 64.8 percent. The commercials are Bearish with a score of 34.2 percent and the small traders (not shown in chart) are Bullish with a score of 64.2 percent.
| Nasdaq Mini Futures Statistics | SPECULATORS | COMMERCIALS | SMALL TRADERS |
| – Percent of Open Interest Longs: | 16.7 | 59.3 | 22.0 |
| – Percent of Open Interest Shorts: | 24.6 | 53.9 | 19.5 |
| – Net Position: | -18,385 | 12,556 | 5,829 |
| – Gross Longs: | 38,815 | 137,754 | 51,175 |
| – Gross Shorts: | 57,200 | 125,198 | 45,346 |
| – Long to Short Ratio: | 0.7 to 1 | 1.1 to 1 | 1.1 to 1 |
| NET POSITION TREND: | | | |
| – Strength Index Score (3 Year Range Pct): | 64.8 | 34.2 | 64.2 |
| – Strength Index Reading (3 Year Range): | Bullish | Bearish | Bullish |
| NET POSITION MOVEMENT INDEX: | | | |
| – 6-Week Change in Strength Index: | -2.4 | -13.6 | 49.2 |
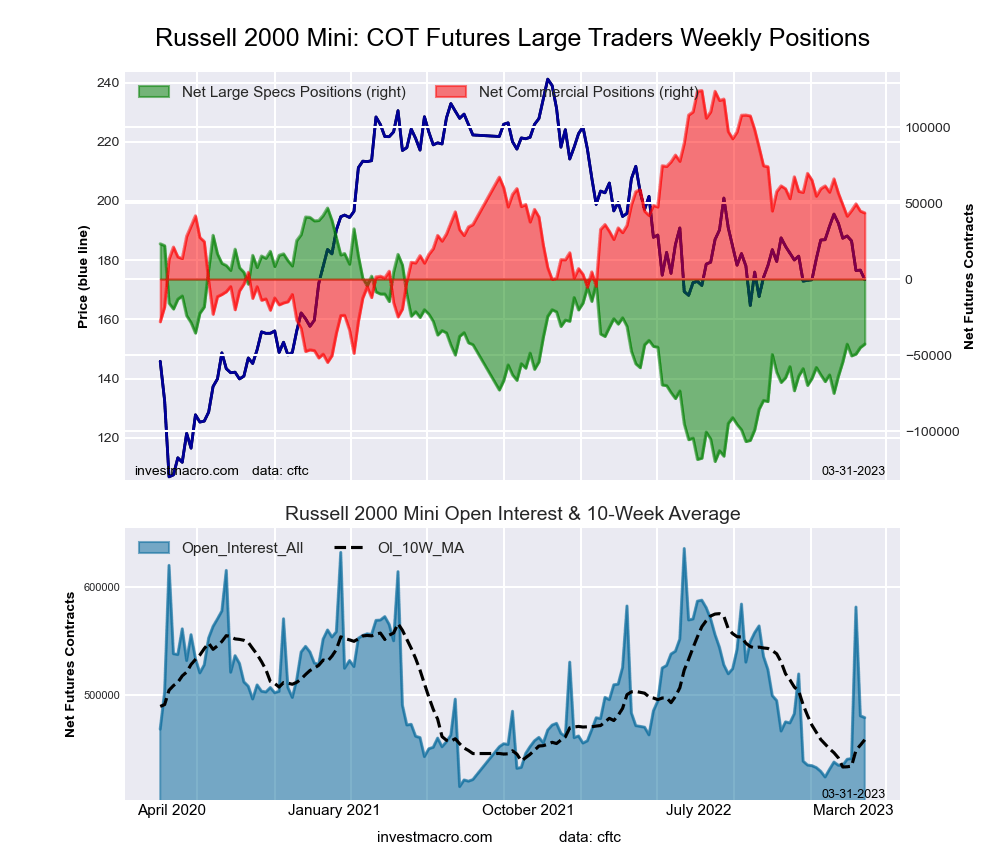
Russell 2000 Mini Futures:
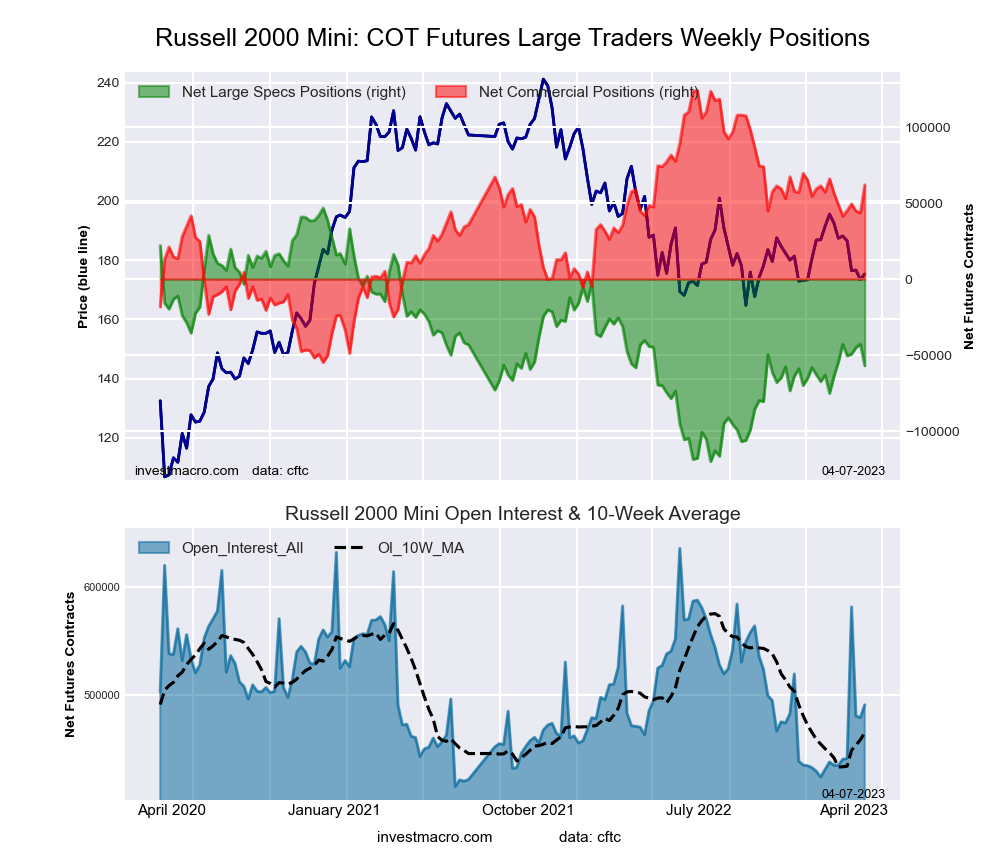 The Russell 2000 Mini large speculator standing this week recorded a net position of -56,956 contracts in the data reported through Tuesday. This was a weekly lowering of -14,206 contracts from the previous week which had a total of -42,750 net contracts.
This week’s current strength score (the trader positioning range over the past three years, measured from 0 to 100) shows the speculators are currently Bearish with a score of 37.8 percent. The commercials are Bullish with a score of 65.3 percent and the small traders (not shown in chart) are Bearish-Extreme with a score of 11.2 percent.
| Russell 2000 Mini Futures Statistics | SPECULATORS | COMMERCIALS | SMALL TRADERS |
| – Percent of Open Interest Longs: | 9.0 | 85.4 | 4.2 |
| – Percent of Open Interest Shorts: | 20.6 | 72.8 | 5.3 |
| – Net Position: | -56,956 | 61,943 | -4,987 |
| – Gross Longs: | 44,007 | 419,111 | 20,784 |
| – Gross Shorts: | 100,963 | 357,168 | 25,771 |
| – Long to Short Ratio: | 0.4 to 1 | 1.2 to 1 | 0.8 to 1 |
| NET POSITION TREND: | | | |
| – Strength Index Score (3 Year Range Pct): | 37.8 | 65.3 | 11.2 |
| – Strength Index Reading (3 Year Range): | Bearish | Bullish | Bearish-Extreme |
| NET POSITION MOVEMENT INDEX: | | | |
| – 6-Week Change in Strength Index: | -1.4 | 7.3 | -33.0 |
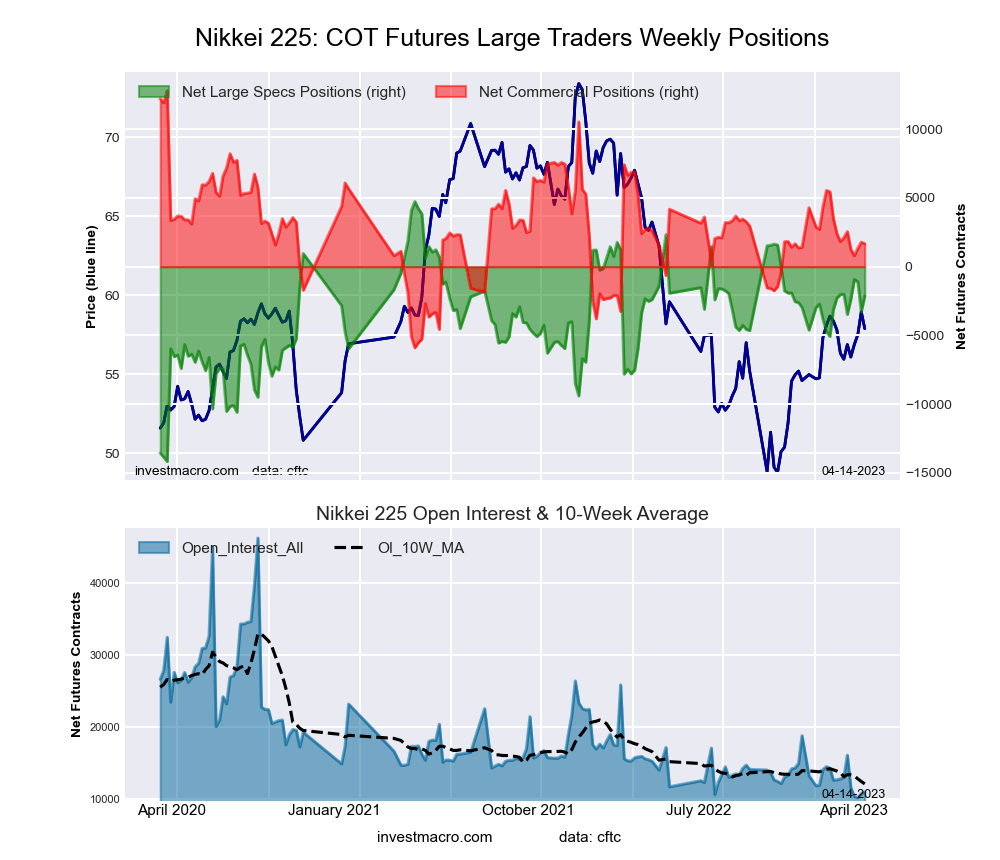
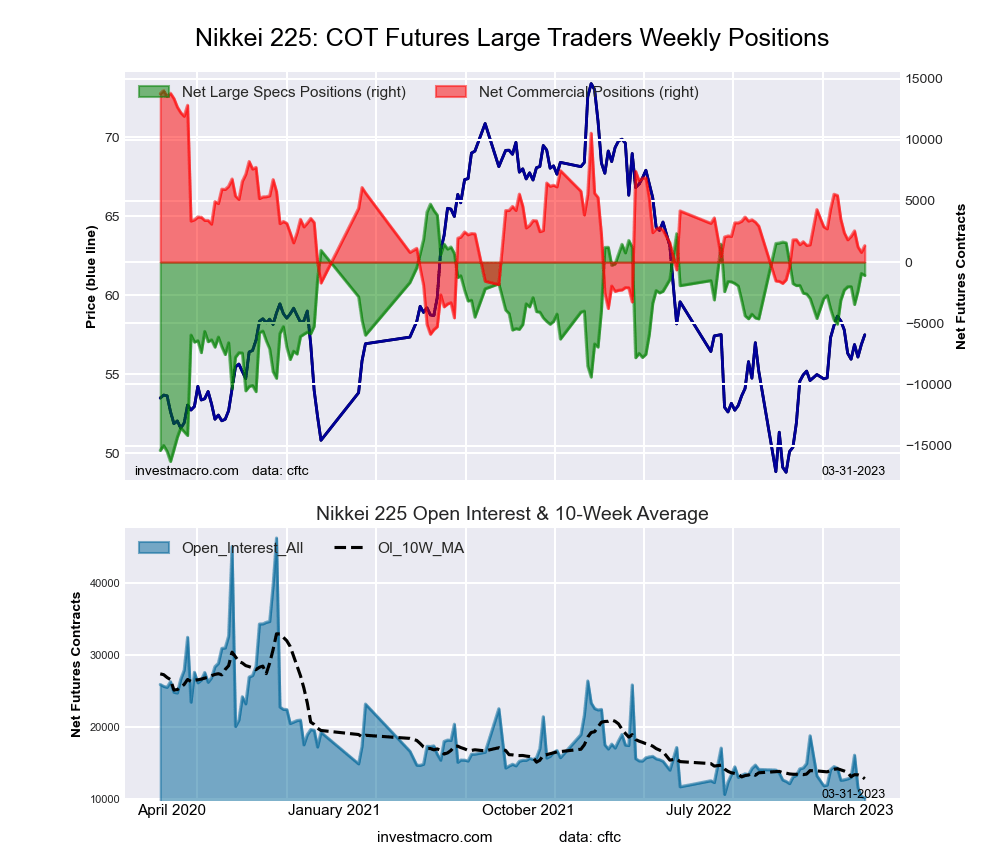
Nikkei Stock Average (USD) Futures:
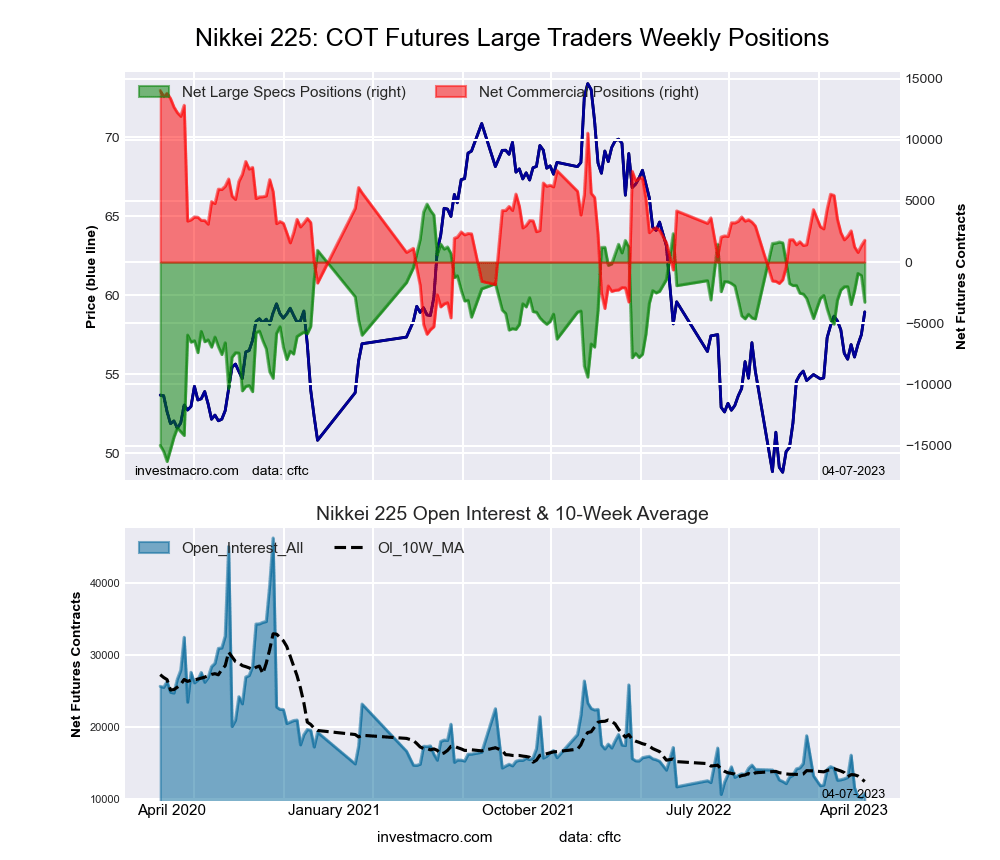 The Nikkei Stock Average (USD) large speculator standing this week recorded a net position of -3,279 contracts in the data reported through Tuesday. This was a weekly lowering of -2,185 contracts from the previous week which had a total of -1,094 net contracts.
This week’s current strength score (the trader positioning range over the past three years, measured from 0 to 100) shows the speculators are currently Bullish with a score of 57.9 percent. The commercials are Bearish with a score of 41.0 percent and the small traders (not shown in chart) are Bearish with a score of 47.1 percent.
| Nikkei Stock Average Futures Statistics | SPECULATORS | COMMERCIALS | SMALL TRADERS |
| – Percent of Open Interest Longs: | 7.7 | 52.9 | 39.4 |
| – Percent of Open Interest Shorts: | 38.0 | 36.4 | 25.6 |
| – Net Position: | -3,279 | 1,784 | 1,495 |
| – Gross Longs: | 839 | 5,728 | 4,266 |
| – Gross Shorts: | 4,118 | 3,944 | 2,771 |
| – Long to Short Ratio: | 0.2 to 1 | 1.5 to 1 | 1.5 to 1 |
| NET POSITION TREND: | | | |
| – Strength Index Score (3 Year Range Pct): | 57.9 | 41.0 | 47.1 |
| – Strength Index Reading (3 Year Range): | Bullish | Bearish | Bearish |
| NET POSITION MOVEMENT INDEX: | | | |
| – 6-Week Change in Strength Index: | -6.6 | -0.2 | 16.3 |
MSCI EAFE Mini Futures:
 The MSCI EAFE Mini large speculator standing this week recorded a net position of -16,486 contracts in the data reported through Tuesday. This was a weekly lowering of -3,797 contracts from the previous week which had a total of -12,689 net contracts.
This week’s current strength score (the trader positioning range over the past three years, measured from 0 to 100) shows the speculators are currently Bearish with a score of 24.1 percent. The commercials are Bullish with a score of 71.0 percent and the small traders (not shown in chart) are Bearish with a score of 49.7 percent.
| MSCI EAFE Mini Futures Statistics | SPECULATORS | COMMERCIALS | SMALL TRADERS |
| – Percent of Open Interest Longs: | 7.3 | 89.2 | 2.9 |
| – Percent of Open Interest Shorts: | 11.5 | 86.7 | 1.3 |
| – Net Position: | -16,486 | 9,921 | 6,565 |
| – Gross Longs: | 28,818 | 351,928 | 11,632 |
| – Gross Shorts: | 45,304 | 342,007 | 5,067 |
| – Long to Short Ratio: | 0.6 to 1 | 1.0 to 1 | 2.3 to 1 |
| NET POSITION TREND: | | | |
| – Strength Index Score (3 Year Range Pct): | 24.1 | 71.0 | 49.7 |
| – Strength Index Reading (3 Year Range): | Bearish | Bullish | Bearish |
| NET POSITION MOVEMENT INDEX: | | | |
| – 6-Week Change in Strength Index: | -1.9 | 1.8 | 0.3 |
Article By InvestMacro – Receive our weekly COT Newsletter
*COT Report: The COT data, released weekly to the public each Friday, is updated through the most recent Tuesday (data is 3 days old) and shows a quick view of how large speculators or non-commercials (for-profit traders) were positioned in the futures markets.
The CFTC categorizes trader positions according to commercial hedgers (traders who use futures contracts for hedging as part of the business), non-commercials (large traders who speculate to realize trading profits) and nonreportable traders (usually small traders/speculators) as well as their open interest (contracts open in the market at time of reporting). See CFTC criteria here.


