Archive for Stock Market News – Page 35

Beware the Unintended Consequences

Source: Michael Ballanger  (3/13/23) 

In light of the Silicon Valley Bank collapse, Michael Ballanger of GGM Advisory Inc. reviews what he believes the Fed will do and what the unintended consequences of that might be. 

Since I suspect that every newsletter writer, blogger, financial journalist, and armchair strategist will be writing about the major story for the capital markets for 2023, I figured that I might as well too.

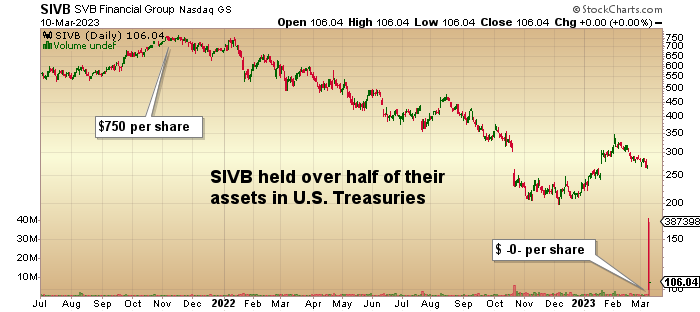
The story involves the sudden and shocking vaporization of a forty-year-old bank out of the West Coast, Silicon Valley Bank,  that had acted as the bagman for the bulk of the Silicon Valley start-ups and was ranked as the eighteenth largest bank in the United States with over US$212 billion in assets.

It was announced mid-week that they had been experiencing “difficulties” and were trying to complete a capital raise in order to shore up losses in their fixed income portfolio, but by Friday afternoon, it was learned that not only had they experienced losses due to declines in U.S. treasury prices, they were also experiencing a classic bank “run” where some US$42 billion was withdrawn by Thursday afternoon.

 The Great Financial Bailout of 2008

What was left was a negative equity position of almost a billion dollars, and THAT, my friends, is exactly where the major Wall Street banks were in 2008 before Congress flinched embarrassingly and bailed out the sorry lot.

The intrigue grows when one peels back the layers of this grotesque onion to find out that none other than the Master of Financial Shenanigans — JP Morgan Chase — the most-prosecuted and most-fined financial institution in the history of the world – was instrumental in inciting many SVB clients to remove their funds in favor of “the Jamie bank.”

Prominent venture capitalists advised their tech startups to withdraw money from Silicon Valley Bank, while mega institutions such as JP Morgan Chase & Co. sought to convince some SVB customers to move their funds Thursday by touting the safety of their assets. (Zerohedge — March 10th).

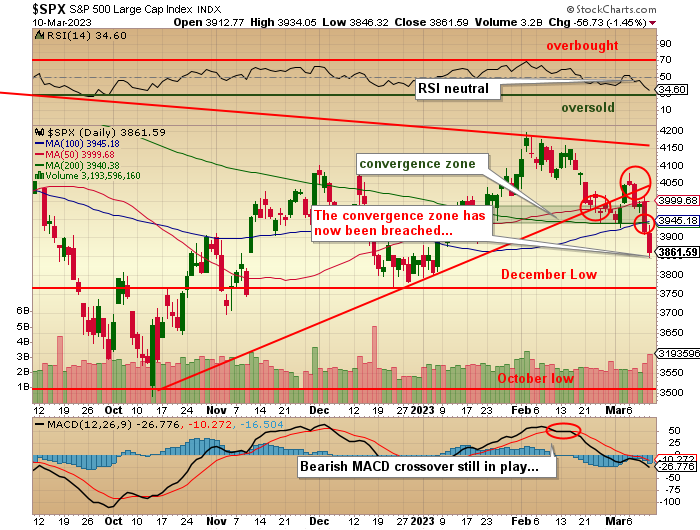
Needless to say, the impact of this major bank failure is going to be seen by many (but not me) as the event which will force the Fed to finally engage and that highly-coveted “pivot,” but it came to a tad late as stocks took it on the chin again on Friday with the S&P closing below that all-important “convergence zone” containing the three moving averages (200,100 and 50-day) as well as the uptrend line drawn off the Oct-Dec lows.

SVB’s demise is not going to cause one ripple in the Fed’s monetary policy despite the friendlier average hourly wages number and slightly-higher unemployment rate from Friday’s jobs report.

I emailed subscribers with a “Crash Alert” and tweeted out that yesterday felt a lot like Friday, October 16th, 1987, when many of the junior stock salesmen with whom I worked sat mesmerized by a tape that lost 103 Dow points in the final hour of trading.

While I have no idea what will happen when stocks re-open on Monday, the problems that led to the demise of Silicon Valley Bank can be found solidly embedded in the halls of the Marriner S. Eccles Building, which is located at the intersection of 20th St. and Constitution Avenue in Washington, D.C.

In case you are wondering, that is the workplace of the Chairman of the U.S. Federal Reserve Board, the Right Honorable Jerome Powell, whose anti-inflation monetary policy has been responsible for the largest and fastest interest rate increase in world history.

After the Great Financial Bailout of 2008, legislators brought in laws designed to force the banks to hold only “risk-free assets” with the assumption that U.S. Treasuries fit that bill admirably. Banks like (but not confined only to) Silicon Valley Bank were/are forced to hold treasury bonds of varying duration under law, but anyone that has ever owned leveraged bonds knows that when you own a 30-year bond and interest rates move against you (higher), the price of the bond declines.

Value at Risk

Whether it is the U.S. government or Toys R Us bond, it is the coupon (rate of interest), the duration (time until maturity), and the debit balance (leverage) that can torpedo you; it is not the credit quality of the issuer.

What It smells like to me is that someone at SVB forgot those courses he/she was supposed to take at the Harvard Business School on “hedging” because there is no bank or insurance company of which I know that runs a bond portfolio absent risk management tools such as “hedging” which involves the use of derivatives and which is absolutely critical, especially since Chairman Powell warned the Wall Street banks (for whom he toils) multiple times that he was going to start increasing rates and waited for what seemed like an eternity before he actually began the levitation process.

Whoever was responsible for keeping an eye on the “VAR” (“value at risk”) at SVB was obviously asleep at the switch unless what appeared to be acceptable prior to the bank run was suddenly and ruthlessly removed once the US$42 billion in withdrawals took hold.

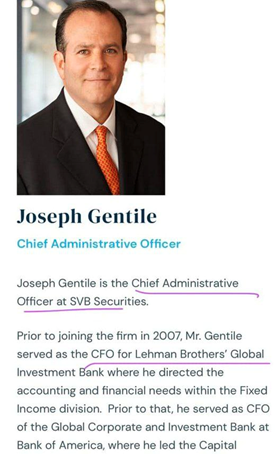
Now, I do not wish to be “unfair,” but the graphic to the left shows the pleased countenance of one Joseph Gentile, Chief Administrative Officer at SVB Securities, and whether it should be classified as “bad luck” or “poor timing” or “serendipitous savagery,” he also held the title of Chief Financial Officer for Lehman Brothers, the only big U.S. bank that did not receive a bailout back in 2008 and proceeded to collapse in bankruptcy.

Perhaps the staffers at SVB thought that the chances of a Joseph Gentile being involved in two gargantuan financial collapses in one career would be analogous to receiving two shark bites on the same day that you get hit by lightning.

It might happen but probably not.

There exists little need to tear away any more layers of this topical onion in today’s missive other than to explain why it is markedly different than the events back in late September when the Bank of England was forced to reverse their QT decision in favor of a US$5 billion QE bailout for the British pension funds.

As you all recall, I had been pounding the table as a card-carrying bear looking for new lows in October when that seminal event was announced.

That weekend, I reversed course and proceeded to cover all shorts, liquidate all put options, and began to look at a long position in the S&P 500.

Thirteen days later, stocks began what amounted to a 20% pop terminating the move in very early February against ear-splitting protests from the entire hedge fund community, all of whom were positioned for an October CRASH but instead were taken out behind the financial woodshed and thrashed to within inches of their lives.

SVB’s demise is not going to cause one ripple in the Fed’s monetary policy despite the friendlier average hourly wages number and slightly-higher unemployment rate from Friday’s jobs report, and the reason is that a bank run instigated by a competitor bank resulting in a “technical default” will not be deemed as a “systemic risk” event and since the only occurrence that could alter the Fed’s monetary policy is just that, the Fed will take no action.

However, what MAY happen is that the events of last week may prompt a more pervasive rout of the regional banks, and if there is one thing upon which one may bank (forgive the bad pun), it is that just as there is never “only one cockroach,” those bond losses at SVB are present right across the global financial system and are NOT ring-fenced to one insignificant venture capital financial institution in California.

If stocks take out the December lows at SPX 3,764, the buy signal from the formerly-bullish January Barometer becomes impotent, sending traders limping to the safety of cash.

The trade was in acting late last week to “get defensive” in a hurry which we did, and we are now able to ride the move down to the test of those all-critical December lows.

Gold

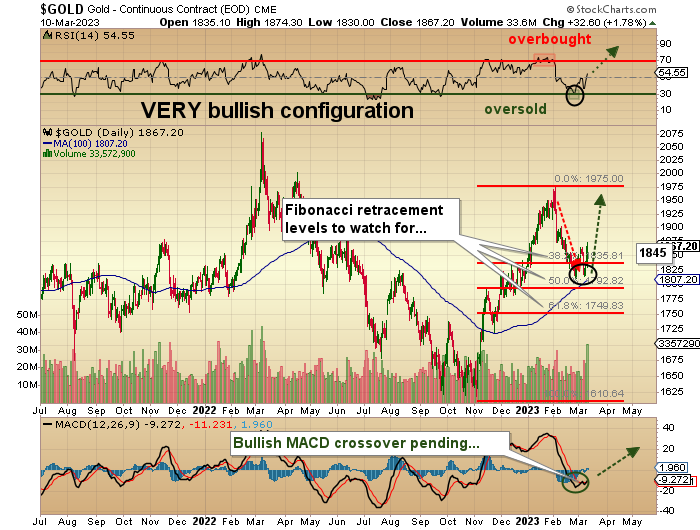
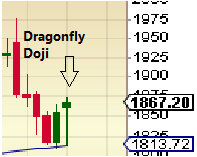
Gold was all over the map last week but went out with a weekly “dragonfly doji” a powerful buy signal where you have a wide range of values but which ended with a strong rally that closes on the highs for the session — in this case, for the week.

I prefer to stay with gold because whereas early in the session, silver was vastly outperforming gold; it would wind up the day ahead only 2.18% versus gold up 2.08%. I see a test of the US$1,900 range by the end of the month, but if, in fact, I see further turmoil in the regional banks that spreads to the money-center banks and abroad, gold could catch a “fear trade” bid as traders move rapidly for the safety of non-paper assets.

Another positive was that the mining stocks (HUI) shrugged off the weakness in the broader market and had a decent day, up 1.36%, which, I should add, was what used to happen with bankable regularity back in the day when trading involved rules and where rules could not be broken.

Gold was always used as a hedge against volatility, and it worked beautifully until the walking carbon units (humans) were replaced by robots in the trading pits.

What I need to see next week is a gold market that divorces itself from the broad markets and has both silver and gold miners outperforming. The weekly COT report came in with yet another positive as Commercials continue to cover shorts as Large Specs liquidate, which will continue to happen as long as the net shorts for the bullion bank behemoths stays above 100k.

At the lows in December 2015, that number actually went positive (net long) very briefly, but it has not happened since.

I will be finding great amusement in reading the tweets and watching the blogs of the big power players on Wall Street, like Bill Ackman, who has a habit of whining at or near major turning points.

He has already launched one tweet begging “the government” to reverse the SVB event “before the opening on Monday” lest it turns into “look out below.”

This is classic lobbying by the same Wall Street carpetbaggers that wound up being rescued back in March 2020 and September 2008 instead of being monkey-hammered by margin calls like the rest of the world. I expect that the Jamie Dimons of the world will be calling for “regulatory action,” including a Fed pivot, in order to avoid stock market Armageddon and quarter-end bonus enhancements because their prop desk suddenly went south.

What was it that Santayana said about “the more things change?”

Good luck in 2023.


Michael Ballanger Disclaimer:

This letter makes no guarantee or warranty on the accuracy or completeness of the data provided. Nothing contained herein is intended or shall be deemed to be investment advice, implied or otherwise. This letter represents my views and replicates trades that I am making but nothing more than that. Always consult your registered advisor to assist you with your investments. I accept no liability for any loss arising from the use of the data contained on this letter. Options and junior mining stocks contain a high level of risk that may result in the loss of part or all invested capital and therefore are suitable for experienced and professional investors and traders only. One should be familiar with the risks involved in junior mining and options trading and we recommend consulting a financial adviser if you feel you do not understand the risks involved.

Disclosures:

1) Michael J. Ballanger: I, or members of my immediate household or family, own securities of the following companies mentioned in this article: None.  I personally am, or members of my immediate household or family are, paid by the following companies mentioned in this article: My company, Bonaventure Explorations Ltd., has a consulting relationship with: None.

2) The following companies mentioned in this article are billboard sponsors of Streetwise Reports: None. Click here for important disclosures about sponsor fees. As of the date of this article, an affiliate of Streetwise Reports has a consulting relationship with: None. Please click here for more information.

3) Statements and opinions expressed are the opinions of the author and not of Streetwise Reports or its officers. The author is wholly responsible for the validity of the statements. The author was not paid by Streetwise Reports for this article. Streetwise Reports was not paid by the author to publish or syndicate this article. Streetwise Reports requires contributing authors to disclose any shareholdings in, or economic relationships with, companies that they write about. Streetwise Reports relies upon the authors to accurately provide this information and Streetwise Reports has no means of verifying its accuracy.

4) This article does not constitute investment advice. Each reader is encouraged to consult with his or her individual financial professional and any action a reader takes as a result of information presented here is his or her own responsibility. By opening this page, each reader accepts and agrees to Streetwise Reports’ terms of use and full legal disclaimer. This article is not a solicitation for investment. Streetwise Reports does not render general or specific investment advice and the information on Streetwise Reports should not be considered a recommendation to buy or sell any security. Streetwise Reports does not endorse or recommend the business, products, services or securities of any company mentioned on Streetwise Reports.

5) From time to time, Streetwise Reports LLC and its directors, officers, employees or members of their families, as well as persons interviewed for articles and interviews on the site, may have a long or short position in securities mentioned. Directors, officers, employees or members of their immediate families are prohibited from making purchases and/or sales of those securities in the open market or otherwise from the time of the decision to publish an article until three business days after the publication of the article. The foregoing prohibition does not apply to articles that in substance only restate previously published company releases.

The collapse of Silicon Valley Bank rocks banking sector: Three takeaways

By George Prior

The collapse of Silicon Valley Bank (SVB) threatened to prompt a wider financial crisis and the authorities had no choice but to roll out emergency measures, says the CEO of one of the world’s largest independent financial advisory, asset management and fintech organizations.

The observation from Nigel Green of deVere Group comes as US regulators said that from Monday the failed bank’s customers will have access to all their deposits, and that they have set up a new facility to give banks access to emergency funds. The Federal Reserve has also taken steps to make it easier for banks to borrow from the central bank in emergencies.

He says there are three key takeaways from the SVB’s collapse.

First, “The authorities will get some stick, especially from the shareholders of SVB investors. The asset value of the bank itself is zero, and there’s no chance of a government bailout for shareholders.

“But the hands of the Fed, the Treasury and regulators, were forced into taking action in order to break the doom loop hitting the banking sector.

“A failure to act would have to be a dereliction of duty. If they hadn’t given customers access to their deposits from Monday, it would have resulted in a loss of confidence in the banking system, leading to a ‘run on the banks’ which, in turn, would have caused a liquidity crisis in the banking and broader financial system, potentially triggering a full-blown global financial crisis. The authorities couldn’t let this happen,” he explains.

Second, “It brings into question the Trump-era deregulation of banks. The decision to roll back Dodd-Frank’s ‘too big to fail’ rules, reducing both oversight and capital requirements, seems to have contributed to SVB’s collapse.

“It appears that the deregulation has allowed banks like SVB to take reckless risks. Now there needs to be a serious conversation about reversing the law to shore-up confidence and to avoid further collapses.”

Third, “It is now doubtful that the Fed will continue with its plan for aggressive interest rate hikes. The next hike was widely expected on March 22 following robust jobs data in January and February.

“We expect the stress in the banking sector, and the wider impact on confidence, now will give the central bank cause for pause on its rate hike program.

“Many will be asking: Was SVB – a major source of funding for US tech start-ups –  the first high profile victim of the Fed’s higher interest rates agenda?

The deVere CEO concludes: “The situation is moving quickly and despite the action taken by authorities, it isn’t over yet.

“Amongst other issues, there remain fears about contagion and there are real concerns that startups may be unable to pay their bills and salaries in coming days, venture investors may now find it hard to raise funds, and an already-pummelled sector could face a long rout.”

About:

deVere Group is one of the world’s largest independent advisors of specialist global financial solutions to international, local mass affluent, and high-net-worth clients.  It has a network of offices across the world, over 80,000 clients and $12bn under advisement.

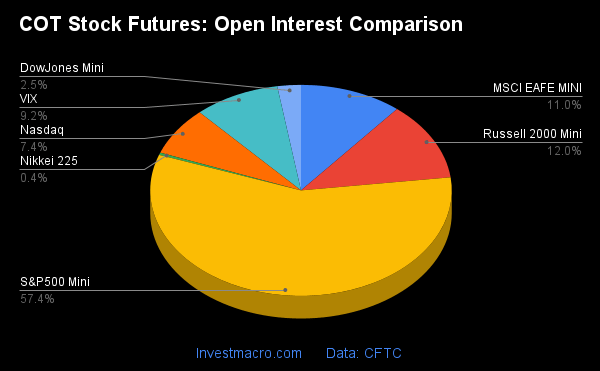
COT Stock Market Charts: February 21st Speculator Changes led by S&P500-Mini & Russell-Mini

By InvestMacro

Here are the latest charts and statistics for the Commitment of Traders (COT) data published by the Commodities Futures Trading Commission (CFTC).

The latest COT data is updated through Tuesday February 21st and shows a quick view of how large traders (for-profit speculators and commercial entities) were positioned in the futures markets.

*** This data is still a few weeks behind the current data because the CFTC up-to-date data has been delayed due to a cybersecurity event that happened in early February to ION Cleared Derivatives (a subsidiary of ION Markets). This hack of ION has created a problem for the large trader positions to be reported and reconciled. The CFTC has back-filled some data over the past few weeks and will get the data back up to date in the coming weeks.

Weekly Speculator Changes led by S&P500-Mini & Russell-Mini

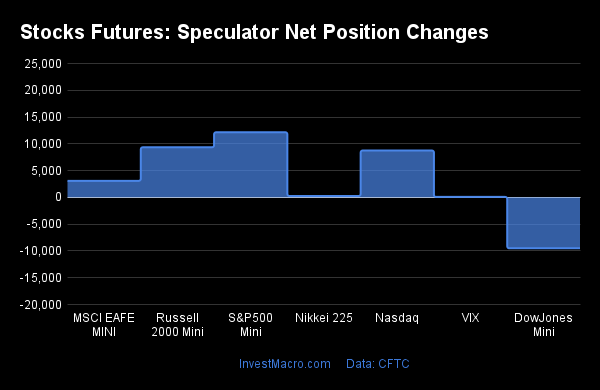
The COT stock markets speculator bets were higher through February 21st as six out of the seven stock markets we cover had higher positioning while the other one market had lower speculator contracts.

Leading the gains for the stock markets was S&P500-Mini (12,163 contracts), Russell-Mini (9,360 contracts), Nasdaq-Mini (8,755 contracts), MSCI EAFE-Mini (3,092 contracts), Nikkei 225 (260 contracts) and VIX (89 contracts) showing positive weeks.

The market with the declines in speculator bets was DowJones-Mini (-9,507 contracts).


Data Snapshot of Stock Market Traders | Columns Legend
Feb-21-2023OIOI-IndexSpec-NetSpec-IndexCom-NetCOM-IndexSmalls-NetSmalls-Index
S&P500-Mini2,074,4864-234,29113241,15383-6,86225
Nikkei 22512,8496-2,022681,8243919831
Nasdaq-Mini268,29753-14,0696734,62048-20,55113
DowJones-Mini91,28858-16,2452817,59474-1,34934
VIX333,08251-56,1087462,40827-6,30061
Nikkei 225 Yen41,9572512,0057143112-12,43651


Strength Scores led by VIX & Nikkei 225 Yen

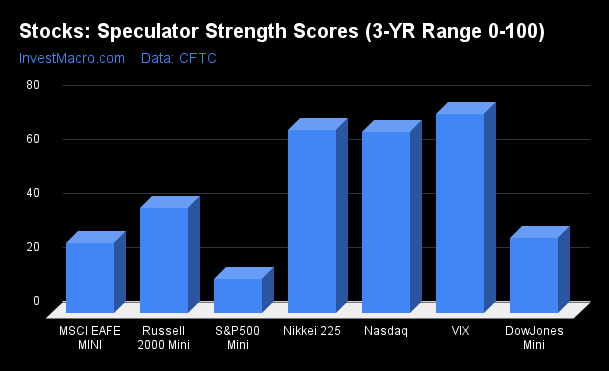
COT Strength Scores (a normalized measure of Speculator positions over a 3-Year range, from 0 to 100 where above 80 is Extreme-Bullish and below 20 is Extreme-Bearish) showed that the VIX (74 percent) and the Nikkei 225 Yen (71 percent) led the stock markets through February 21st. The Nikkei 225 (68 percent) and Nasdaq-Mini (67 percent) came in as the next highest in the weekly strength scores.

On the downside, the S&P500-Mini (13 percent) came in at the lowest strength level currently and is in Extreme-Bearish territory (below 20 percent). The next lowest strength score is the MSCI EAFE-Mini (26 percent).

Strength Statistics:
VIX (74.0 percent) vs VIX previous week (73.9 percent)
S&P500-Mini (12.8 percent) vs S&P500-Mini previous week (10.5 percent)
DowJones-Mini (28.0 percent) vs DowJones-Mini previous week (49.3 percent)
Nasdaq-Mini (67.2 percent) vs Nasdaq-Mini previous week (62.3 percent)
Russell2000-Mini (39.2 percent) vs Russell2000-Mini previous week (33.6 percent)
Nikkei USD (67.9 percent) vs Nikkei USD previous week (66.6 percent)
EAFE-Mini (26.0 percent) vs EAFE-Mini previous week (22.2 percent)


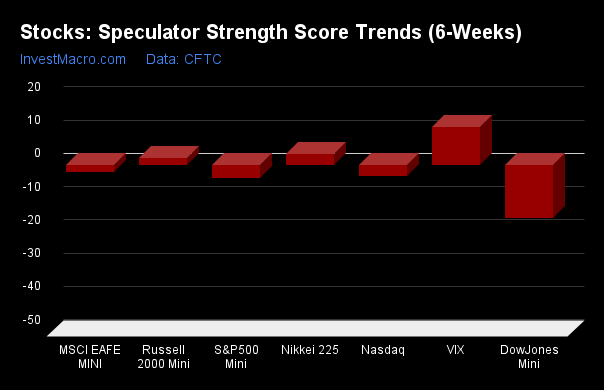
VIX & Nikkei 225 Yen top the 6-Week Strength Trends

COT Strength Score Trends (or move index, calculates the 6-week changes in strength scores) showed that the VIX (12 percent) led the six weeks trends for the stock markets. The Nikkei 225 Yen (9 percent), the Nikkei 225 (3 percent) and the Russell-Mini (2 percent) are the next highest positive movers in the latest trends data.

The DowJones-Mini (-16 percent) led the downside trend scores with the S&P500-Mini (-4 percent) coming in as the next market with lower trend scores.

Strength Trend Statistics:
VIX (11.5 percent) vs VIX previous week (8.1 percent)
S&P500-Mini (-3.9 percent) vs S&P500-Mini previous week (-14.7 percent)
DowJones-Mini (-15.9 percent) vs DowJones-Mini previous week (11.5 percent)
Nasdaq-Mini (-3.3 percent) vs Nasdaq-Mini previous week (-13.5 percent)
Russell2000-Mini (2.1 percent) vs Russell2000-Mini previous week (0.9 percent)
Nikkei USD (3.3 percent) vs Nikkei USD previous week (3.3 percent)
EAFE-Mini (-1.9 percent) vs EAFE-Mini previous week (-14.8 percent)


Individual Stock Market Charts:

VIX Volatility Futures:

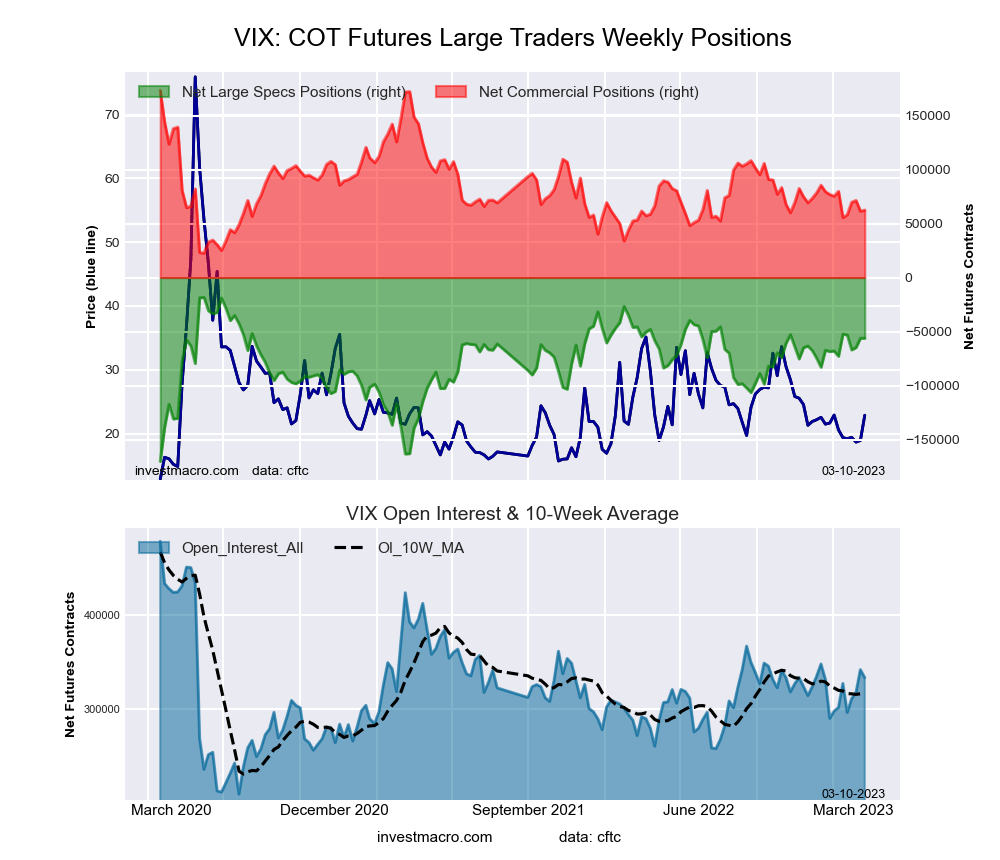
VIX Volatility Futures COT ChartThe VIX Volatility large speculator standing the week reached a net position of -56,108 contracts in the data reported through Tuesday February 21st. This was a weekly lift of 89 contracts from the previous week which had a total of -56,197 net contracts.

The week’s current strength score (the trader positioning range over the past three years, measured from 0 to 100) shows the speculators are currently Bullish with a score of 74.0 percent. The commercials are Bearish with a score of 26.7 percent and the small traders (not shown in chart) are Bullish with a score of 60.8 percent.

VIX Volatility Futures StatisticsSPECULATORSCOMMERCIALSSMALL TRADERS
– Percent of Open Interest Longs:15.455.57.0
– Percent of Open Interest Shorts:32.236.88.9
– Net Position:-56,10862,408-6,300
– Gross Longs:51,233184,96823,405
– Gross Shorts:107,341122,56029,705
– Long to Short Ratio:0.5 to 11.5 to 10.8 to 1
NET POSITION TREND:
– Strength Index Score (3 Year Range Pct):74.026.760.8
– Strength Index Reading (3 Year Range):BullishBearishBullish
NET POSITION MOVEMENT INDEX:
– 6-Week Change in Strength Index:11.5-11.63.4


S&P500 Mini Futures:

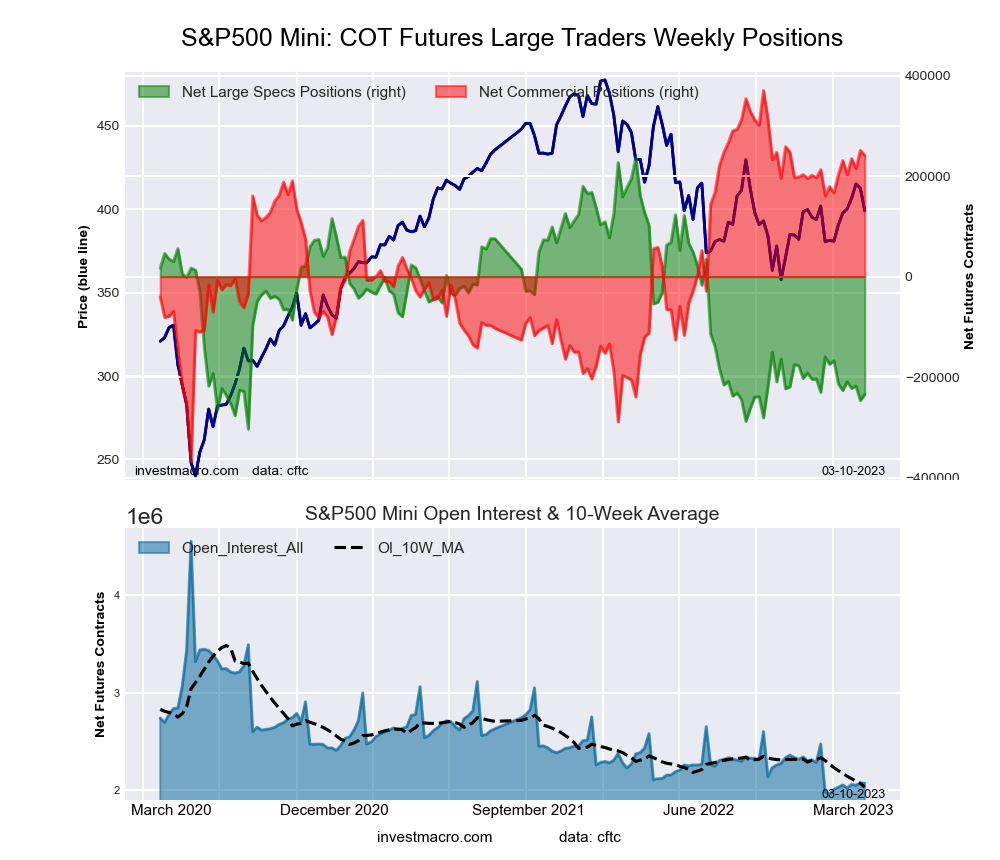
SP500 Mini Futures COT ChartThe S&P500 Mini large speculator standing the week reached a net position of -234,291 contracts in the data reported through Tuesday February 21st. This was a weekly gain of 12,163 contracts from the previous week which had a total of -246,454 net contracts.

The week’s current strength score (the trader positioning range over the past three years, measured from 0 to 100) shows the speculators are currently Bearish-Extreme with a score of 12.8 percent. The commercials are Bullish-Extreme with a score of 82.5 percent and the small traders (not shown in chart) are Bearish with a score of 24.9 percent.

S&P500 Mini Futures StatisticsSPECULATORSCOMMERCIALSSMALL TRADERS
– Percent of Open Interest Longs:11.274.412.1
– Percent of Open Interest Shorts:22.562.712.5
– Net Position:-234,291241,153-6,862
– Gross Longs:231,8081,542,524251,654
– Gross Shorts:466,0991,301,371258,516
– Long to Short Ratio:0.5 to 11.2 to 11.0 to 1
NET POSITION TREND:
– Strength Index Score (3 Year Range Pct):12.882.524.9
– Strength Index Reading (3 Year Range):Bearish-ExtremeBullish-ExtremeBearish
NET POSITION MOVEMENT INDEX:
– 6-Week Change in Strength Index:-3.95.2-3.6


Dow Jones Mini Futures:

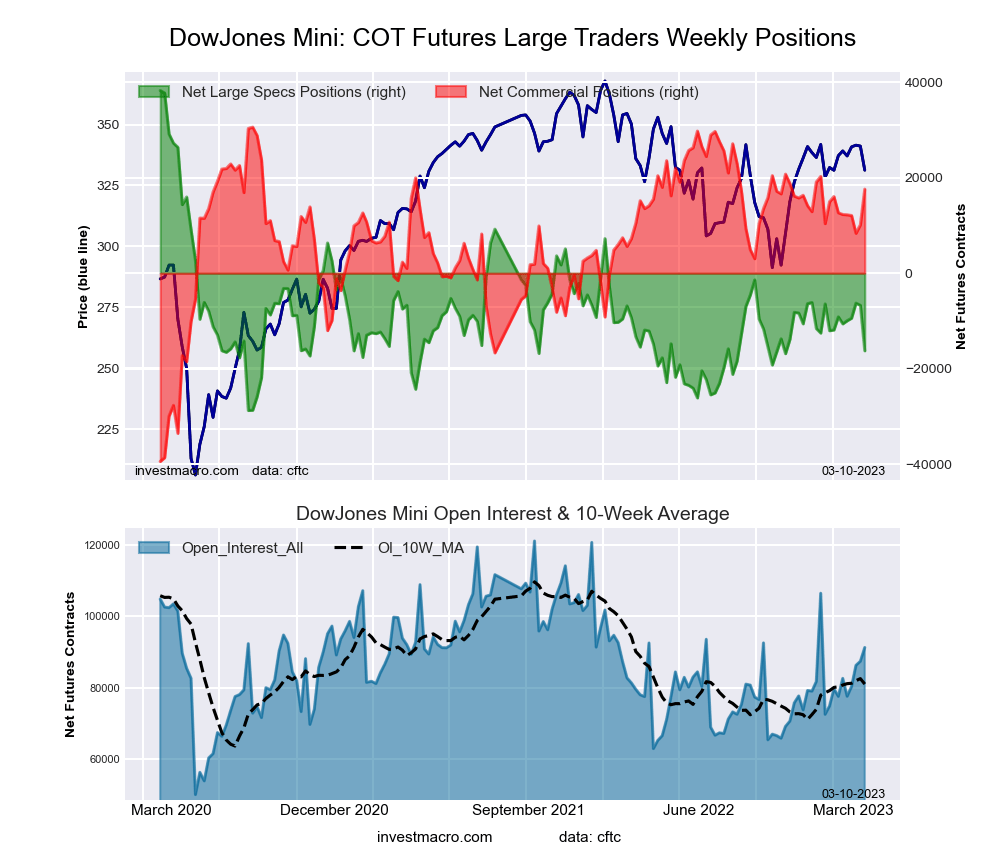
Dow Jones Mini Futures COT ChartThe Dow Jones Mini large speculator standing the week reached a net position of -16,245 contracts in the data reported through Tuesday February 21st. This was a weekly reduction of -9,507 contracts from the previous week which had a total of -6,738 net contracts.

The week’s current strength score (the trader positioning range over the past three years, measured from 0 to 100) shows the speculators are currently Bearish with a score of 28.0 percent. The commercials are Bullish with a score of 73.6 percent and the small traders (not shown in chart) are Bearish with a score of 33.9 percent.

Dow Jones Mini Futures StatisticsSPECULATORSCOMMERCIALSSMALL TRADERS
– Percent of Open Interest Longs:30.050.415.2
– Percent of Open Interest Shorts:47.731.116.7
– Net Position:-16,24517,594-1,349
– Gross Longs:27,34445,98213,918
– Gross Shorts:43,58928,38815,267
– Long to Short Ratio:0.6 to 11.6 to 10.9 to 1
NET POSITION TREND:
– Strength Index Score (3 Year Range Pct):28.073.633.9
– Strength Index Reading (3 Year Range):BearishBullishBearish
NET POSITION MOVEMENT INDEX:
– 6-Week Change in Strength Index:-15.910.111.1


Nasdaq Mini Futures:

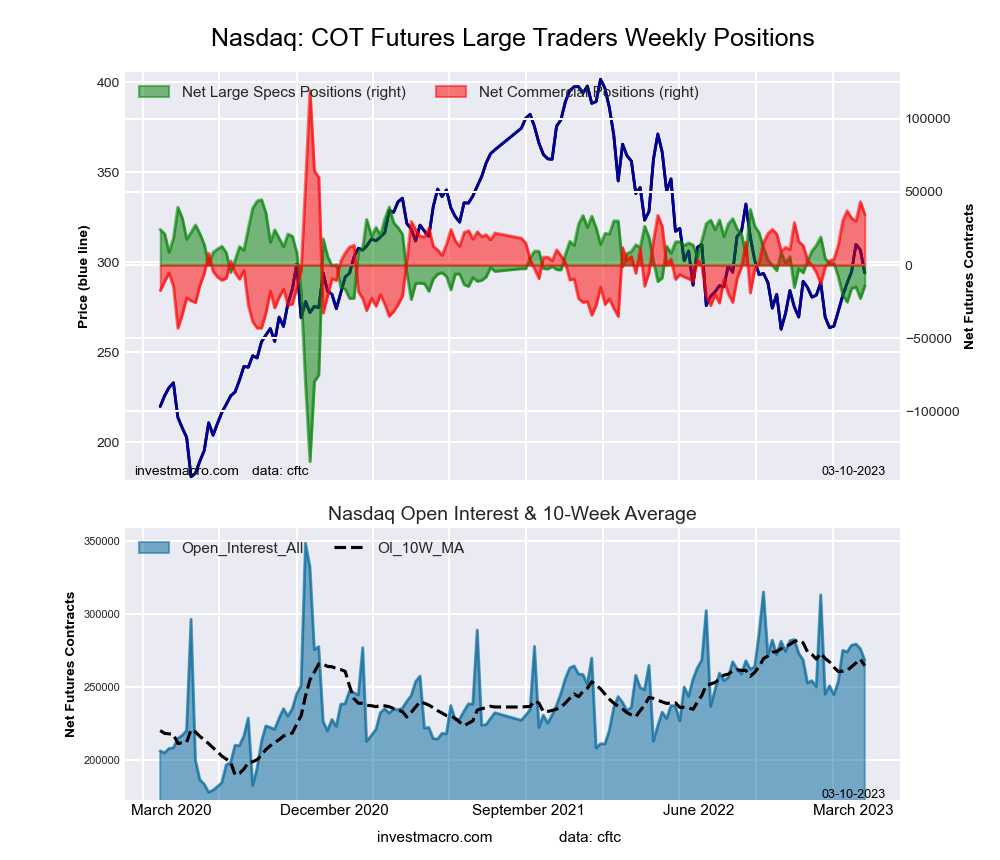
Nasdaq Mini Futures COT ChartThe Nasdaq Mini large speculator standing the week reached a net position of -14,069 contracts in the data reported through Tuesday February 21st. This was a weekly gain of 8,755 contracts from the previous week which had a total of -22,824 net contracts.

The week’s current strength score (the trader positioning range over the past three years, measured from 0 to 100) shows the speculators are currently Bullish with a score of 67.2 percent. The commercials are Bearish with a score of 47.8 percent and the small traders (not shown in chart) are Bearish-Extreme with a score of 13.0 percent.

Nasdaq Mini Futures StatisticsSPECULATORSCOMMERCIALSSMALL TRADERS
– Percent of Open Interest Longs:21.663.513.0
– Percent of Open Interest Shorts:26.850.620.7
– Net Position:-14,06934,620-20,551
– Gross Longs:57,849170,38634,896
– Gross Shorts:71,918135,76655,447
– Long to Short Ratio:0.8 to 11.3 to 10.6 to 1
NET POSITION TREND:
– Strength Index Score (3 Year Range Pct):67.247.813.0
– Strength Index Reading (3 Year Range):BullishBearishBearish-Extreme
NET POSITION MOVEMENT INDEX:
– 6-Week Change in Strength Index:-3.312.7-28.2


Russell 2000 Mini Futures:

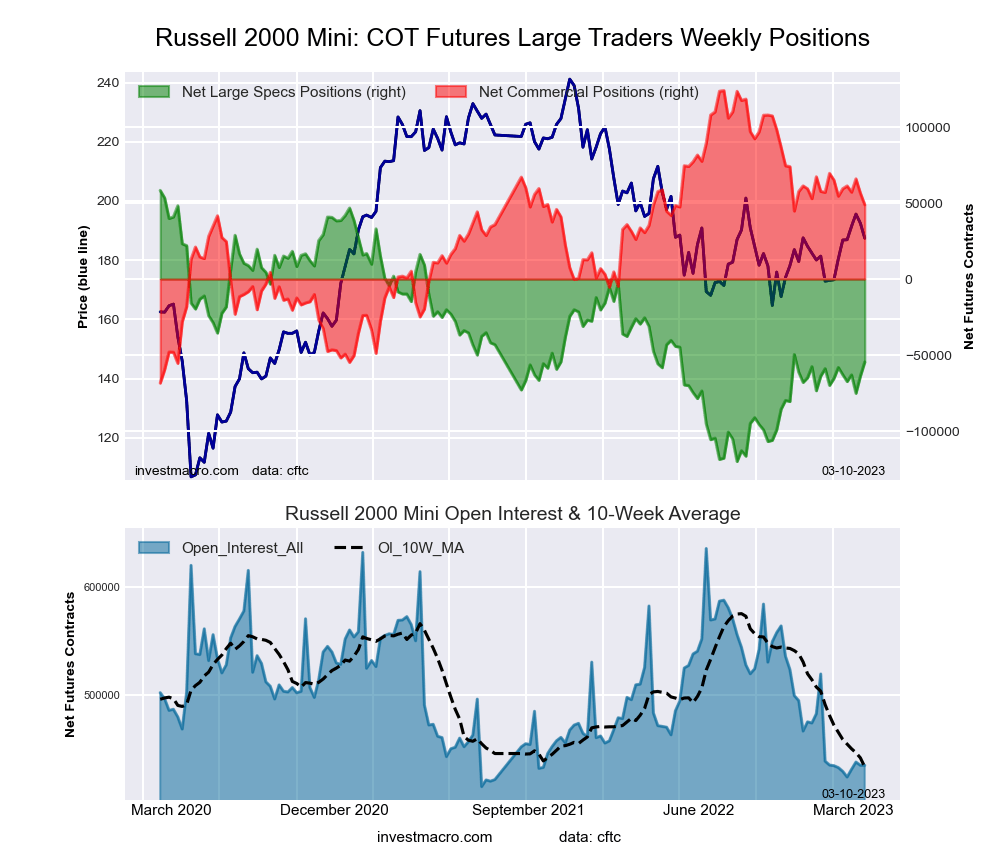
Russell 2000 Mini Futures COT ChartThe Russell 2000 Mini large speculator standing reached a net position of -54,548 contracts in the data reported through Tuesday February 21st. This was a weekly rise of 9,360 contracts from the previous week which had a total of -63,908 net contracts.

The week’s current strength score (the trader positioning range over the past three years, measured from 0 to 100) shows the speculators are currently Bearish with a score of 39.2 percent. The commercials are Bullish with a score of 58.0 percent and the small traders (not shown in chart) are Bearish with a score of 44.2 percent.

Russell 2000 Mini Futures StatisticsSPECULATORSCOMMERCIALSSMALL TRADERS
– Percent of Open Interest Longs:10.381.75.8
– Percent of Open Interest Shorts:22.970.54.5
– Net Position:-54,54848,8585,690
– Gross Longs:44,927355,13525,214
– Gross Shorts:99,475306,27719,524
– Long to Short Ratio:0.5 to 11.2 to 11.3 to 1
NET POSITION TREND:
– Strength Index Score (3 Year Range Pct):39.258.044.2
– Strength Index Reading (3 Year Range):BearishBullishBearish
NET POSITION MOVEMENT INDEX:
– 6-Week Change in Strength Index:2.1-3.26.5


Nikkei Stock Average (USD) Futures:

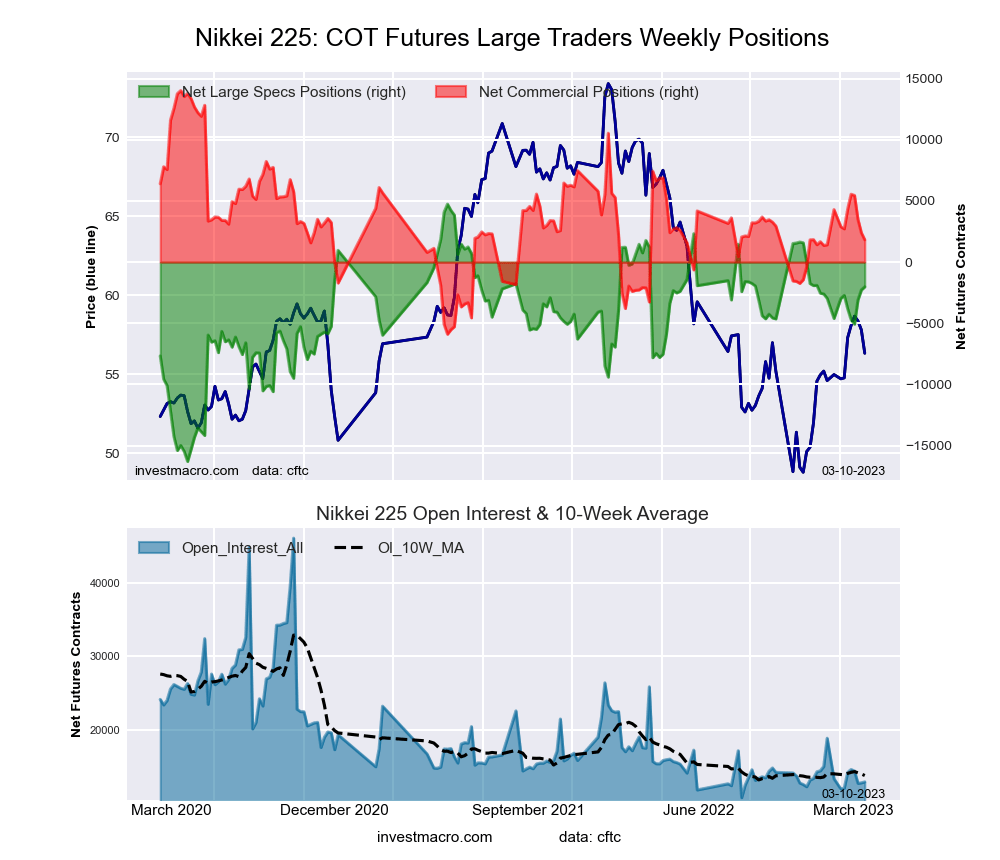
Nikkei Stock Average (USD) Futures COT ChartThe Nikkei Stock Average (USD) large speculator standing the week reached a net position of -2,022 contracts in the data reported through Tuesday February 21st. This was a weekly rise of 260 contracts from the previous week which had a total of -2,282 net contracts.

The week’s current strength score (the trader positioning range over the past three years, measured from 0 to 100) shows the speculators are currently Bullish with a score of 67.9 percent. The commercials are Bearish with a score of 38.8 percent and the small traders (not shown in chart) are Bearish with a score of 30.8 percent.

Nikkei Stock Average Futures StatisticsSPECULATORSCOMMERCIALSSMALL TRADERS
– Percent of Open Interest Longs:25.149.025.9
– Percent of Open Interest Shorts:40.834.824.4
– Net Position:-2,0221,824198
– Gross Longs:3,2256,2963,328
– Gross Shorts:5,2474,4723,130
– Long to Short Ratio:0.6 to 11.4 to 11.1 to 1
NET POSITION TREND:
– Strength Index Score (3 Year Range Pct):67.938.830.8
– Strength Index Reading (3 Year Range):BullishBearishBearish
NET POSITION MOVEMENT INDEX:
– 6-Week Change in Strength Index:3.3-4.52.5


MSCI EAFE Mini Futures:

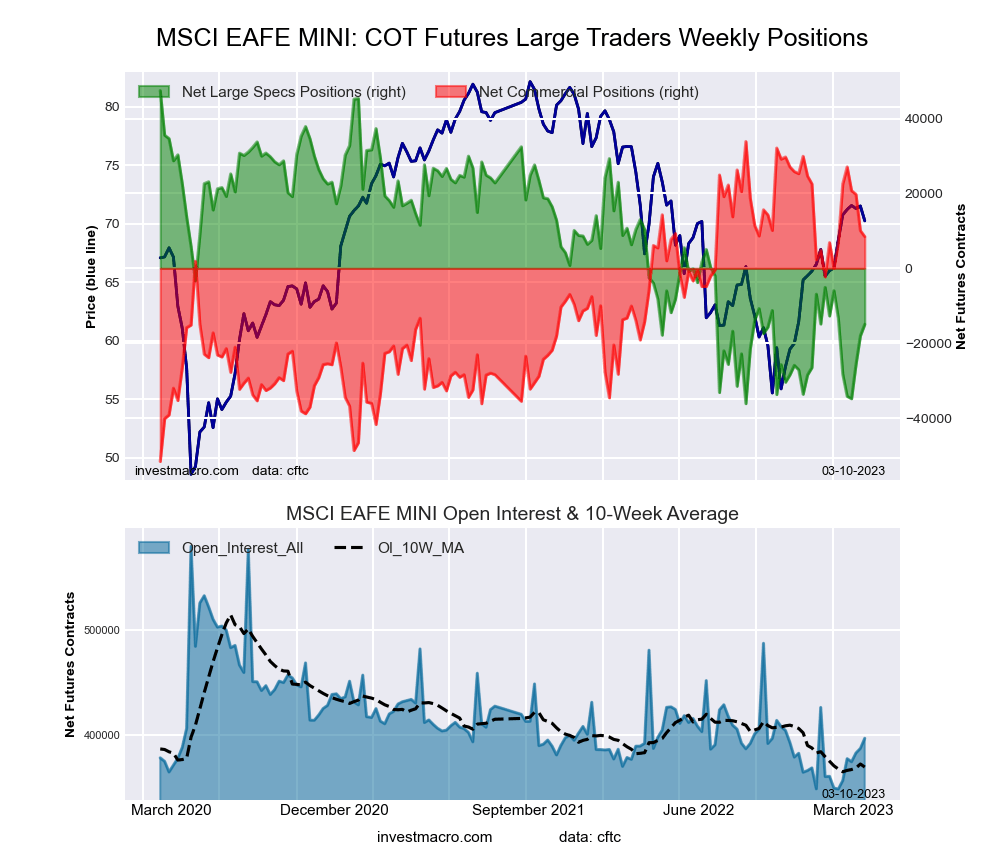
MSCI EAFE Mini Futures COT ChartThe MSCI EAFE Mini large speculator standing the week reached a net position of -14,968 contracts in the data reported through Tuesday February 21st. This was a weekly gain of 3,092 contracts from the previous week which had a total of -18,060 net contracts.

The week’s current strength score (the trader positioning range over the past three years, measured from 0 to 100) shows the speculators are currently Bearish with a score of 26.0 percent. The commercials are Bullish with a score of 69.2 percent and the small traders (not shown in chart) are Bullish with a score of 56.7 percent.

MSCI EAFE Mini Futures StatisticsSPECULATORSCOMMERCIALSSMALL TRADERS
– Percent of Open Interest Longs:8.188.33.1
– Percent of Open Interest Shorts:11.986.21.5
– Net Position:-14,9688,4606,508
– Gross Longs:32,258350,49612,286
– Gross Shorts:47,226342,0365,778
– Long to Short Ratio:0.7 to 11.0 to 12.1 to 1
NET POSITION TREND:
– Strength Index Score (3 Year Range Pct):26.069.256.7
– Strength Index Reading (3 Year Range):BearishBullishBullish
NET POSITION MOVEMENT INDEX:
– 6-Week Change in Strength Index:-1.91.80.4


Article By InvestMacroReceive our weekly COT Newsletter

*COT Report: The COT data, released weekly to the public each Friday, is updated through the most recent Tuesday (data is 3 days old) and shows a quick view of how large speculators or non-commercials (for-profit traders) were positioned in the futures markets.

The CFTC categorizes trader positions according to commercial hedgers (traders who use futures contracts for hedging as part of the business), non-commercials (large traders who speculate to realize trading profits) and nonreportable traders (usually small traders/speculators) as well as their open interest (contracts open in the market at time of reporting). See CFTC criteria here.

S&P 500 Bears To Continue Their Reign?

By ForexTime

The past few days have been rough for the S&P 500.

It has weakened roughly 1.3% since the start of the week thanks to renewed expectations around the Federal Reserve keeping interest rates higher for longer. The main culprit behind this development was none other than Federal Reserve Chair Jerome Powell who struck a hawkish tone in congressional testimony on Tuesday. According to Powell, interest rates will likely peak at a higher level than previously expected thanks to stronger-than-expected economic data. His aggressive message rate hikes boosted the dollar and rattled equity markets as a 50-bp hike in March was back on the table.

According to Bloomberg, traders are currently pricing in a 68% probability of a 50-basis point rate hike this month.

As the week slowly comes to an end, the S&P 500 is still struggling to nurse the deep wounds inflicted from Tuesday’s selloff with prices trading below the 4000 level. The index is likely to remain shaky as investors remain on the sidelines ahead of the US jobs report on Friday.

In the meantime, bears seem to be gaining momentum on the daily charts with prices trading below the 50-day Simple Moving Average.

However, some support can be found around 3950 – a level entangled between the 100 and 200-day SMA.

On the data front, it may be wise to keep an eye on the US weekly jobless claims published later today. If the official results exceed the forecasted 195,000 figure, that could provide some breathing room for the S&P 500 to fight back ahead of the NFP main course tomorrow. On the political front, US President Biden’s budget request to Congress could trigger some volatility depending on how events play out.

The main risk event and market shaker will be the NFP report on Friday which could determine whether S&P 500 bears continue their reign.

After the blockbuster 517,000 figures back in January, around 225, 000 is projected in February. A number below market expectations could excite equity bulls and cool expectations around the Federal Reserve hiking interest rates by 50-bp this month. Alternatively, a strong report is likely to reinforce rate hike bets – ultimately weighing on the equity space. 

Shifting the fundamentals aside, the technicals remain in favour of bears as prices remain in a descending channel.

The SPX500m on the D1 time frame was in an uptrend until a last higher top formed at 4197.1 on 2 February. The bears saw an opportunity and started gathering in numbers.

After the higher top at 4197.1, the price broke through a weekly support then turned resistance level. The momentum change was confirmed by a break of the 15 & 34 Simple Moving Averages as well as the Momentum Oscillator that crashed through the 100 baselines into bearish territory.

A possible critical support level formed when the price reached a weekly support level and a lower bottom was recorded on 2 March at 3921.0. The bulls drove the price higher but their momentum waivered and a lower top formed on 6 March at 4079.6.

If the SPX500 breaks through the critical support level at 3921.0, then three possible price targets can be reached from there. Attaching the Fibonacci tool to the lower bottom near the weekly support level at 3921.0 and dragging it to the resistance level at 4079.6, the following targets can be calculated. The first target may be estimated at 3823.0 (161.8%). The second price target might be expected at 3664.4 (261.8%) if the bears manage to break through another weekly support level. The third and final target might be estimated at 3407.8 (423.6%), which is beyond yet another weekly support level.

If the resistance level at 4079.6 is broken, the current situation must be re-examined.

As long as the bears maintain their overall momentum, the outlook for the SP 500 should remain bearish.


Forex-Time-LogoArticle by ForexTime

ForexTime Ltd (FXTM) is an award winning international online forex broker regulated by CySEC 185/12 www.forextime.com

NQ100m close to forming “golden cross”. What’s next?

By ForexTime

But such a bullish technical signal may be well and truly lost amid the onslaught of macro events that are set to dictate how global financial markets fare the rest of this month.


What is a “golden cross”?

A golden cross is when the asset’s 50-day simple moving average (SMA) crosses above its 200-day SMA.

Such an event indicates that this asset’s prices have been climbing of late, enough to be higher than its longer-term average.

At the time of writing, the gap between those two widely-followed technical indicators now stand at less than 10 points on the NQ100m.

When it happens, the “golden cross” typically sends a “bullish” signal to traders, suggesting there could be more gains in store.

NOTE: The NQ100m is based on the benchmark Nasdaq 100 index, which tracks the overall performance of US tech stocks such as Apple, Amazon, and Alphabet.


How has NQ100m performed after forming a “golden cross” on the daily charts?

Here’s a look back at the previous two episodes:

  • 22 May 2020: NQ100m went on to climb by 76.2% (after “golden cross”) to post its highest-ever close on December 27, 2021 – the current record high.
  • 2 April 2019: NQ100m rose by 29.6% on its way to a pre-pandemic high in February 2020, before lockdowns worldwide and the fear factor that coursed through global financial markets then sent the NQ100m plummeting below its 200-day SMA.

In both instances, after a “golden cross” on the daily charts, the NQ100m then duly surged to fresh record highs!

What’s next after a “golden cross”?

If such a bullish technical event does happen for the NQ100m, equity bulls (those hoping stocks will move higher) will be looking to eventually revisit this past Monday’s (March 6th, 2023) intraday high of 12471.4.


However, it’s different this time (or so goes the market cliché)!

From a macro fundamental perspective, the Nasdaq 100 finds itself in a completely market environment compared to the situation surrounding prior “golden crosses” back in 2019 and 2020.

And here’s the biggest difference:

The US Federal Reserve (central bank) has been aggressively raising interest rates since 2022 in order to try and cool down inflation that’s raging at its highest levels in decades!

The ongoing Fed rate hikes are in stark contrast to the:

  • April 2019 episode: prior Fed rate hikes coming into 2019 had resulted in US rates peaking at 2.5% (only about half of today’s rates of 4.75%) and the Fed would eventually start cutting interest rates later that year.
  • May 2020: US interest rates were at a record low of near 0%, to help cushion the economic impact from Covid-19.


Recall that, tech stocks generally do not like the prospects of interest rates moving higher.

This is because:

  1. Higher interest rates translate into higher repayments on loans.
  2. And many tech companies rely on borrowed money to grow. And they’ve enjoyed plenty of cheap (near-zero interest rates) money over the past decade.
  3. Hence, with more money now needed to repay borrowings, that’s less money that the company can use to grow its business, or to be kept as profits.
  4. Shareholders and investors would rather see those profits sooner rather than later. Hence, they are less willing to buy stocks in tech companies while US interest rates move higher.

    Result = the Nasdaq 100 is still about 26% lower from its all-time high posted back in November 2021.

Hence, as stated at the top of this article, be mindful that any bullish technical signals emanating from any immediate “golden cross” may be lost amidst the incoming macro events.


What could move the NQ100m this month?

  • March 10th: US nonfarm payrolls (NFP) report a.k.a. jobs data
  • March 14th: US consumer price index (CPI) a.k.a. inflation data
  • March 22nd: Fed rate decision


If markets are shown higher-than-expected readings for the US jobs/inflation data in the days ahead, and/or if the Fed triggers a larger-than-25 basis point hike later this month …

such events should drag the Nasdaq 100 lower as market fears are revived that US interest rates will have to move even higher beyond current forecasts of 5.6%.


In the above scenario, expect NQ100m bears (those hoping prices will fall) to test support around the 11,923 mark.

This is a significant support region, because:

  • That’s where we find the 23.6% Fibonacci level from its November 2021-October 2022 drop
  • This is also around where the 200-day and 50-day SMAs are converging.

This confluence of technical indicators could form a strong support region for the NQ100m, barring an utter capitulation in risk sentiment.


Ultimately, global financial markets (including the NQ100m) are set to remain primarily driven by the shifting expectations surrounding how high the Fed will have to eventually send US interest rates.

Markets can only have greater confidence about the next bull run for the NQ100m once traders and investors can get used to the eventual peak for US interest rates, with hopes that the Fed can also start thinking about lowering rates once more.

Until then, the fear of even-higher US interest rates is likely to limit gains for the NQ100m.


READ MORE: (26 January 2023) SP500m close to forming “golden cross”. What’s next?

(After forming a “golden cross” the SP500m went on to hit all upside levels cited in the article.)

Forex-Time-LogoArticle by ForexTime

ForexTime Ltd (FXTM) is an award winning international online forex broker regulated by CySEC 185/12 www.forextime.com

Eli Lilly is cutting insulin prices and capping copays at $35 – 5 questions answered

By Dana Goldman, University of Southern California and Karen Van Nuys, University of Southern California 

Pharmaceutical giant Eli Lilly is slashing the list prices for some of its most popular insulin products by 70% and capping insulin copays at US$35 for uninsured patients and those with private health insurance. These changes follow efforts by the federal government, the California state government, nonprofits and some companies to make insulin more affordable for the more than 7 million Americans with diabetes who require it.

The Conversation asked Dana Goldman and Karen Van Nuys, two scholars who have researched insulin pricing, to explain why Eli Lilly is dramatically cutting the cost of some of its insulin products and to sum up how it may improve access to this essential medical treatment.

1. Why is Lilly reducing prices now?

High insulin prices have not earned any U.S. manufacturer many friends, with list prices increasing 54% from 2014 to 2019.

Most troublingly, an estimated 1.3 million uninsured people with diabetes and patients with inadequate insurance have resorted to rationing their insulin. Skipping doses because of high insulin prices has sometimes had tragic and even deadly consequences.

But growing competition has shaken up the insulin market in recent years.

For example, Walmart introduced its own private-brand insulin in 2021. Mylan, a large generic drugmaker, developed a version of long-acting insulin called Semglee, priced 65% lower than its branded competitor. But few consumers use those products.

Efforts to produce cheaper insulin by the nonprofit drugmaker CivicaRx and the state of California are several years out and won’t provide immediate relief.

Then there’s the Inflation Reduction Act, a big spending package Congress approved in 2022. It capped insulin out-of-pocket costs at $35 for Americans with Medicare, a government health insurance program that covers people over 65.

And, in fact, Lilly itself has been trying to disrupt insulin prices. In 2019, the drugmaker introduced insulin lispro, a lower-cost version of its blockbuster insulin, Humalog.

2. What does this mean for Americans who need insulin?

Part of the problem with the existing system is that some patients, especially if they’re uninsured or have high deductibles, end up paying the list price – which can mean spending $1,000 or more a month on insulin. This can be a crushing financial burden.

Lilly’s new $35 out-of-pocket cap means that privately insured patients and those without insurance requiring insulin will spend no more than that monthly for copays. Its 70% reduction in the list price of two popular name brand insulins, Humalog and Humulin, will bring some financial relief. And the company has also reduced its generic lispro’s list price to $25 a vial, down from $126.

The evidence is clear that these price reductions will improve patient adherence – which means fewer missed doses of this lifesaving medication.

3. How might Lilly’s actions affect the whole industry?

Lilly has put pressure on its biggest competitors, Novo Nordisk and Sanofi, to follow suit.

These lower prices could also make Lilly’s insulins affordable to cash-paying patients. As a result, these insulins could be added to the list of drugs provided by pharmacies that are disrupting the U.S. prescription drug industry, like Mark Cuban’s Cost Plus Drug Co. and Blueberry Pharmacy. These companies provide low-cost drugs with transparent markups or through membership programs, typically without insurance.

4. Why did insulin get so expensive in the US?

That lispro, Lilly’s own, cheaper authorized generic insulin, hasn’t completely displaced the equivalent name brand Humalog in the market by now may seem surprising. But it is the result of the complex U.S. prescription drug distribution system.

Insulin prices are the result of a complex set of negotiations between manufacturers and pharmacy benefit managers, which act on behalf of insurers. The three largest – CVS Caremark, Express Scripts and Optum Rx – handle about 80% of all prescriptions.

These middlemen negotiate directly with Lilly and other insulin manufacturers, focusing on two key sums: the list price and the rebate. Manufacturers are paid the list price but then must pay a rebate to the pharmacy benefit managers.

How do pharmacy benefit managers get manufacturers to pay rebates? They maintain formularies – lists of drugs that patients in a health plan can access. If an insulin manufacturer wants to supply diabetes patients, it needs to remain on those formularies. And doing so requires the manufacturer to pay bigger rebates. Otherwise, pharmacy benefit managers can exclude the manufacturer.

In 2016, OptumRx, which negotiates insulin prices for about 28 million people, excluded only four types of insulin from its formulary. By 2022, OptumRx was excluding 13 insulins.

Keeping insulin on formularies, in short, has required high rebates, and list prices have increased along with them. Ironically, as insulin list prices have been rising, manufacturers have been making less money off of insulin sales, while middlemen have been making more. The key to true price competition is to ensure access to all versions of insulin and to convince patients and providers that people with diabetes can substitute lower-cost versions without compromising their health.

5. What might happen next?

The Federal Trade Commission, a government agency that probes anti-competitive practices, and Congress are now investigating pharmacy benefit managers’ rebate and formulary practices, among other things. These investigations, along with Lilly’s moves, may lead other insulin manufacturers to lower their list prices.

And once its competitors decide whether they will follow Lilly’s example, pharmacy benefit managers will be under a lot of scrutiny to see whether they give preferred formulary placement to the lowest-cost insulin products, or to those that pay the highest rebates.The Conversation

About the Authors:

Dana Goldman, Dean of the Sol Price School of Public Policy; Professor of Pharmacy, Public Policy, and Economics, University of Southern California and Karen Van Nuys, Executive Director of the Value of Life Sciences Innovation program; Fellow at the USC Schaeffer Center, University of Southern California

This article is republished from The Conversation under a Creative Commons license. Read the original article.


Tricky issue of client suitability for ESG investments

By George Prior

As global investors become increasingly focused on environmental, social, and governance (ESG) investments, one of the world’s largest independent financial advisory and asset management organizations is partnering with a pioneering profiling tool to ensure clients’ personal suitability for this kind of investment.

deVere Group says its partnership with EnlightenESG will enable it to better understand clients’ attitudes to ESG investing and to ensure greater transparency around the intersection of suitability and sustainability.

James Green, deVere Group’s Investment Director, says: “Clients are increasingly seeking to align their investments with their values, and support companies that are making a positive impact on society and the environment.

“ESG investing allows clients to invest in entities that are helping the world transition to a fairer, more diverse and sustainable future, while also generating the appropriate financial returns.

He continues: “ESG investing can be a suitable investment strategy for many investors, but it may not be appropriate for all.

“Whether or not ESG-orientated investments are suitable for a particular client will depend not only on their individual investment goals, risk tolerance, and financial situation, but also on their core values.

“And with something so emotive and fundamental to all our lives, it can be easy to get caught up in the debate or drowned in a tidal wave of opinions and, as consequence, lose sight of what sustainability really means to our clients.”

EnlightenESG, a groundbreaking profiling tool, addresses this issue by personalizing the sustainable investment requirements that help investors and their advisors make informed sustainability decisions in the context of suitability.

“EnlightenESG will help us to engage our clients and to truly understand their sustainable preferences and in time ultimately better match their ESG views to their investment goals,” explains James Green.

Thanks to deVere Group’s resources, scale and global presence, it hopes to become a key actor in terms of education around sustainable investing.

Before using the tool with clients, deVere trialled it in-house to engage with the technology themselves to understand the process, the data it provides, and what it could potentially teach the firm on how it could help its global client base.

As part of onboarding EnlightenESG into the firm’s relationships with clients, deVere Western Europe profiled over 75 employees across its European offices and engaged with EnlightenESG to help interpret and understand the results.

The Group analysed individuals’ attitudes toward sustainability and ESG as well as how the Group scored as whole and in the context of the entire EnlightenESG ecosystem.

“We noted our staff are more focused on ESG than the EnlightenESG index average, the data also highlighted our understanding of the long-term nature of ESG investing,” comments the deVere Group Investment Director.

“As is often the case with new and evolving investment opportunities, the market can over-estimate the short term and underestimate the long-term opportunities.  Our EnlightenESG results demonstrate that we have a good understanding and education around these critical points.”

Of the partnership with deVere Group, Simon Lowans Chief Marketing Officer at EnlightenESG says: “We are thrilled with the modern and forward-looking approach that the team at deVere are taking towards sustainability.

“EnlightenESG technology not only documents and allows for a repeatable and consistent process, the technology also loves to learn!  It is the continuous learning within the technology that helps frame and understand the societal norm across the ESG spectrum.

“The continued growth in our EnlightenESG user base is helping the profiler, and as a result our users, to better understand how clients score relative to the universe average or societal norm.   We have always said EnlightenESG can only be built for individuals if the data itself is powered by individuals.”

The EnlightenESG partnership underscores deVere’s ongoing commitment to sustainable investing.

Ahead of COP27, the international climate summit, last November, deVere Group CEO Nigel Green told media:  “Climate change is the greatest risk multiplier to our planet, to our communities, and to our way of life.

“Joined-up planning followed by urgent action is essential.  But this will not only take political and social will. It will take trillions of dollars.

“There needs to be unprecedented levels of cooperation between financial advisories, insurance firms, banks, wealth and asset managers, investment companies, fintech groups, banks, auditors, amongst others, to help unlock and mobilise the trillions of dollars of private finance that is urgently required.”

deVere Group is also one of 18 founding signatories of the UN-backed Net Zero initiative, the international alliance of powerhouse global finance companies that will help accelerate the transition to a net zero financial system.

James Green concludes: “EnlightenESG will become an invaluable tool to determine a client’s sustainability values and helps advisors map clients to a sustainable investment, where appropriate.”

About:

deVere Group is one of the world’s largest independent advisors of specialist global financial solutions to international, local mass affluent, and high-net-worth clients.  It has a network of more than 70 offices across the world, over 80,000 clients and $12bn under advisement.


Communications Co. To Acquire ‘Perfect Fit’

Source: Streetwise Reports  (3/2/23)

Printing and marketing services company Data Communications Management Corp. has entered into a share purchase agreement to acquire R.R. Donnelley & Sons’ Canadian operations.

Printing and marketing services company Data Communications Management Corp. (DCM:TSX; DCMDF:OTCQX) has entered into a share purchase agreement to acquire R.R. Donnelley & Sons’ Canadian operations for CA$123 million, the company said.

R.R. Donnelly Canada provides print and related services to thousands of customers across the country, had a revenue of about CA$250 million in 2022, and has 1,000 employees.

The companies are “a perfect fit,” DCM President and Chief Executive Officer Richard Kellam said after the announcement.

The transaction “combines two companies with complementary operating models and best-in-class products, (and) very strong customer relationships,” he said. “It’s also very complementary to some of the digital-first technology capabilities we’ve built here at DCM, and the opportunity to expand those into RRD’s clients.

Analyst Chris Thompson of eResearch maintained a Buy rating on the stock with a target of CA$4.50 even before the announcement based on third-quarter 2022 results that showed revenue up 11.4% YoY from 2021.

There (are) many meaningful benefits for our clients and for our customers, being bigger and better together and obviously, attractive financial benefits and value creation opportunities for DCM.”

Analyst Chris Thompson of eResearch maintained a Buy rating on the stock with a target of CA$4.50 even before the announcement based on third-quarter 2022 results that showed revenue up 11.4% YoY from 2021.

Preliminary results for 2022 show the company’s revenues up 15% to 16.5% over 2021. The company is expected to release the final 2022 results later this month.

“As DCM executes its ‘digital first’ strategy, we expect revenue from technology-enabled hardware solutions and tech-enabled subscription services and fees to increase,” Thompson wrote.

The tech-enabled marketing and digital asset management (DAM) sectors are forecasted to grow annually by 15% and 21%, respectively, Thompson said. DAM services generated only 1.3% of the company’s revenue in 2020.

But “with the proliferation of video and digital content, the total DAM addressable market is forecasted to reach US$6 billion by 2025, thus there is plenty of upside revenue potential,” Thompson wrote.

The Catalyst: More than CA$500 Million in Annual Sales

The new company would have more than CA$500 million in annual sales from day one, an expanded customer base, and an enhanced product portfolio, DCM said.

DCM is only buying the Canadian operations of RRD, which is a provider of marketing, packaging, print, and supply chain solutions with 25,000 clients worldwide across 29 countries.

“They serve key verticals from financial institutions, retail, insurance, transportation, government, and other regulated industries,” Kellam said.

RRD said it serves “thousands of customers across Canada.”

“Combining our business with DCM is a strategic opportunity to broaden our existing offering to customers across a variety of industries,” RRD President Rael Fisher said.

Under the share purchase agreement, DCM will acquire 100% of the shares of Moore Canada Corp. (RRD Canada) in a transaction expected to close in the second quarter of this year, subject to closing conditions and regulatory approvals.

DCM is financing 100% of the purchase in cash through “fully committed credit facilities from a Canadian Chartered Bank and Fiera Private Debt,” the company said in its news release.

Included in the purchase will be three sites owned by RRD with an implied net value of about CA$30 million. DCM said it intends to enter into a sale and lease-back arrangement for each site.

DCM Had a ‘Very Solid Year’

In its preliminary results for the fiscal year ending Dec. 31, 2022, DCM said total revenue increased to between CA$270 million to CA$274 million, or a jump of 15% to 16.5%, over 2021.

Gross profit as a percentage of revenue increased in a range of 30.5% to 31%, with gross profit increasing between 20% and 21% YoY.

The company plans to release the final results for 2022 and the fourth quarter of that year on March 21.

“We had a very solid year on revenue and revenue acceleration,” Kellam said. It was “one of the best growth years that we’ve delivered on record here in DCM. We’re very proud of the revenue acceleration, and the value we’re bringing to clients in the marketplace.”

DCM launched its DAM cloud solution, ASMBL, to manage corporate media files and other content, in 2021. The company has said the technology has the potential to become a key growth opportunity for DCM as it is deployed to the company’s 2,500 corporate clients.

DCM has been in business for 60 years. It helps companies with branding, communications, and logistics and provides customer loyalty programs, data, and content management, location-specific marketing, labels and asset tracking, multimedia campaign management, and workflow management. Its clients are in many industries, including financial services, health care, emerging markets, retail, non-profits, energy, hospitality, and transportation.

Ownership and Share Structure

Streetwise Ownership Overview*

Retail: 55%
Management/Insiders: 45%
55%
45%
*Share Structure as of 3/2/2023


Management and insiders own about 45% of DCM, including a share program that gives employees close to 4% ownership.

Top insider shareholders include Director Michael Sifton with 10.2% or 4.5 million shares, Board Vice Chairman Greg Cochrane with 7.43% or 3.28 million shares, Chairman of the Board J.R. Kingsley Ward with 5.54% or 2.44 million shares, and the CEO Kellam with 1.66% or 0.73 million shares, according to Reuters.

According to the company, the rest, 55%, is retail. Reuters lists KST Industries Inc. as the top shareholder in the company overall with 11.69% or 5.15 million shares.

The company is covered by Noel Atkinson of Clarus Securities and Chris Thompson of eResearch. Newsletter writer Clive Maund also covers the stock.

It has a market cap of CA$82.84 million with 44 million shares outstanding, with 27.3 million shares free-floating. It trades in the 52-week range of CA$1.97 and CA$1.01.


Disclosures:

1) Steve Sobek wrote this article for Streetwise Reports LLC. He or members of his household own securities of the following companies mentioned in the article: None. He or members of his household are paid by the following companies mentioned in this article: None.

2) The following companies mentioned in this article are billboard sponsors of Streetwise Reports: Data Communications Management Corp. Click here for important disclosures about sponsor fees. The information provided above is for informational purposes only and is not a recommendation to buy or sell any security.

3) Statements and opinions expressed are the opinions of the author and not of Streetwise Reports or its officers. The author is wholly responsible for the validity of the statements. The author was not paid by Streetwise Reports for this article. Streetwise Reports was not paid by the author to publish or syndicate this article. Streetwise Reports requires contributing authors to disclose any shareholdings in or economic relationships with, companies that they write about. Streetwise Reports relies upon the authors to accurately provide this information and Streetwise Reports has no means of verifying its accuracy.

4) This article does not constitute investment advice. Each reader is encouraged to consult with his or her individual financial professional and any action a reader takes as a result of information presented here is his or her own responsibility. By opening this page, each reader accepts and agrees to Streetwise Reports’ terms of use and full legal disclaimer. This article is not a solicitation for investment. Streetwise Reports does not render general or specific investment advice and the information on Streetwise Reports should not be considered a recommendation to buy or sell any security. Streetwise Reports does not endorse or recommend the business, products, services or securities of any company mentioned on Streetwise Reports.

5) From time to time, Streetwise Reports LLC and its directors, officers, employees or members of their families, as well as persons interviewed for articles and interviews on the site, may have a long or short position in securities mentioned. Directors, officers, employees or members of their immediate families are prohibited from making purchases and/or sales of those securities in the open market or otherwise from the time of the decision to publish an article until three business days after the publication of the article. The foregoing prohibition does not apply to articles that in substance only restate previously published company releases.

eResearch Disclosures:

eResearch was established in 2000 as Canada’s first equity issuer-sponsored research organization. As a primary source for professional investment research, our Subscribers benefit by having written research on a variety of under-covered companies. We also provide unsponsored research reports on middle and larger-cap companies, using a combination of fundamental and technical analysis. We complement our corporate research coverage with a diversified selection of informative research publications from a wide variety of investment professionals. We provide our professional investment research and analysis directly to our extensive subscriber network of discerning investors, and electronically through our website: www.eresearch.com

NOTE: eResearch company reports are available FREE on our website: www.eresearch.com

eResearch Intellectual Property: No representations, express or implied, are made by eResearch as to the accuracy, completeness, or correctness of the comments made in this report. This report is not an offer to sell or a solicitation to buy any security of the Company. Neither eResearch nor any person employed by eResearch accepts any liability whatsoever for any direct or indirect loss resulting from any use of this report or the information it contains. This report may not be reproduced, distributed, or published without the express permission of eResearch.

ANALYST ACCREDITATION

eResearch Analyst on this Report: Chris Thompson CFA, MBA, P.Eng.

Analyst Affirmation: I, Chris Thompson, hereby state that, at the time of issuance of this research report, I do not own common shares, share options, or share warrants of DATA Communications Management Corp. (TSX:DCM).

eRESEARCH DISCLOSURE STATEMENT

eResearch is engaged solely in the provision of equity research to the investment community. eResearch provides published research and analysis to its Subscribers on its website (www.eresearch.com), and to the general investing public through its extensive electronic distribution network and newswire agencies. eResearch makes all reasonable efforts to distribute research material simultaneously to all of its Subscribers.

eResearch does not manage money or trade with the general public, provides full disclosure of all fee arrangements, and adheres to the strict application of its Best Practices Guidelines. eResearch accepts fees from the companies it researches (the “Covered Companies”), and from financial institutions or other third parties. The purpose of this policy is to defray the cost of researching small and medium-capitalization stocks which otherwise receive little or no research coverage.

DATA Communications Management Corp. paid eResearch a fee to have it conduct research and publish reports on the Company for one year.

To ensure complete independence and editorial control over its research, eResearch follows certain business practices and compliance procedures. For instance, fees from Covered Companies are due and payable before research starts. Management of the Covered Companies is sent copies, in draft form without a Recommendation or a Target Price, of the Initiating Report and the Update Report before publication to ensure our facts are correct, that we have not misrepresented anything, and have not included any non-public, confidential information. At no time is management entitled to comment on issues of judgment, including Analyst opinions, viewpoints, or recommendations. All research reports must be approved, before publication, by eResearch’s Director of Research, who is a Chartered Financial Analyst (CFA).

All Analysts are required to sign a contract with eResearch before engagement and agree to adhere at all times to the CFA Institute Code of Ethics and Standards of Professional Conduct. eResearch Analysts are compensated on a per-report, per-company basis and not based on his/her recommendations. Analysts are not allowed to accept any fees or other considerations from the companies they cover for eResearch.

Officers, analysts, and directors of eResearch are allowed to trade in shares, warrants, convertible securities, or options of any of the Covered Companies only under strict, specified conditions, which restrict trading 30 days before and after a Research Report is published.

5 sectors to benefit from China NPC summit as Xi tightens grip

By George Prior

Investors around the world will be closely following China’s National People’s Congress (NPC), which kicks off this weekend, for signals about which sectors are likely to benefit from President Xi’s latest political and economic developments.

The NPC is one of the most important political events in the world’s second-largest economy. It is the annual meeting of the highest organ of state power and the country’s top legislative body.

Nigel Green, CEO and founder of deVere Group, one of the world’s largest independent financial advisory, asset management and fintech organizations, says: “Investors always closely watch the NPC for any indicators about changes in economic policies that could impact financial markets and business in China – but this year’s event is more critical.

“This is the first NPC since China has moved away from its zero-Covid policy to combat the pandemic. It also comes as Xi tightens his grip on power.”

“Global investors will be looking for signals on China’s policy priorities and goals, and potential opportunities and risks.”

He believes that there are likely to be five sectors that could benefit from the latest policy agenda to be set out this weekend.

First, tech. “China’s focus on innovation and tech has been a major theme in previous NPC events. Beijing has committed to increasing investment in areas such as artificial intelligence, semiconductors, and 5G.

“Domestic and foreign companies involved in these sectors could receive increased government support,” affirms Nigel Green.

Second, infrastructure. “The NPC typically includes rhetoric about infrastructure investment, including plans for new roads, railways, amongst other public works projects.”

Third, healthcare. The deVere Group CEO notes that “China’s aging population has led to increased demand for healthcare services, and the government has made improving healthcare a priority, including further investment in areas such as medical research, new hospitals and pharmaceuticals.”

Fourth, renewable energy. “Beijing has set ambitious targets for slashing greenhouse gas emissions, and the NPC often includes highlights on how it aims to achieve these targets.”

Fifth, consumer goods. Nigel Green says: “As China’s middle class continues to grow, there’s increasing demand for quality consumer goods. Entities involved in areas such as retail, luxury goods, and e-commerce will benefit from increased consumer spending.”

Last week, President Xi encouraged bankers in China to ‘clean up’ their western lifestyles and be less ‘hedonistic.’

“This reflects his wider aim to promote traditional Chinese values, tackle corruption, and maintain social stability and a more modest way of life,” says the deVere CEO.

“The importance of this event for global investors, which will shape the world’s second-largest economy, cannot be overestimated,” he concludes.

About:

deVere Group is one of the world’s largest independent advisors of specialist global financial solutions to international, local mass affluent, and high-net-worth clients.  It has a network of more than 70 offices across the world, over 80,000 clients and $12bn under advisement.

COT Stocks: January 31st data shows Nasdaq-Mini and Russell-Mini led Speculator bets

By InvestMacro

Here are the latest charts and statistics for the Commitment of Traders (COT) data published by the Commodities Futures Trading Commission (CFTC).

The latest COT data is updated through Tuesday January 31st and shows a quick view of how large traders (for-profit speculators and commercial entities) were positioned in the futures markets.

*** This data is almost a month old because the CFTC up-to-date data has been delayed due to a cybersecurity event that happened in early February to ION Cleared Derivatives (a subsidiary of ION Markets). This hack of ION has created a problem for the large trader positions to be reported and reconciled. The CFTC states that they will be back-filling the data over the next couple weeks and will get the data back up to date.

Weekly Speculator Changes led by Nasdaq-Mini

The COT stock markets speculator bets were mixed as four out of the eight stock markets we cover had higher positioning while the other four markets had lower speculator contracts.

Leading the gains for the stock markets was the Nasdaq-Mini (9,403 contracts) with the Russell-Mini (4,377 contracts), Nikkei 225 Yen (2,632 contracts) and DowJones-Mini (538 contracts) also showing positive weeks.

The markets with the declines in speculator bets for the week were the S&P500-Mini (-13,266 contracts) and VIX (-13,769 contracts) with the MSCI EAFE-Mini (-638 contracts) and the Nikkei 225 (-360 contracts) also registering lower bets on the week.


Data Snapshot of Stock Market Traders | Columns Legend
Jan-31-2023OIOI-IndexSpec-NetSpec-IndexCom-NetCOM-IndexSmalls-NetSmalls-Index
S&P500-Mini2,061,4194-222,25715234,78682-12,52924
Nikkei 22514,33010-5,072535,45257-38024
Nasdaq-Mini278,44959-15,8586632,05346-16,19521
DowJones-Mini80,38643-9,4283312,07771-2,64927
VIX310,47542-66,9186669,70732-2,78978
Nikkei 225 Yen36,496139,11262-4,2010-4,91170


Strength Scores led by Nasdaq-Mini & VIX

COT Strength Scores (a normalized measure of Speculator positions over a 3-Year range, from 0 to 100 where above 80 is Extreme-Bullish and below 20 is Extreme-Bearish) showed that the Nasdaq-Mini (66 percent) and the VIX (66 percent) led the stock markets. The Nikkei 225 Yen (62 percent) and Nikkei 225 (53 percent) come in as the next highest in the weekly strength scores.

On the downside, the MSCI EAFE-Mini (2 percent) and the S&P500-Mini (15 percent) come in at the lowest strength level currently and were in Extreme-Bearish territory (below 20 percent).

Strength Statistics:
VIX (66.5 percent) vs VIX previous week (76.0 percent)
S&P500-Mini (15.0 percent) vs S&P500-Mini previous week (17.5 percent)
DowJones-Mini (33.4 percent) vs DowJones-Mini previous week (32.4 percent)
Nasdaq-Mini (66.2 percent) vs Nasdaq-Mini previous week (60.9 percent)
Russell2000-Mini (33.9 percent) vs Russell2000-Mini previous week (31.3 percent)
Nikkei USD (53.4 percent) vs Nikkei USD previous week (55.1 percent)
EAFE-Mini (1.6 percent) vs EAFE-Mini previous week (2.4 percent)


VIX led the 6-Week Strength Trends

COT Strength Score Trends (or move index, calculates the 6-week changes in strength scores) showed that just about all the markets had lower trend scores. The VIX was the only market with a score above 0 at a 0.2 percent trend score. The EAFE-Mini (-36.5 percent) had the lowest or most negative score that week followed by the S&P500-Mini (-11.6 percent).

Strength Trend Statistics:
VIX (0.2 percent) vs VIX previous week (20.6 percent)
S&P500-Mini (-11.6 percent) vs S&P500-Mini previous week (3.9 percent)
DowJones-Mini (-5.2 percent) vs DowJones-Mini previous week (4.4 percent)
Nasdaq-Mini (-11.4 percent) vs Nasdaq-Mini previous week (-24.8 percent)
Russell2000-Mini (-2.4 percent) vs Russell2000-Mini previous week (-2.2 percent)
Nikkei USD (-10.0 percent) vs Nikkei USD previous week (-10.0 percent)
EAFE-Mini (-36.5 percent) vs EAFE-Mini previous week (-23.7 percent)


Individual Stock Market Charts:

VIX Volatility Futures:

VIX Volatility Futures COT ChartThe VIX Volatility large speculator standing for the week totaled a net position of -66,918 contracts in the data reported through January 31st. This was a weekly lowering of -13,769 contracts from the previous week which had a total of -53,149 net contracts.

This week’s current strength score (the trader positioning range over the past three years, measured from 0 to 100) shows the speculators are currently Bullish with a score of 66.5 percent. The commercials are Bearish with a score of 31.5 percent and the small traders (not shown in chart) are Bullish with a score of 77.7 percent.

VIX Volatility Futures StatisticsSPECULATORSCOMMERCIALSSMALL TRADERS
– Percent of Open Interest Longs:17.057.77.9
– Percent of Open Interest Shorts:38.635.28.8
– Net Position:-66,91869,707-2,789
– Gross Longs:52,935178,99824,430
– Gross Shorts:119,853109,29127,219
– Long to Short Ratio:0.4 to 11.6 to 10.9 to 1
NET POSITION TREND:
– Strength Index Score (3 Year Range Pct):66.531.577.7
– Strength Index Reading (3 Year Range):BullishBearishBullish
NET POSITION MOVEMENT INDEX:
– 6-Week Change in Strength Index:0.2-6.546.0


S&P500 Mini Futures:

SP500 Mini Futures COT ChartThe S&P500 Mini large speculator standing for the week totaled a net position of -222,257 contracts in the data reported through January 31st. This was a weekly fall of -13,266 contracts from the previous week which had a total of -208,991 net contracts.

This week’s current strength score (the trader positioning range over the past three years, measured from 0 to 100) shows the speculators are currently Bearish-Extreme with a score of 15.0 percent. The commercials are Bullish-Extreme with a score of 81.6 percent and the small traders (not shown in chart) are Bearish with a score of 23.7 percent.

S&P500 Mini Futures StatisticsSPECULATORSCOMMERCIALSSMALL TRADERS
– Percent of Open Interest Longs:12.373.711.9
– Percent of Open Interest Shorts:23.162.312.5
– Net Position:-222,257234,786-12,529
– Gross Longs:253,4391,519,069245,628
– Gross Shorts:475,6961,284,283258,157
– Long to Short Ratio:0.5 to 11.2 to 11.0 to 1
NET POSITION TREND:
– Strength Index Score (3 Year Range Pct):15.081.623.7
– Strength Index Reading (3 Year Range):Bearish-ExtremeBullish-ExtremeBearish
NET POSITION MOVEMENT INDEX:
– 6-Week Change in Strength Index:-11.610.0-2.4


Dow Jones Mini Futures:

Dow Jones Mini Futures COT ChartThe Dow Jones Mini large speculator standing for the week totaled a net position of -9,428 contracts in the data reported through January 31st. This was a weekly advance of 538 contracts from the previous week which had a total of -9,966 net contracts.

This week’s current strength score (the trader positioning range over the past three years, measured from 0 to 100) shows the speculators are currently Bearish with a score of 33.4 percent. The commercials are Bullish with a score of 71.1 percent and the small traders (not shown in chart) are Bearish with a score of 27.2 percent.

Dow Jones Mini Futures StatisticsSPECULATORSCOMMERCIALSSMALL TRADERS
– Percent of Open Interest Longs:26.552.116.9
– Percent of Open Interest Shorts:38.337.120.1
– Net Position:-9,42812,077-2,649
– Gross Longs:21,33941,87413,546
– Gross Shorts:30,76729,79716,195
– Long to Short Ratio:0.7 to 11.4 to 10.8 to 1
NET POSITION TREND:
– Strength Index Score (3 Year Range Pct):33.471.127.2
– Strength Index Reading (3 Year Range):BearishBullishBearish
NET POSITION MOVEMENT INDEX:
– 6-Week Change in Strength Index:-5.22.76.6


Nasdaq Mini Futures:

Nasdaq Mini Futures COT ChartThe Nasdaq Mini large speculator standing for the week totaled a net position of -15,858 contracts in the data reported through January 31st. This was a weekly boost of 9,403 contracts from the previous week which had a total of -25,261 net contracts.

This week’s current strength score (the trader positioning range over the past three years, measured from 0 to 100) shows the speculators are currently Bullish with a score of 66.2 percent. The commercials are Bearish with a score of 46.2 percent and the small traders (not shown in chart) are Bearish with a score of 21.3 percent.

Nasdaq Mini Futures StatisticsSPECULATORSCOMMERCIALSSMALL TRADERS
– Percent of Open Interest Longs:21.365.811.1
– Percent of Open Interest Shorts:27.054.216.9
– Net Position:-15,85832,053-16,195
– Gross Longs:59,439183,09830,935
– Gross Shorts:75,297151,04547,130
– Long to Short Ratio:0.8 to 11.2 to 10.7 to 1
NET POSITION TREND:
– Strength Index Score (3 Year Range Pct):66.246.221.3
– Strength Index Reading (3 Year Range):BullishBearishBearish
NET POSITION MOVEMENT INDEX:
– 6-Week Change in Strength Index:-11.420.5-24.8


Russell 2000 Mini Futures:

Russell 2000 Mini Futures COT ChartThe Russell 2000 Mini large speculator standing for the week totaled a net position of -63,024 contracts in the data reported through January 31st. This was a weekly gain of 4,377 contracts from the previous week which had a total of -67,401 net contracts.

This week’s current strength score (the trader positioning range over the past three years, measured from 0 to 100) shows the speculators are currently Bearish with a score of 33.9 percent. The commercials are Bullish with a score of 62.7 percent and the small traders (not shown in chart) are Bearish with a score of 44.8 percent.

Russell 2000 Mini Futures StatisticsSPECULATORSCOMMERCIALSSMALL TRADERS
– Percent of Open Interest Longs:9.982.75.9
– Percent of Open Interest Shorts:24.569.44.6
– Net Position:-63,02457,1435,881
– Gross Longs:42,702356,14325,493
– Gross Shorts:105,726299,00019,612
– Long to Short Ratio:0.4 to 11.2 to 11.3 to 1
NET POSITION TREND:
– Strength Index Score (3 Year Range Pct):33.962.744.8
– Strength Index Reading (3 Year Range):BearishBullishBearish
NET POSITION MOVEMENT INDEX:
– 6-Week Change in Strength Index:-2.40.112.4


Nikkei Stock Average (USD) Futures:

Nikkei Stock Average (USD) Futures COT ChartThe Nikkei Stock Average (USD) large speculator standing for the week totaled a net position of -5,072 contracts in the data reported through January 31st. This was a weekly fall of -360 contracts from the previous week which had a total of -4,712 net contracts.

This week’s current strength score (the trader positioning range over the past three years, measured from 0 to 100) shows the speculators are currently Bullish with a score of 53.4 percent. The commercials are Bullish with a score of 57.0 percent and the small traders (not shown in chart) are Bearish with a score of 23.6 percent.

Nikkei Stock Average Futures StatisticsSPECULATORSCOMMERCIALSSMALL TRADERS
– Percent of Open Interest Longs:15.865.918.3
– Percent of Open Interest Shorts:51.227.820.9
– Net Position:-5,0725,452-380
– Gross Longs:2,2699,4402,621
– Gross Shorts:7,3413,9883,001
– Long to Short Ratio:0.3 to 12.4 to 10.9 to 1
NET POSITION TREND:
– Strength Index Score (3 Year Range Pct):53.457.023.6
– Strength Index Reading (3 Year Range):BullishBullishBearish
NET POSITION MOVEMENT INDEX:
– 6-Week Change in Strength Index:-10.020.2-24.2


MSCI EAFE Mini Futures:

MSCI EAFE Mini Futures COT ChartThe MSCI EAFE Mini large speculator standing for the week totaled a net position of -34,840 contracts in the data reported. This was a weekly lowering of -638 contracts from the previous week which had a total of -34,202 net contracts.

This week’s current strength score (the trader positioning range over the past three years, measured from 0 to 100) shows the speculators are currently Bearish-Extreme with a score of 1.6 percent. The commercials are Bullish-Extreme with a score of 84.1 percent and the small traders (not shown in chart) are Bullish-Extreme with a score of 100.0 percent.

MSCI EAFE Mini Futures StatisticsSPECULATORSCOMMERCIALSSMALL TRADERS
– Percent of Open Interest Longs:6.587.55.1
– Percent of Open Interest Shorts:15.882.01.3
– Net Position:-34,84020,73414,106
– Gross Longs:24,465327,87118,967
– Gross Shorts:59,305307,1374,861
– Long to Short Ratio:0.4 to 11.1 to 13.9 to 1
NET POSITION TREND:
– Strength Index Score (3 Year Range Pct):1.684.1100.0
– Strength Index Reading (3 Year Range):Bearish-ExtremeBullish-ExtremeBullish-Extreme
NET POSITION MOVEMENT INDEX:
– 6-Week Change in Strength Index:-36.527.938.4


Article By InvestMacroReceive our weekly COT Newsletter

*COT Report: The COT data, released weekly to the public each Friday, is updated through the most recent Tuesday (data is 3 days old) and shows a quick view of how large speculators or non-commercials (for-profit traders) were positioned in the futures markets.

The CFTC categorizes trader positions according to commercial hedgers (traders who use futures contracts for hedging as part of the business), non-commercials (large traders who speculate to realize trading profits) and nonreportable traders (usually small traders/speculators) as well as their open interest (contracts open in the market at time of reporting). See CFTC criteria here.