The latest update for the weekly Commitment of Traders (COT) report was released by the Commodity Futures Trading Commission (CFTC) on Friday for data ending on July 16th.
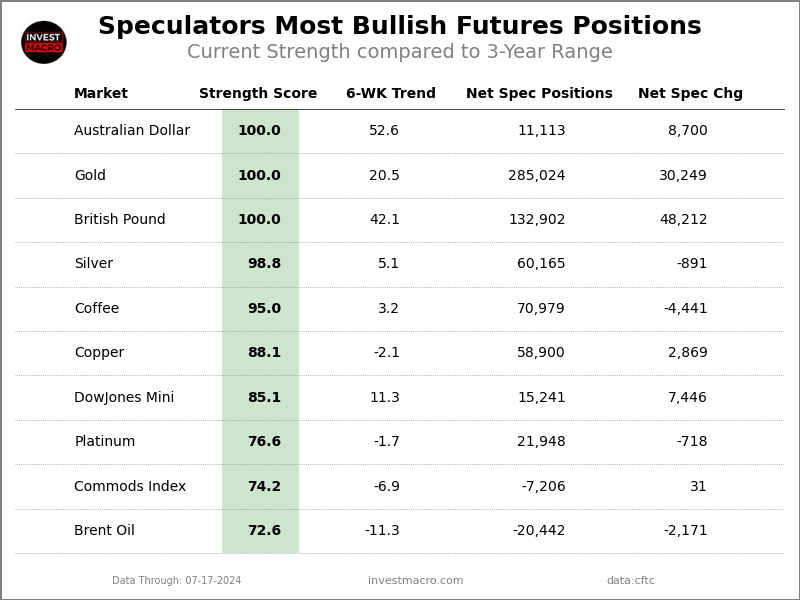
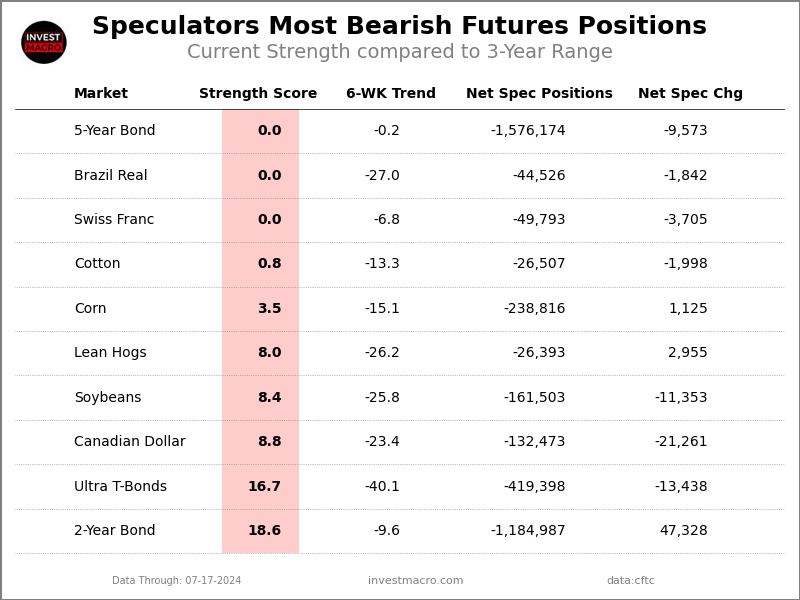
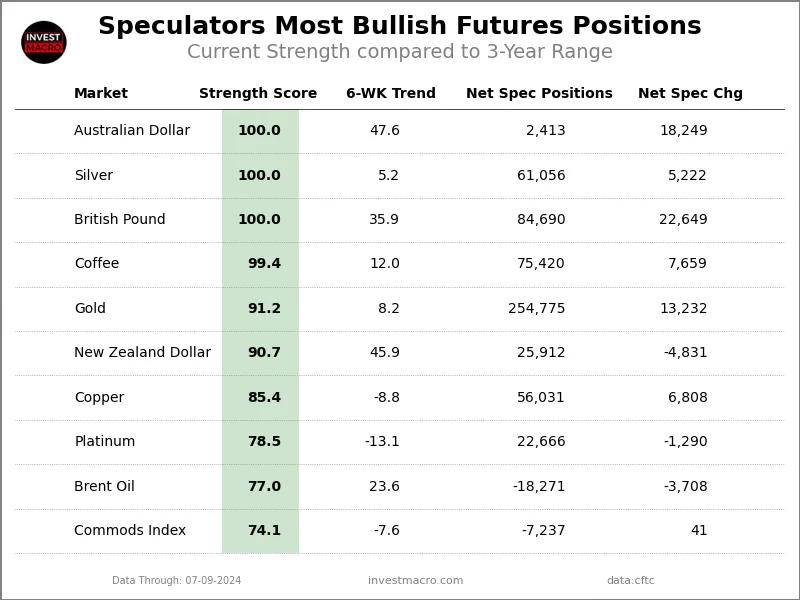
This weekly Extreme Positions report highlights the Most Bullish and Most Bearish Positions for the speculator category. Extreme positioning in these markets can foreshadow strong moves in the underlying market.
To signify an extreme position, we use the Strength Index (also known as the COT Index) of each instrument, a common method of measuring COT data. The Strength Index is simply a comparison of current trader positions against the range of positions over the previous 3 years. We use over 80 percent as extremely bullish and under 20 percent as extremely bearish. (Compare Strength Index scores across all markets in the data table or cot leaders table)
Here Are This Week’s Most Bullish Speculator Positions:
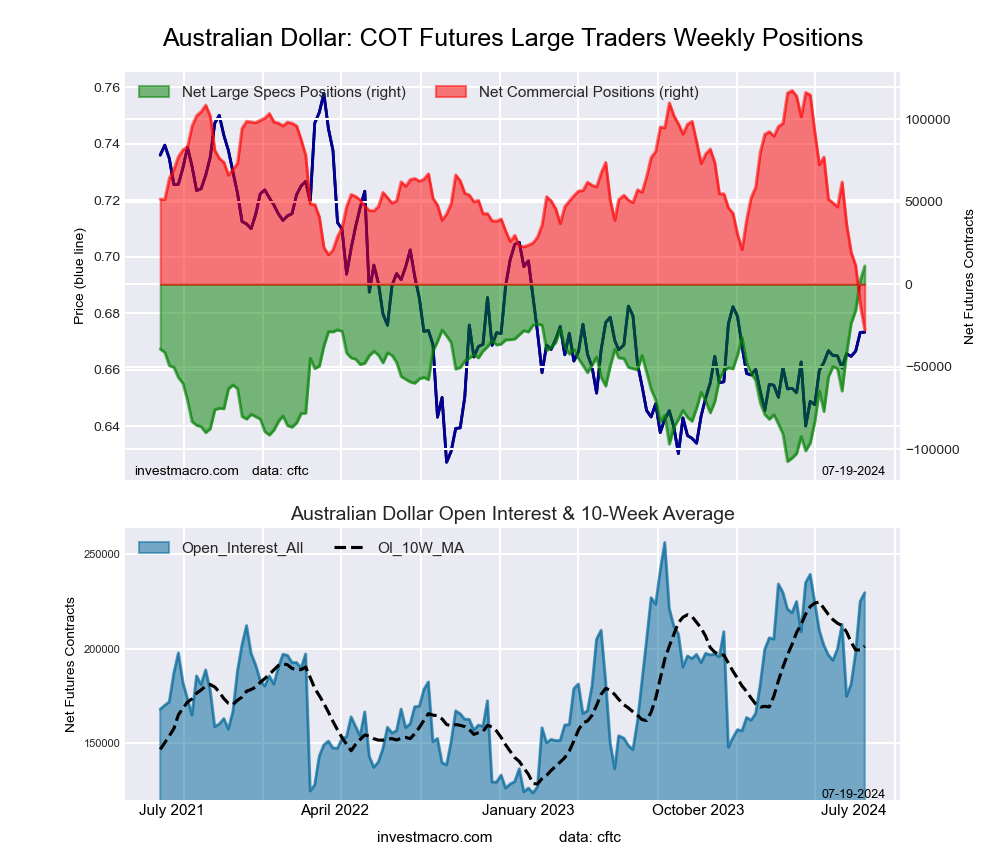
Australian Dollar
The Australian Dollar speculator position comes in as the most bullish extreme standing this week. The Australian Dollar speculator level is currently at a 100.0 percent score of its 3-year range.
The six-week trend for the percent strength score totaled 52.6 this week. The overall net speculator position was a total of 11,113 net contracts this week with a rise of 8,700 contract in the weekly speculator bets.
Speculators or Non-Commercials Notes:
Speculators, classified as non-commercial traders by the CFTC, are made up of large commodity funds, hedge funds and other significant for-profit participants. The Specs are generally regarded as trend-followers in their behavior towards price action – net speculator bets and prices tend to go in the same directions. These traders often look to buy when prices are rising and sell when prices are falling. To illustrate this point, many times speculator contracts can be found at their most extremes (bullish or bearish) when prices are also close to their highest or lowest levels.
These extreme levels can be dangerous for the large speculators as the trade is most crowded, there is less trading ammunition still sitting on the sidelines to push the trend further and prices have moved a significant distance. When the trend becomes exhausted, some speculators take profits while others look to also exit positions when prices fail to continue in the same direction. This process usually plays out over many months to years and can ultimately create a reverse effect where prices start to fall and speculators start a process of selling when prices are falling.
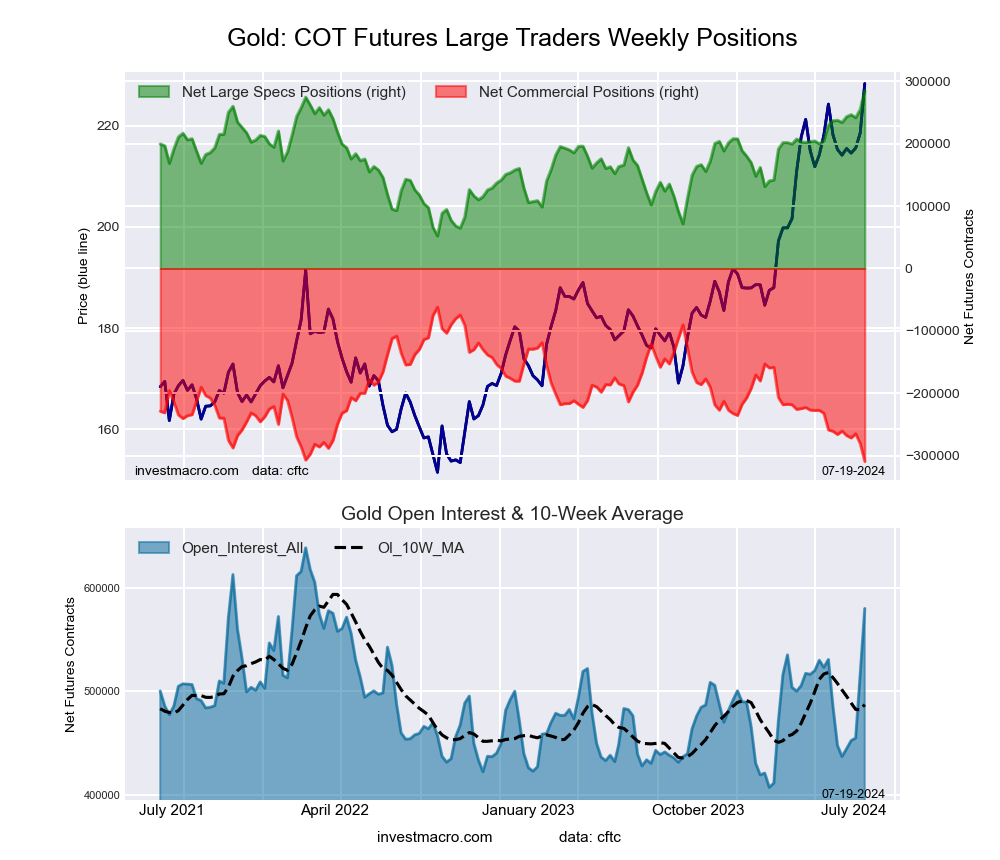
Gold
The Gold speculator position comes next in the extreme standings this week. The Gold speculator level is now at a 100.0 percent score of its 3-year range.
The six-week trend for the percent strength score was 20.5 this week. The speculator position registered 285,024 net contracts this week with a weekly boost by 30,249 contracts in speculator bets.
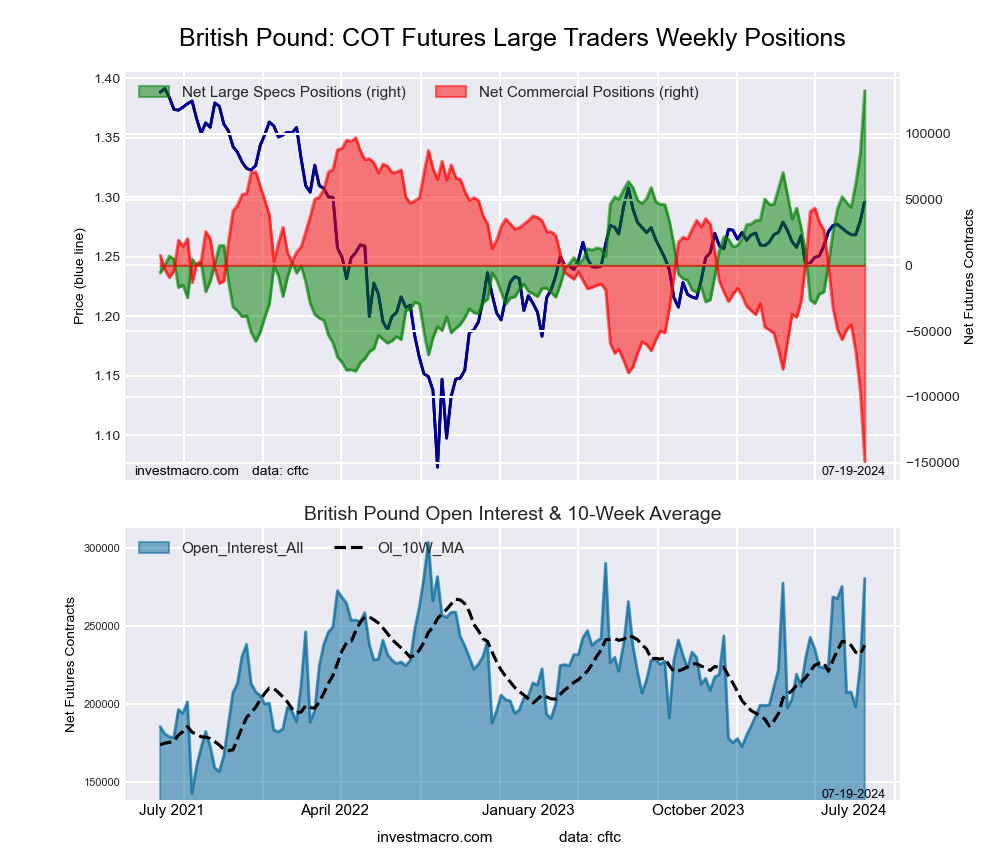
British Pound
The British Pound speculator position comes in third this week in the extreme standings. The British Pound speculator level resides at a 100.0 percent score of its 3-year range.
The six-week trend for the speculator strength score came in at 42.1 this week. The overall speculator position was 132,902 net contracts this week with a gain of 48,212 contracts in the weekly speculator bets.
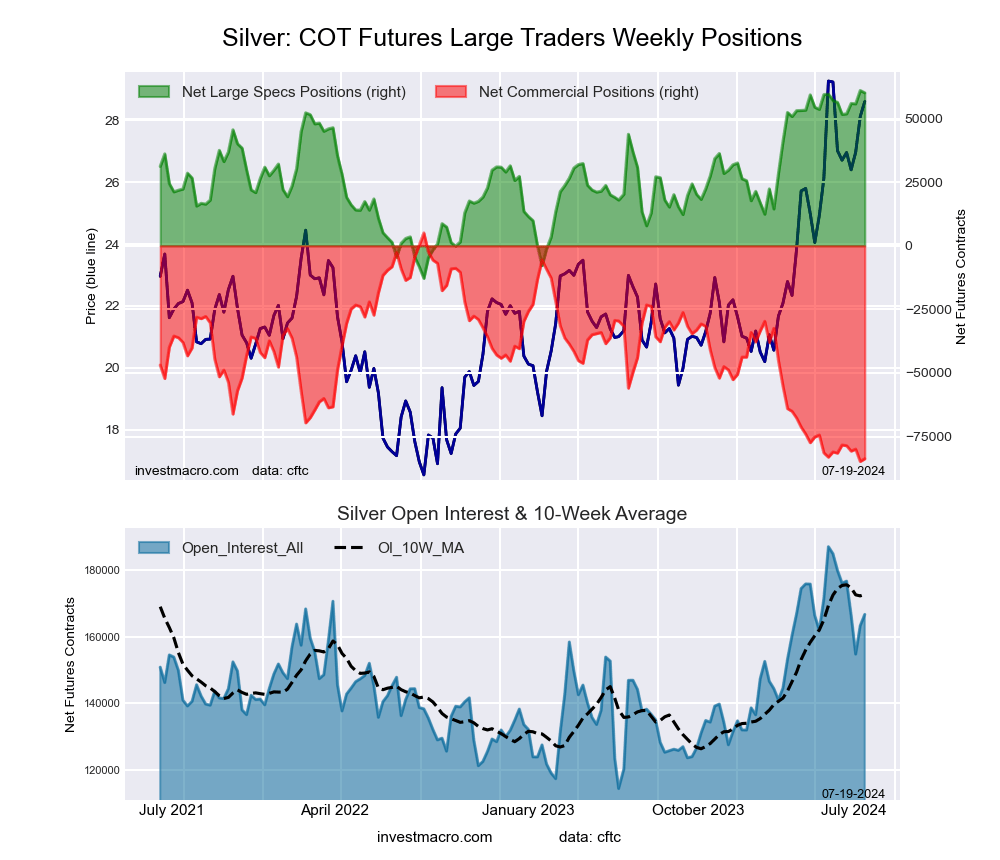
Silver
The Silver speculator position comes up number four in the extreme standings this week. The Silver speculator level is at a 98.8 percent score of its 3-year range.
The six-week trend for the speculator strength score totaled a change of 5.1 this week. The overall speculator position was 60,165 net contracts this week with a small edge lower by -891 contracts in the speculator bets.
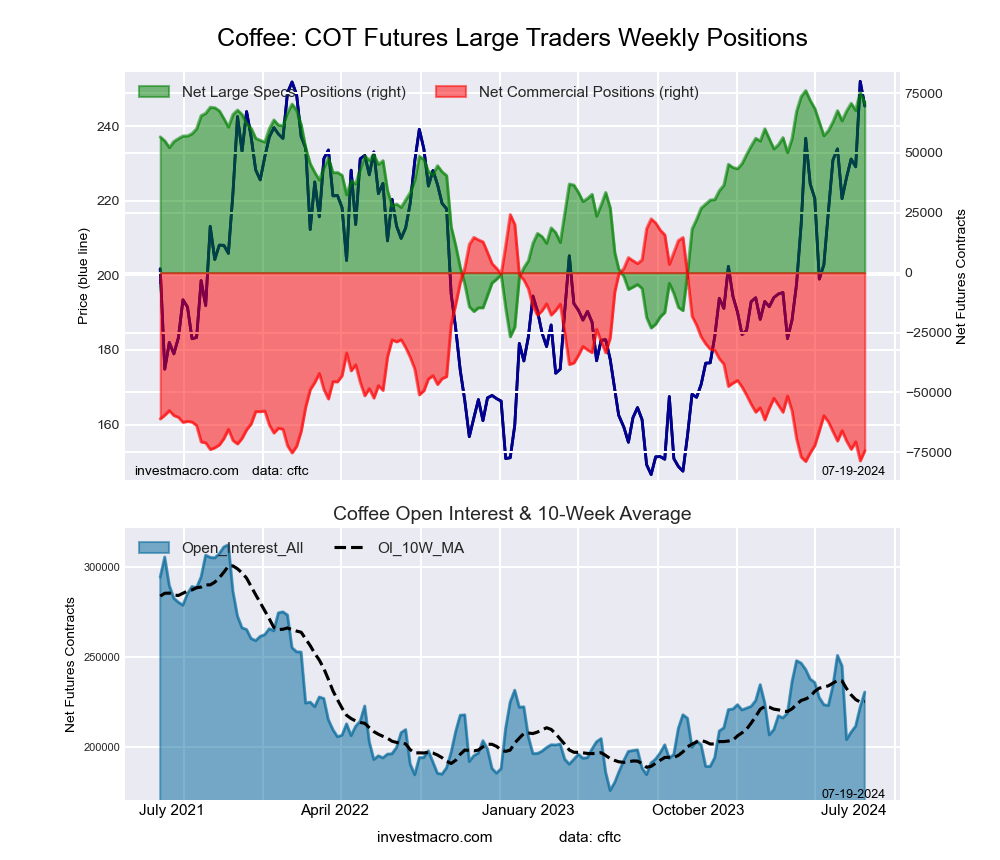
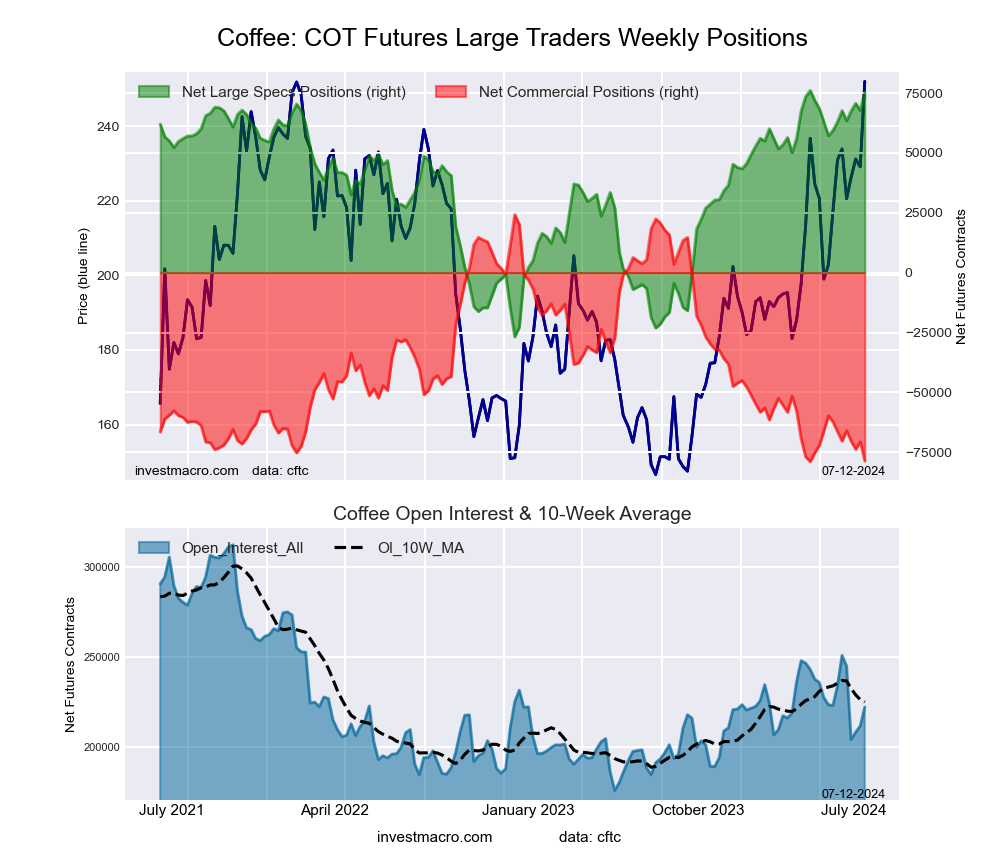
Coffee
The Coffee speculator position rounds out the top five in this week’s bullish extreme standings. The Coffee speculator level sits at a 95.0 percent score of its 3-year range. The six-week trend for the speculator strength score was 3.2 this week.
The speculator position was 70,979 net contracts this week with a decrease of -4,441 contracts in the weekly speculator bets.
This Week’s Most Bearish Speculator Positions:
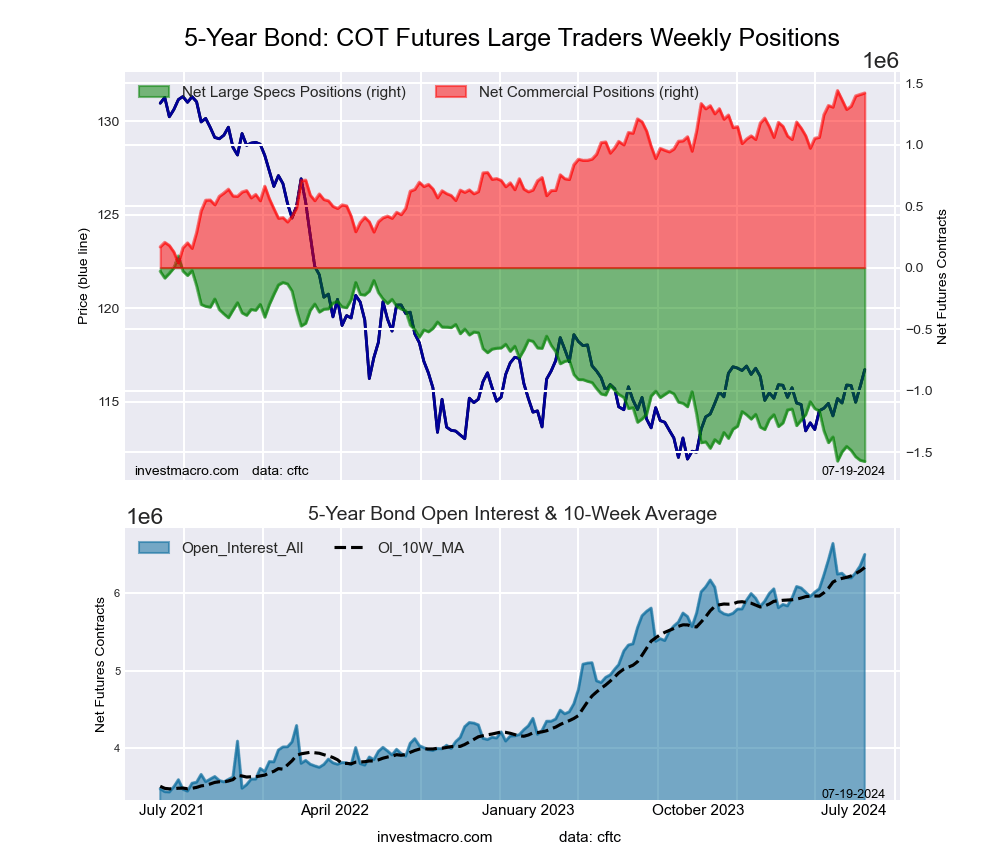
5-Year Bond
The 5-Year Bond speculator position comes in as the most bearish extreme standing this week. The 5-Year Bond speculator level is at a 0.0 percent score of its 3-year range.
The six-week trend for the speculator strength score was -0.2 this week. The overall speculator position was -1,576,174 net contracts this week with a dip by -9,573 contracts in the speculator bets.
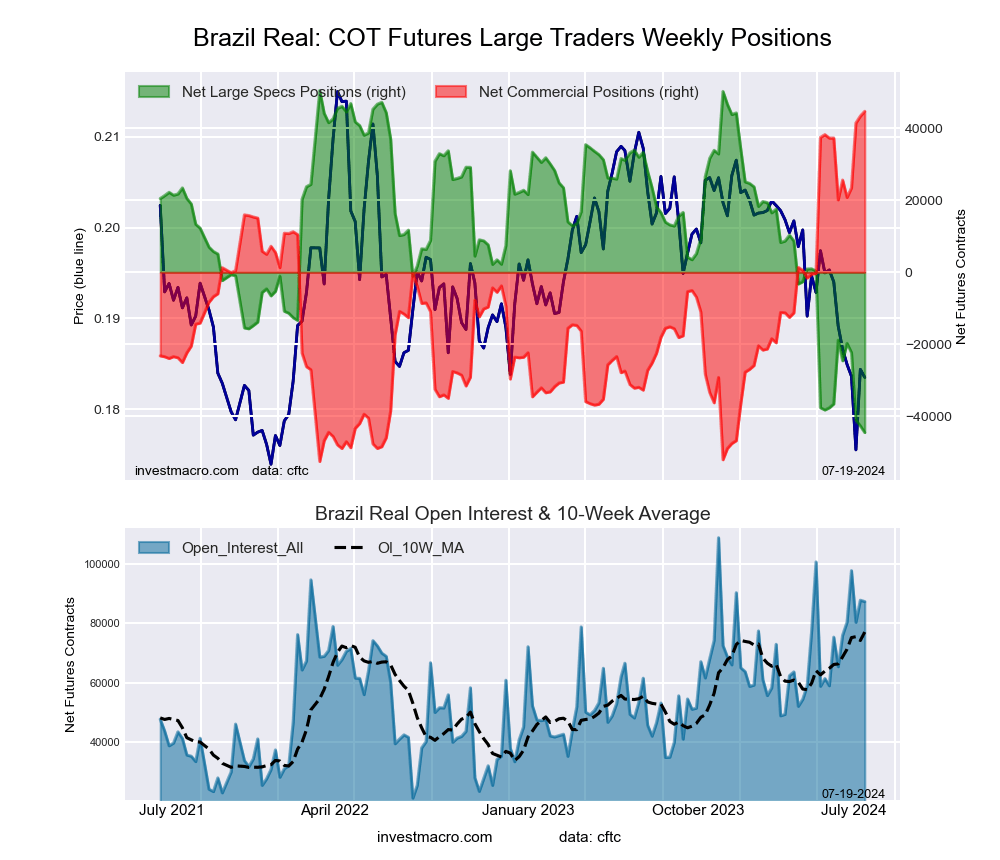
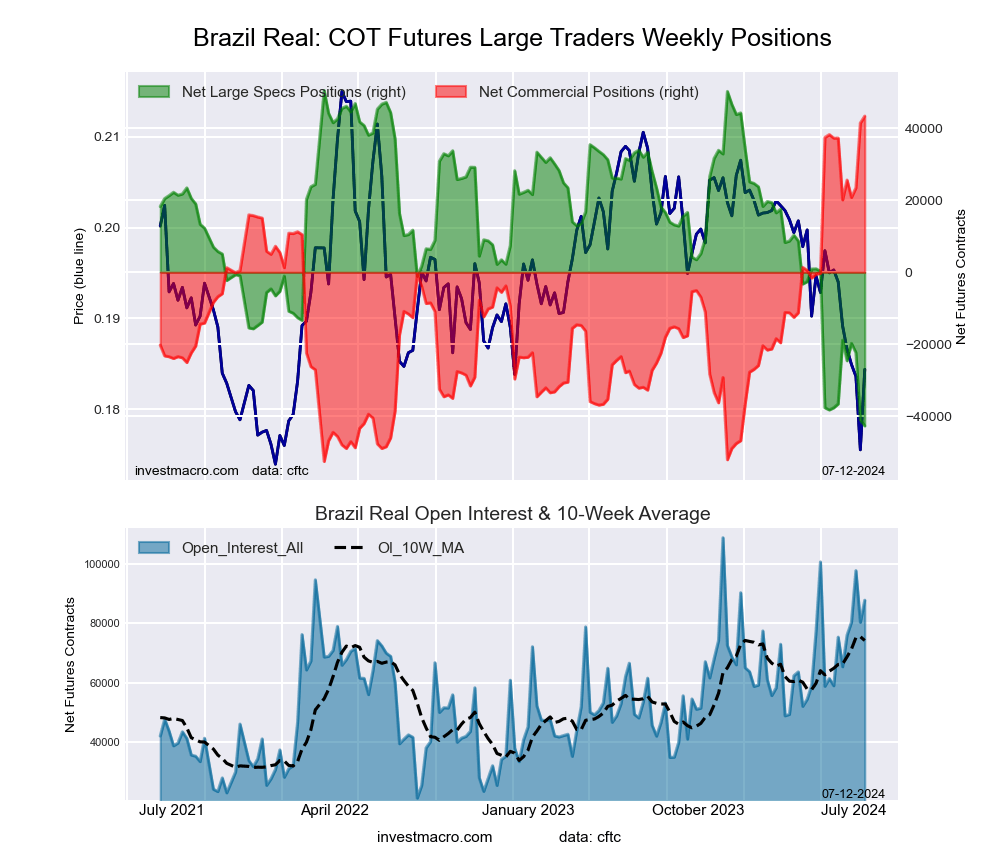
Brazil Real
The Brazil Real speculator position comes in next for the most bearish extreme standing on the week. The Brazil Real speculator level is at a 0.0 percent score of its 3-year range.
The six-week trend for the speculator strength score was -27.0 this week. The speculator position was -44,526 net contracts this week with a reduction by -1,842 contracts in the weekly speculator bets.
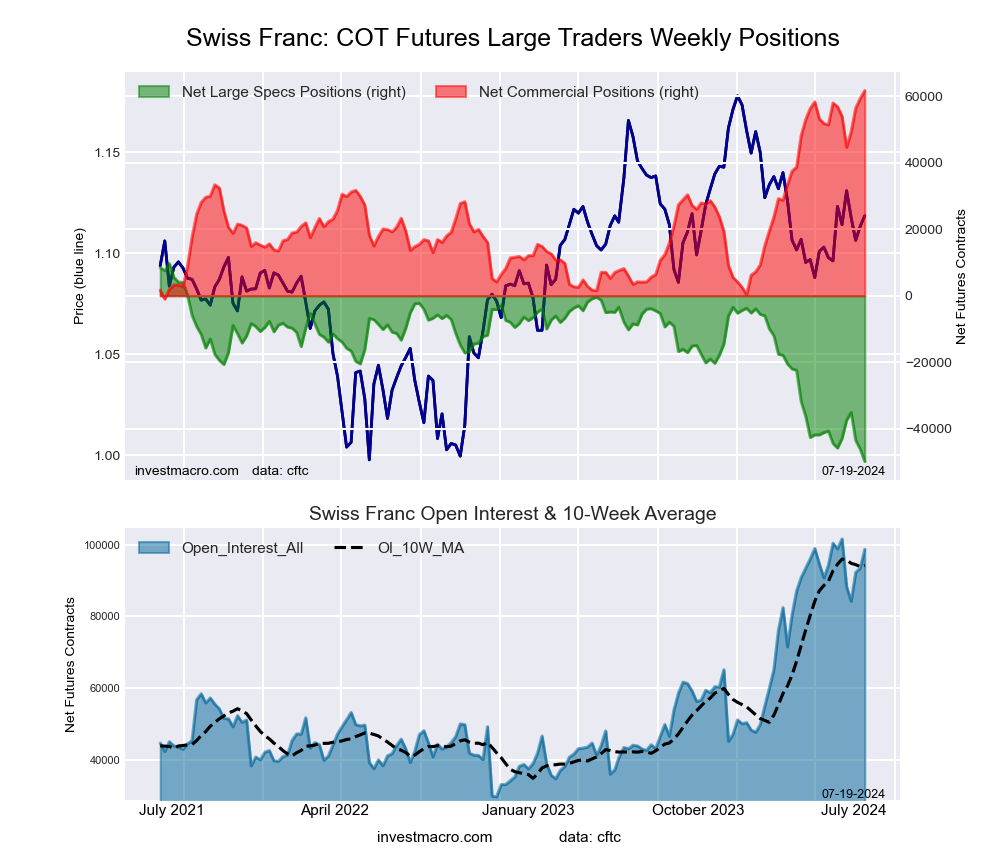
Swiss Franc
The Swiss Franc speculator position comes in as third most bearish extreme standing of the week. The Swiss Franc speculator level resides at a 0.0 percent score of its 3-year range.
The six-week trend for the speculator strength score was -6.8 this week. The overall speculator position was -49,793 net contracts this week with a drop of -3,705 contracts in the speculator bets.
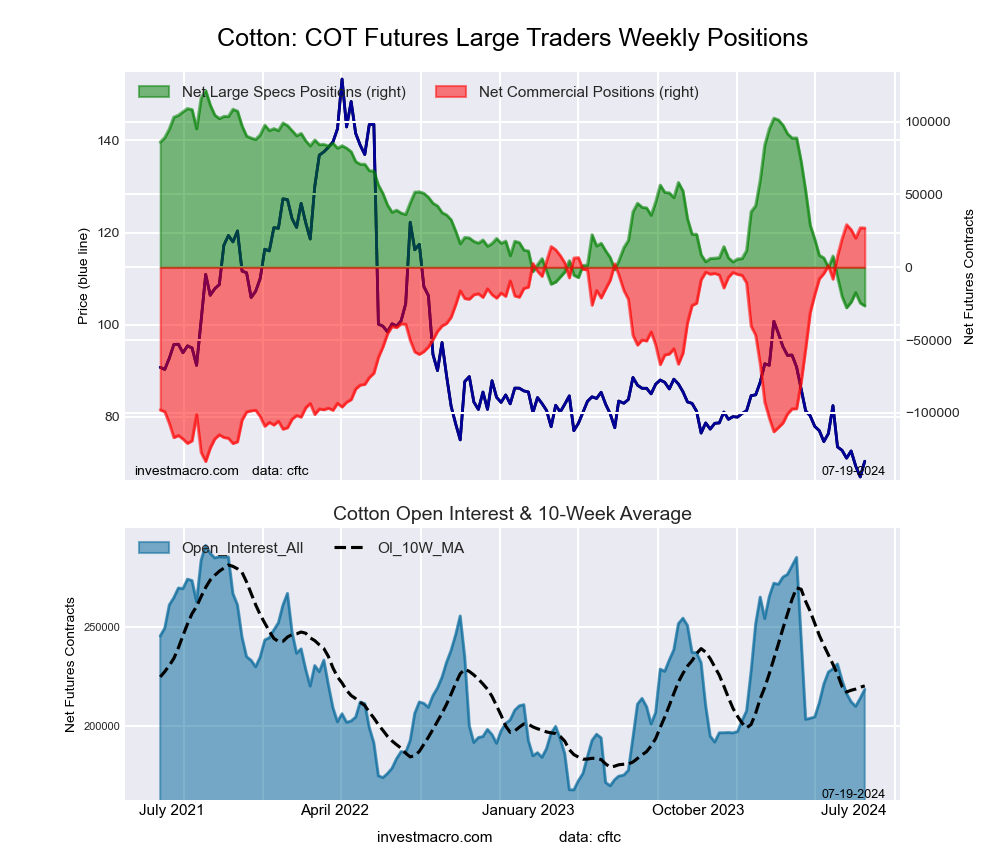
Cotton
The Cotton speculator position comes in as this week’s fourth most bearish extreme standing. The Cotton speculator level is at a 0.8 percent score of its 3-year range.
The six-week trend for the speculator strength score was -13.3 this week. The speculator position was -26,507 net contracts this week with a decline of -1,998 contracts in the weekly speculator bets.
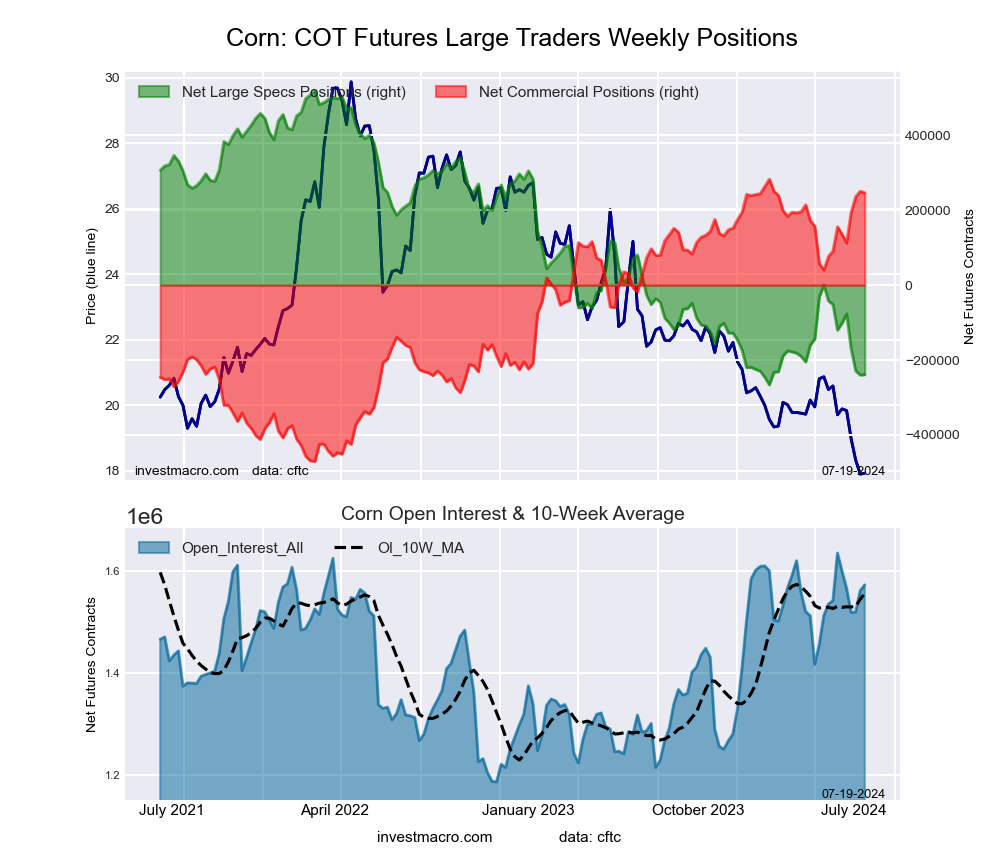
Corn
Finally, the Corn speculator position comes in as the fifth most bearish extreme standing for this week. The Corn speculator level is at a 3.5 percent score of its 3-year range.
The six-week trend for the speculator strength score was -15.1 this week. The speculator position was -238,816 net contracts this week with an increase of 1,125 contracts in the weekly speculator bets.
Article By InvestMacro – Receive our weekly COT Newsletter
*COT Report: The COT data, released weekly to the public each Friday, is updated through the most recent Tuesday (data is 3 days old) and shows a quick view of how large speculators or non-commercials (for-profit traders) were positioned in the futures markets.
The CFTC categorizes trader positions according to commercial hedgers (traders who use futures contracts for hedging as part of the business), non-commercials (large traders who speculate to realize trading profits) and nonreportable traders (usually small traders/speculators) as well as their open interest (contracts open in the market at time of reporting). See CFTC criteria here.
See how Elliott wave patterns “subsume” other technical analysis chart patterns
By Elliott Wave International
Some investors who are fans of technical analysis may not realize that another way to look at many classic chart patterns — for example, Head and Shoulders — is to describe them in terms of Elliott waves.
What this means is that once you’ve learned Elliott wave analysis, by proxy you’ve learned most other technical analysis chart patterns that simply go by different names!
It’s a huge time saver.
In August and October 2005, as well as February 2006, Robert Prechter’s Elliott Wave Theorist discussed several chart patterns and showed two examples (with an introductory quote from the August 2005 Elliott Wave Theorist):
The acknowledged “bible” of traditional chart interpretation is Technical Analysis of Stock Trends (1948) by Robert Edwards and MIT alumnus John Magee. … The discussion here utilizes the fifth edition (1966).
Edwards and Magee collected others’ observations about chart patterns and added their own, producing a comprehensive list of forms against which we may compare related aspects of the Wave Principle. It may not be necessary that we undergo this exercise, as these authors observed and displayed these patterns exclusively in charts of individual stocks, not in the averages where the Wave Principle is deemed best to apply. Nevertheless, because many chartists use the same forms for general market interpretation and since the Wave Principle has some applicability to individual stocks, this exercise is important in order to determine if there are any valid market patterns outside the forms of the Wave Principle.
Head and Shoulders Top
Figure 8a shows Edwards and Magee’s depiction of a head and shoulders top, and Figure 8b is Figure 7-4 from Elliott Wave Principle. In a normal wave development, wave five of 3 and wave 4 form the “left shoulder” of the pattern, wave 5 and wave A form the “head,” and wave B and wave one of C form the “right shoulder.” Wave two of C creates the return to the neckline that is typical of the pattern.
Symmetrical Triangle
The Wave Principle covers the chartist’s “symmetrical triangle.” As you can see in Figures 11a and 11b, Edwards and Magee’s example is a perfect rendition of Elliott’s description, right down to the five subwaves.
Edwards and Magee claim, “Prices may move out of a Symmetrical Triangle either up or down. There is seldom if ever…any clue as to the direction….” Elliott’s form is more specifically defined, and its position in the market structure and therefore its implications are more definite.
Even though just two examples were shown here, hopefully, you get a flavor of what was presented in 2005 and 2006 — and an idea of the quality of analysis which our Financial Forecast Service regularly offers.
Realize that a chart pattern — even though it’s “classic” — offers no guarantees — and the same with the Wave Principle.
Yet, keep in mind this adaptation of a Q&A with Robert Prechter from an issue of The Elliott Wave Theorist:
Q: Do you believe that the Wave Principle provides for an objective form of analysis? Two different people can look at the same chart and derive very different wave counts. There are market watchers who say that applying wave theory is very subjective.
A: I always ask, “compared to what?” There is no group more subjective than conventional analysts who look at the same “fundamental” news event [like] a war, the level of interest rates, the P/E ratio, GDP reports, the President’s economic policy, the Fed’s monetary policy, you name it and come up with countless opposing conclusions. They generally don’t even bother to study the data. The Wave Principle is an excellent basis for assessing probabilities regarding future market movement. Probabilities are by nature different from certainties. Some people misinterpret this aspect of analysis as subjectivity, but all probabilities may be put in order objectively according to the rules and guidelines of wave formation.
If you’re unfamiliar with Elliott wave analysis, read Frost & Prechter’s Elliott Wave Principle: Key to Market Behavior, which is the definitive text on the subject. Here’s a quote from the book:
[Ralph N.] Elliott recognized that not news, but something else forms the patterns evident in the market. Generally speaking, the important analytical question is not the news per se, but the importance the market places or appears to place on the news. In periods of increasing optimism, the market’s apparent reaction to an item of news is often different from what it would have been if the market were in a downtrend. It is easy to label the progression of Elliott waves on a historical price chart, but it is impossible to pick out, say, the occurrences of war, the most dramatic of human activities, on the basis of recorded stock market action. The psychology of the market in relation to the news, then, is sometimes useful, especially when the market acts contrarily to what one would “normally” expect.
If you’d like to read the entire online version of Elliott Wave Principle: Key to Market Behavior, you can get complimentary access by following this link: Elliott Wave Principle: Key to Market Behavior.
This article was syndicated by Elliott Wave International and was originally published under the headline Want to Learn How to “Read” a Price Chart? Start Here.. EWI is the world’s largest market forecasting firm. Its staff of full-time analysts led by Chartered Market Technician Robert Prechter provides 24-hour-a-day market analysis to institutional and private investors around the world.
The week ahead is packed with high-impact data releases and a slew of corporate earnings from the largest companies in the world:
Monday, 22nd July
CN50: China loan prime rates
TWN: Taiwan jobless rate
Tuesday, 23rd July
EU50: Eurozone consumer confidence
SG20: Singapore CPI
TWN: Taiwan industrial production
NAS100: Alphabet, Tesla earnings
FRA40: LVMH earnings
Wednesday, 24th July
CAD: Bank of Canada rate decision
EU50: Eurozone, Germany PMI
UK100: UK S&P Global PMI
US30: IBM earnings, US S&P Global PMI
GER40: Deutsche Bank earnings
Thursday, 25th July
GER40: Germany IFO business climate
US500: US Q2 GDP, initial jobless claims
Bitcoin: Crypto 2024 conference in Nashville
Friday, 26th July
JP225: Japan Tokyo CPI
SG20: Singapore industrial production
USDInd: US June PCE report, University of Michigan consumer sentiment
Although earnings season is in full swing, the excitement levels could jump next week when big tech companies report their results. Expectations remain high around whether these AI giants can keep up the bullish momentum that has propelled US markets to record highs this year.
Two of the so-called “Magnificent” 7 tech titans will be under the spotlight. Here’s what you need to know.
1) Alphabet
Google parent company Alphabet reports its second-quarter earnings on Tuesday 23rd July after US markets close.
Its shares have gained 27% in 2024 thanks to investor hype around artificial intelligence translating to big gains in the tech space. Still, investors will be looking for another round of exceptional results to justify the solid gains fuelled by the A.I. frenzy.
Beyond the revenue growth and earnings-per-share, updates on AI innovations will be in focus.
Markets are forecasting a 5.8% move, either Up or Down, for Alphabet stocks post earnings.
Talking technicals, Alphabet stocks have shed roughly 6% this week with prices wobbling above the 50-day SMA. The past few days have been rough for tech stocks due to reports of the US mulling tougher restrictions on trading chips with China.
A solid breakdown below $177 may open a path towards $170.
Should the 50-day SMA prove reliable support, prices may retest $183 and $188.50.
2) Tesla
Tesla is also set to release its second-quarter earnings on Tuesday after the close of US trading.
Despite gaining over 25% in July thanks to a strong delivery report, Tesla stocks are just barely in positive territory year-to-date. The company’s revenues, any mention of affordable vehicles, and the full self-driving software update will be scrutinized by investors to gauge its business outlook.
Quarterly revenues are seen slipping to $24.6 billion from $24.9 billion in the prior year, equating to a 1.2% decline.
Markets are forecasting an 8% move, either Up or Down, for Tesla stocks post-earnings.
Looking at the technical picture, Tesla stocks remain in a wide range on the daily charts with support at $232.50 and resistance at $270.Given the potential 8% move either up or down, a breakout could be on the horizon.
In twomajor rulings this past month, the U.S. Supreme Court curtailed the authority of federal agencies to draft and enforce policies that affect the nation’s financial health. One important agency, the Securities and Exchange Commission, took a particularly big hit.
Speaking as someone who has researched financial shenanigans for almost 50 years, I’m concerned that these rulings will backfire on markets and investors.
Taken together, they could lead to watered-down regulations, weakened enforcement and less oversight of the nation’s financial markets and public companies. I fear that they could ultimately be a significant factor in a future market crash.
In one case, Securities and Exchange Commission v. Jarkesy, the court rebuked the SEC — the agency that protects investors from fraud — for using in-house proceedings to discipline firms and others for breaking securities laws. Now, the SEC will need to bring accused securities fraudsters to federal court, which could be more complicated and expensive.
And in the other case, Loper Bright Enterprises v. Raimondo, the court cut back sharply on a long-standing doctrine — the Chevron rule — that gave agencies considerable freedom to craft rules and regulations, particularly when the underlying law might be ambiguous. As a result, federal agencies, including the SEC, have less power to act, ceding that power to lengthier and costlier trial proceedings.
More layers of hidden risk for investors
Both decisions could affect the nation’s financial well-being. Investors who rely on the disclosure rules and the enforcement mechanisms of the SEC for protection – now subject to legal challenge – are about to be saddled with an extra layer of hidden risk not seen in decades – in particular, more questionable accounting practices in their regulatory filings.
Recall that in 1933 and 1934, Congress established the SEC in the aftermath of the Great Depression. What followed in the ensuing years was the formation of less risky and more informed markets.
Investors could also rely on market prices to efficiently and unbiasedly reflect all public information, rather than have to pore over complex financial statements. This led to the U.S. markets becoming the most attractive destination in the world for funds to invest in risky business projects.
The SEC later bolstered financial markets with measures under the Dodd-Frank Act of 2010 to rectify other excesses — such as overly generous credit ratings — that arguably contributed to the 2007–2008 Great Recession. Today, thanks to extensive disclosure requirements and relatively efficient enforcement mechanisms, the U.S. has perhaps the healthiest and most robust financial markets ever.
A new challenge to enforcement
Healthy and robust financial markets don’t operate out of altruism, however.
Monitoring and enforcement mechanisms are pivotal. While the SEC relies partly on the private sector to spot and discipline errant managers for violations of the securities laws – for example, through federal and state securities class action litigation – much of the effort relies on the enforcement division of the SEC.
In particular, the SEC uses “accounting and auditing enforcement releases,” or AAERs, to ensure that firms keep a clean set of books. Since 1995, the SEC has issued 3,266 AAERs, mostly to correct accounting and auditing deficiencies in company financial statements. Numerous studies confirm AAERs as evidence of financial fraud.
AAERs are also a highly efficient form of enforcement — and much less costly than a private securities class action lawsuit. Companies generally agree to settle the allegations of wrongdoing without admission of liability by taking timely steps to improve accounting and auditing and paying fines and penalties.
The payments have been substantial. For example, for 760 enforcement actions in 2022, companies paid as much as US$6.4 billion to the SEC. The announcement of an AAER action is also costly for the firm’s shareholders, with stock prices falling 50% over the next six months following an AAER announcement, according to researchers.
But the Jarkesy ruling could change everything. I don’t see why any publicly traded company would agree to settle an AAER action with fines and sanctions now that it can challenge the SEC’s arguments in a court of law.
The danger of enforcement by courts
What might be the result of removing or paring back the SEC’s key tool of enforcement?
The risk is possibly reverting to an environment like 1928 or 2007. That’s because the ruling will effectively reduce the cost of accounting or auditing violations for would-be or actual violators. It shifts the purview of deciding penalties and fines to the courts rather than in-house proceedings by the SEC, increasing the cost of enforcement to the SEC.
In short, companies will worry less about a future AAER investigation.
In addition, despite auditors’ efforts to ensure that publicly traded financial and investment firms keep a clean set of books based on generally accepted accounting principles, or GAAP, there is still much room for choice, including greater use of non-GAAP accounting rules. With less enforcement, the Jarkesy ruling will encourage more creative accounting, not less.
That creativity already skews toward optimistic earnings reports. The vast majority of earnings releases now exceed analysts’ forecasts — 77% for the S&P 500 in the first quarter of 2024. Moreover, my own research indicates that it’s not just that earning reports exceed analysts’ forecasts, but the dollar size of firms’ positive earnings surprises has grown steadily over the past decade, which is another hidden risk.
While that’s true for some actions, I think the largest impact will lie in SEC actions not yet undertaken. Businesses and the SEC will act differently in the future because Jarkesy makes SEC enforcement activity more expensive and more uncertain.
Expect more efforts by firms to present their financial performance in the most glowing terms possible, knowing that the cost of SEC enforcement has just increased and the detection likelihood and expected cost to a firm of violating generally accepted accounting principles or generally accepted auditing standards has just decreased.
While not all scholars agree, there are two major periods in the financial history of the United States when a financial meltdown occurred that was in part plausibly due to shoddy accounting and reporting – the Great Depression of 1929 and the Great Recession of 2007–2009.
In the years or decades ahead, should the country face another serious financial crisis leading to a recession, it will be harder to blame the accountants and investment bankers. Instead, attention may turn to two mid-2024 court decisions and the justices who wrote them.
We explain carbon credits, cover some of the system’s inherent problems, discuss future market growth and highlight some carbon credit streaming companies working hard to operate transparently.
Last year, scrutiny of the carbon credits/offsets market rose with media exposés on unethical carbon projects and system abuses. Despite issues with the system and harsh criticisms, the market is reportedly gaining traction.
Forecasts call for rapid growth over the next decade due to efforts by countries around the world to reach a net zero carbon status in the foreseeable future.
A Quick Primer
Carbon credits were introduced in 1997 as a way to lower carbon dioxide (CO2) emissions. Today, their purpose goes further, to help speed up decarbonization by offsetting global emissions.
“We are in a climate emergency, and we need every tool in the box to meet the 1.5 degrees C [global warming] target,” said Annette Nazareth, council chair of the Integrity Council for the Voluntary Carbon Market. “High-integrity carbon credits can mobilize private finance at scale for projects to reduce and remove billions of tons of emissions that would not otherwise be viable.”
Carbon credits allow a company or entity to emit CO2 or other greenhouse gases, specifically one ton of either per credit, according to Investopedia. Though these credits are akin to rations, companies earn them by avoiding, reducing, or removing carbon through a project verified by an independent third party.
As explained by Carbon Direct, “Carbon avoidance is an action that prevents a carbon-emitting activity from happening. Carbon reduction is an action that decreases the amount of greenhouse gas emissions compared to prior practices. Carbon removal is the process of removing carbon dioxide from the atmosphere and locking it away for decades, centuries, or millennia.”
After a project is verified, the company behind it receives the credits. Companies may either use, trade, or sell their credits.
Carbon Cowboys
While the concept is lofty, the carbon credit system has inherent problems. This has dampened companies’ confidence in it, which is reflected in the decrease in traded carbon credits in 2023, reported the Center for Strategic and International Studies.
The world learned about one major abuse in 2006, when Gustav Daphne and three coconspirators were arrested for stealing €5−10 billion (€5−10B) from the European Union’s carbon emissions trading system, meant to facilitate transactions between member countries, according to an article by The Guardian. The scammers achieved “the fraud of the century,” the media called it, in just months, by exploiting a loophole in the market’s policy.
According to MIT News, “Several experts at the Massachusetts Institute of Technology (MIT) now say that the system could be effective.”
The case of the Kariba REDD+ project in Zimbabwe illustrates two additional issues with carbon credit systems: a lack of transparency and accountability in where revenues from carbon-offsetting projects go and a lack of checks and balances in the verification process.
The Kariba project promised to conserve vast forest areas to sequester carbon and pass on benefits to the community by, for instance, investing in infrastructure and job creation. Reportedly, an independent third party verified the project, and it generated more than €100 million (€100M) from sales of carbon credits to Western companies. Yet only €14M of the proceeds went to the local villages, The Guardian reported. The other €86M went to the project broker/lead and local coordinator for costs and profits.
This very scheme has happened enough around the world, primarily in developing countries, that there is a name for groups involved in nature-based carbon markets just to make money from trading carbon: “carbon cowboys.” Like with Kariba, questions linger about the integrity and value of many projects.
Critics argue that forest carbon schemes often benefit international traders over local communities. More broadly, opponents of carbon credits/offsets claim they do not work and, sometimes, the associated projects harm the planet.
“Scientific studies and investigative have found that a growing number of projects failed to deliver the emission reductions promised,” reported Climate Home News on May 29. “Nongovernmental organizations have also denounced instances of human rights abuse and environmental damage caused by carbon-offsetting activities.”
Notable Growth Projected
Despite the controversy, the carbon credit/offset market is forecasted to skyrocket between 2023 and 2028 at a compound annual growth rate (CAGR) of 31%, according to Market and Markets, even with the expectation that transparency and traceability will hamper its growth. By 2028, the market is projected to reach US$414.8B in value, more than 250 times the US$1.6B it was in 2023. The primary growth driver will continue to be the massive global effort to reach net zero carbon targets.
CarbonCredits.com highlighted Carbon Streaming Corp. as one of its Top 4 Carbon Stocks To Watch in 2024. The company, the first of its kind in the carbon credit market.
“Rising environmental concerns and government support are expected to offer lucrative opportunities for the market players in the next five years,” the report said.
Demand for voluntary carbon markets (VCMs), marketplaces in which entities may buy, sell, or trade carbon credits, is growing. Thus, the voluntary carbon credit market is projected to expand at a 27% CAGR between 2024 and 2032, according to Global Market Insights. During this period, the market value is forecasted to reach US$21.7B, up from US$2.4B.
In the U.S. in May, the Departments of Treasury, Agriculture, and Energy and White House representatives published a joint policy statement that laid out seven principles for responsibly participating in VCMs and ensuring they are effective, fair, and equitable, noted a White House fact sheet.
Carbon Streaming Isn’t Over
While bad actors may have previously polluted the carbon credit market, there are companies striving to operate transparently, and some experts consider the system worth looking into.
According to MIT News, “Several experts at the Massachusetts Institute of Technology (MIT) now say that the system could be effective, at least in certain circumstances, but it must be thoroughly evaluated and regulated.”
Base Carbon
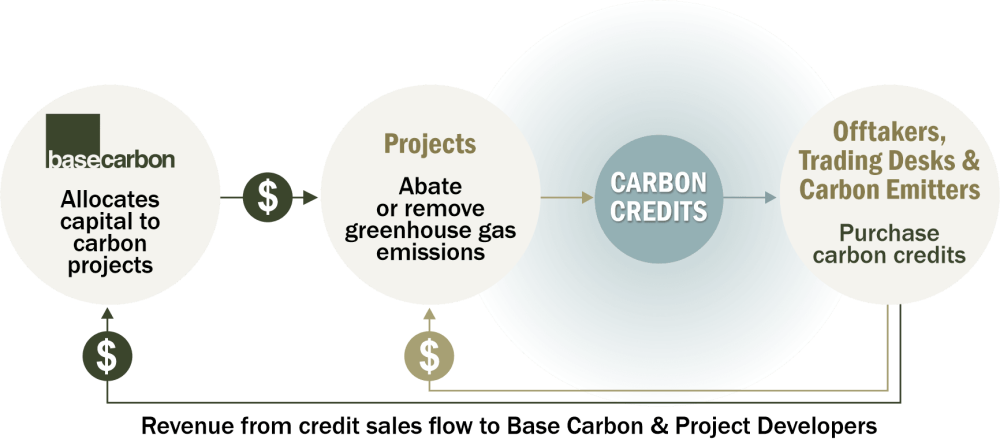
One company, Base Carbon (BCBN:NEO; BCBNF:OTCMKTS), is working to set standards for transparency in the sale of carbon credits.Base Carbon is a carbon credit company focusing on carbon capital allocation, project origination, and data transparency tools. According to the company, its primary objective is to allocate “capital directly into carbon reduction projects and carbon development companies.”
According to Base Carbon, “Pledges to lower carbon emissions now cover 92% of GDP and 88% of emissions worldwide. However, emission reduction, capture, and sequestration technologies are not yet scaled to meet these targets, creating a growing demand for quality carbon credits.”
Base Carbon aims to aid in this divide by connecting project developers who need financing and credit buying who may be searching for reputable carbon credits for their individual climate pledges.
Source: Base Carbon
In terms of renewing credibility in the carbon market, CEO Michael Costa stated, “Our mission is to simplify the carbon credit economy, and we are working to become the trusted financier within the voluntary carbon markets.”
One of the ways it does this is through data transparency tools. The company’s data standardization frameworks help capture and organize information from initial carbon emission sources. This process transforms raw data into valuable, usable components within the carbon credit ecosystem. By ensuring the accuracy and consistency of project-generated data, the company hopes to build a solid foundation of trust for our investment decisions and collaborative efforts.
You can see Base Carbon’s list of projects in the image below.
While past “bad apples” in the carbon credit space may have put a bad taste in investors’ mouths, Base Carbon is not slowing down anytime soon. As an article from Green Investing notes, “There’s a never-ending list of potential factors that turn people away from the space. This can either be seen as a contrarian opportunity or a reason to look elsewhere. Regardless, Base Carbon is going to continue advancing in the industry.”
The article solidified this opinion by sharing Base Carbon’s upcoming catalysts, which include:
The company will likely become profitable this year (2024).
Base Carbon has 8.1 million credits to be issued from its cookstove and household devices projects, which Green Investing believes could result in US$50 million in revenue.
Announcements about deals to sell carbon credits or get government approval for these sales.
New developments from current partnerships and more potential projects in the works.
More information about the company’s joint investment plan with STX Group to be released.
Graham Mattison of Water Tower Research also sees promise in Base Carbon, as shown in a May 1 research note. Mattison wrote he saw “continued execution across all projects,” a growing cash flow, and “multiple potential catalysts ahead” for Base Carbon.
He wrote, “The current market cap of Base Carbon is ~US$40 million; the Vietnam project alone will deliver cash of ~US$29.1 million in the next 12 months.”
According to Reuters, 10.57% of the company is with management and insiders.
16.79% is with strategic investor Abaxx Technologies Inc.
7.10% is with institutions.
The rest is with retail.
According to the company, Base Carbon has a market cap of US$46.8 million, US$0 in debt, US$667,391 in cash, and 117.1 million shares outstanding as of May 16, 2024.
Market Watch notes that the company trades in the 52-week range between US$0.2025 and US$0.4520.
Carbon Streaming Corp.
Base Carbon is not alone in its mission to make carbon credits more attractive to the market. Carbon Streaming Corp. (NEO-NETZ; OTC-OFSTF) is also working on changing this perspective as part of a corporate turnaround following a drop in its stock price to CA$0.50 per share from CA$15.
The largest investor in the company, Marin Katusa of Katusa Research, is spearheading the changes. He willingly became a technical and financial adviser to the board at no cost, he said, to benefit all shareholders.
Certain changes at the management and board level were required to make the company a success for shareholders, which in turn will enable more investments to help improve the environment, in my eyes,” he told Streetwise Reports. “I trust the individuals I’ve asked to be on the board fully, and I believe we [the shareholders] are in good hands moving forward.” The new interim chair is Olivier Garret, and the interim chief executive officer is CEO Christian Milau.
Katusa also provided Carbon Streaming’s five-part plan for moving forward:
Go through the existing deals and see what we are dealing with. I don’t have an answer for anyone at this point, but I will within 120 days. I will be involved in the technical review of the projects with the new board.
Immediately meet with all existing employees and figure out who we want to keep and who needs to move on and pursue a new venture. Getting rid of the ridiculous compensation that was taken by certain prior management members has now stopped, and further cuts to G&A will be put into place.
In addition to 1&2 above, we have initiated a search both internally and externally for a new permanent CEO. There are two individuals currently employed at NETZ who did catch my eye as the potential to rise to the occasion, and every person at the firm will be given every opportunity to see if the CEO role is the right one. The culture of the company has already changed immediately after replacing the former CEO, and this is a chance for anyone in the firm to rise from the ashes or move on. Christian and the rest of the new NETZ board have the same “business culture” as my own, as does Alice Schroeder, and that will be paramount moving forward.
Moving forward, when it comes to Voluntary Carbon Markets — I’ll be encouraging Carbon Streaming will adopt my rule from 2022, only invest in the VCM market if there is an offtake in place for the credits. No offtake, no investment in the voluntary market.
We will look at all projects, assets, etc., to return shareholder value.
Unlike the company’s previous practice, Katusa said the board members now will only receive the standard options, no cash, no deferred or restricted stock units, nor any other form of compensation “third-party consultants justify.”
About the new culture Katusa is working to achieve, he commented, “This is a win for the shareholder rights. I am proud of this result. It wasn’t easy, but we got what we needed to give this company a chance to succeed. We live to see another day, and I’m expecting big things.”
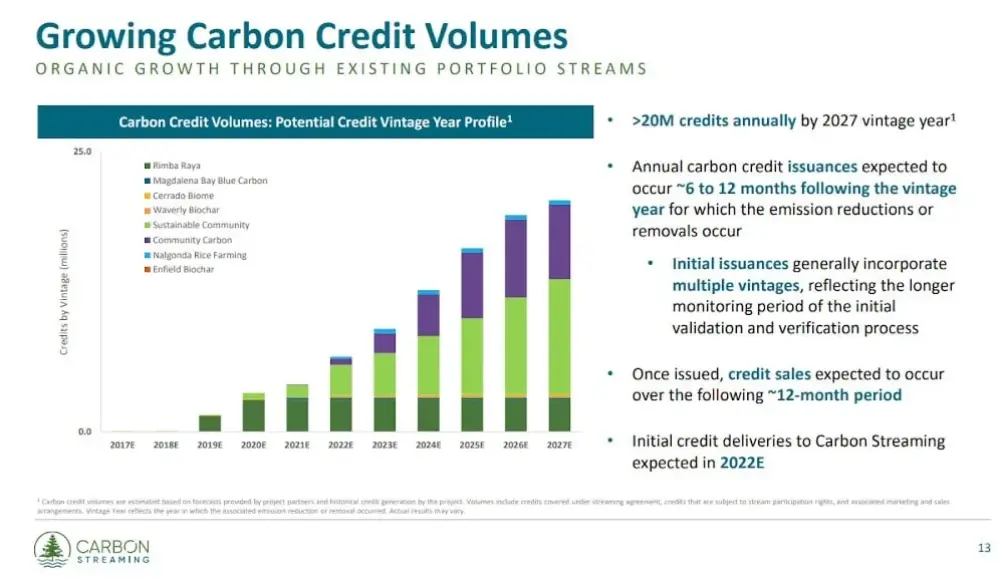
CarbonCredits.com highlighted Carbon Streaming Corp. as one of its Top 4 Carbon Stocks To Watch in 2024. The company, the first of its kind in the carbon credit market, “expects moderate and then rapid growth of credits in the coming years, peaking near 20 million (20M) credits per year by 2027,” the article indicated. “Its unique business model could help it outperform the competition.”
On June 7, Jack Gilleland of the American Association of Individual Investors gave Carbon Streaming Corp. a Value Score of 62, which, according to the article, he considers good.
According to Reuters, management and insiders hold 6.5% or 3.12M shares of Carbon Streaming. In this category, Ross Beaty owns 2.9%, or 1.39M shares.
The company has one institutional investor, Black Diamond Asset Management Inc., which holds 0.02%, or 0.01M shares.
The rest of the company, 93.48%, is with retail.
Carbon Streaming has 47.97M shares outstanding and 44.85M free float traded shares.
Its market cap is CA$31.51M. Its stock price range over the past 52 weeks was CA$0.46−$1.47 per share.
Another carbon credit streamer striving to be transparent is Key Carbon. Headquartered in Vancouver, British Columbia, this private company finances and supports developers of carbon projects around the world and is building a diversified portfolio of carbon credit streams and royalties. Corporations and other entities may purchase Key Carbon’s voluntary carbon credits to help them achieve their climate and sustainability goals.
“We will be a large environmental services company,” Luke Leslie, co-founder and chief executive officer of Key Carbon Ltd., told Streetwise Reports. “We want to do that to service these projects in a way others can’t, with cutting-edge monitoring systems to provide the data to better understand the impact.”
How it works is Key Carbon selectively chooses a carbon project after rigorously vetting its developer. The company pays the developer upfront in return for a portion of future carbon credits, as defined in an exclusive financing agreement created by Key Carbon. It receives the credits once an independent third party, such as Verra, verifies the project. Then Key Carbon sells the credits to corporations or groups that need them to offset their carbon emissions. Key Carbon also continues to support the developer with strategy and operational improvements.
Current partners of Key Carbon include BURN, Africa’s leading clean cooking company, and Worldview International Foundation, a nonprofit organization that has pioneered 680 sustainable development projects in 26 countries.
BURN is a small project with a big impact, in which Key Carbon has invested US$36M. Through BURN, they provide fuel-efficient cookstoves to families cooking on open fires, a practice that has caused 4M premature deaths, noted Leslie. Cookstoves use less fuel, are safer, and free up users’ time.
Key Carbon’s work with Worldview is an example of a higher-value project that Key Carbon has helped fund. This project consists of reforestation of native trees, specifically mangroves.
With Key Carbon’s portfolio, an estimated 41.2 million tons of carbon will be removed or avoided, according to the company’s website.
The types of projects Key Carbon could partner on are numerous, Leslie said, given that “the carbon markets have 200 ways to generate carbon credit.”
As for catalysts, Key Carbon will close a US$15M financing this month, moving it closer to its goal of raising US$100M by year-end, Leslie said. The company is continuing to build out direct sales channels and acquire biodiversity businesses. Also, of course, additional partnerships and project deals could also move the stock.
Carbon Industry Surviving
While so-called “carbon cowboys” may have sullied the name of carbon credits, these three companies, Base Carbon, Carbon Streaming, and Key Carbon, and growth forecasts might be showing that the carbon credits industry is surviving the negative aspects is very much alive, and is expanding.
These companies are working to ensure transparency and efficiency within the companies and to create a sustainable army in the fight against the climate crisis.
Important Disclosures:
As of the date of this article, officers and/or employees of Streetwise Reports LLC (including members of their household) own securities of Key Carbon Ltd.
Doresa Banning and Katherine DeGilio wrote this article for Streetwise Reports LLC and provide services to Streetwise Reports as an independent contractor/employee.
This article does not constitute investment advice and is not a solicitation for any investment. Streetwise Reports does not render general or specific investment advice and the information on Streetwise Reports should not be considered a recommendation to buy or sell any security. Each reader is encouraged to consult with his or her personal financial adviser and perform their own comprehensive investment research. By opening this page, each reader accepts and agrees to Streetwise Reports’ terms of use and full legal disclaimer. Streetwise Reports does not endorse or recommend the business, products, services or securities of any company.
All prime ministers bring their own personality and approach to the job. Each has a different style of leadership, which can shape how things work and what gets done. Herbert Asquith famously summed it up when he said being prime minister is all about “what the holder chooses and is able to make of it”.
When searching for clues as to how Keir Starmer will choose to be Britain’s prime minister, there isn’t too much to go on. When asked directly on a recent podcast, he declared “an inclusive, determined prime minister who will look out for everyone in the country”. This only takes us so far, as it’s rather hard to imagine anyone saying the opposite (except, perhaps, Nigel Farage). But sifting through what we know, we can at least make a start at piecing together the puzzle.
In terms of his personality and approach, Starmer has been described as “methodical, professional, good on detail but lacking in flair”. He is very likely to be what the late MP and historian David Marquand called a “pragmatic operator”. Not for Starmer the visionary appeal or oratory fireworks of a Tony Blair or Harold Wilson. But nor is he simply a “machine politician”.
Starmer comes across as a quiet, experienced man, who speaks of values and of being a socialist (though the public are unsure if he is, or if that’s a good or bad thing). He can justifiably say he has a more authentic working-class background than many of his predecessors.
We do know that Starmer only became a member of parliament in 2015, so, at 52, was a relative latecomer to politics. He has spent the entirety of his political career in opposition. His predecessors, going back to Theresa May, came to the role with substantial experience of being a government minister (though, you may point out, it didn’t do them much good).
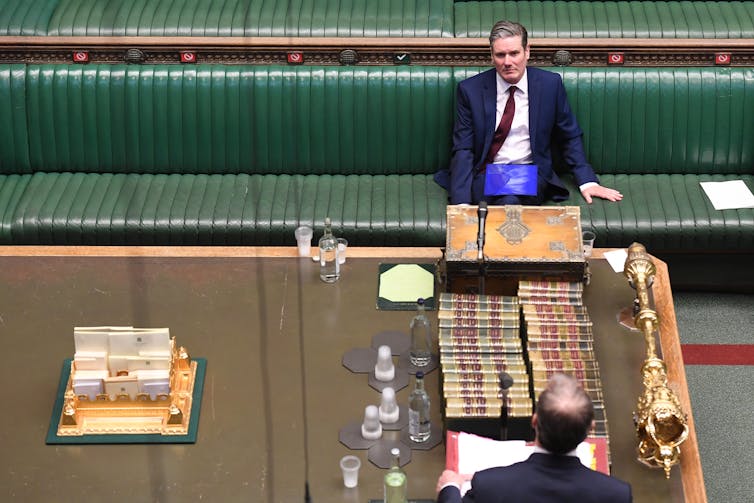
Starmer attends a socially distanced PMQs during the pandemic. Flicker/UK Parliament, CC BY-NC
Yet Starmer’s time in parliament has been more intense than most. He was deeply involved in Brexit, and then led his party during the pandemic. As leader of the opposition, he saw two prime ministers removed in quick succession (and played a large role in removing at least one, with his methodical lawyer’s approach). Now, he has taken down a third.
Man on a mission
Importantly, Starmer has led what is effectively a large government department. His five years as director of public prosecutions (DPP) means he comes into Number 10 as an experienced leader having, rather unusually, run a state organisation before his political career had even begun.
Starmer’s experience as DPP implies an emphasis on delivering. We can expect him to focus on fixing problems, finding solutions, and getting things done. We can also perhaps expect more emphasis on outcomes and an end to the politicisation and battles with the bureaucratic machinery of government that characterised the previous administration.
It has been suggested that Starmer’s will be a mission-led government, organised around a set of guiding, longer-term missions with the goal of delivering certainty and sustained change. This idea is not new or particularly radical but it may appear so after the seeming chaos and short-termism of recent years.
How, and how swiftly, decisions are made – or not made – will be the crucial test. Starmer’s apparent indecision over the net zero agenda could be the shape of things to come. Being methodical and interested in detail can be shorthand for delay and indecision.
He has hinted at being a consultative leader: “The best decisions I’ve made in my life were those held up to the light and that survived scrutiny. The worst were when nobody said ‘boo’”. However his penchant for “undersharing”, as noted by his deputy Angela Rayner, may mean he keeps decision-making concentrated in a small group of confidants.
Man of mystery
A Starmer-led government is likely, especially with a large parliamentary majority, to be empowered to make changes. As a self-described socialist and progressive, Starmer can hardly avoid it. But how radical will he be? One former Labour minister spoke of how “he is very impressive, but he never strays too far beyond the boundaries. Even when he was a radical lawyer, he was one of a conventional sort.”
But one truism of political leadership is that what begins as a strength ends as a weakness. Lots of the fault lines within the Labour party are already visible, from child poverty to Gaza. Other issues are bubbling away. Starmer’s ability to float above the fray can’t last, and there are likely to be plots and challenges (especially if a large majority means underemployed backbenchers).
Here, Starmer sits within perhaps another classic dilemma of the Labour party and of Labour prime ministers: what David Marquand called the “progressive dilemma”, namely how far can you, and do you, push change, without stretching the support of the broad coalition who put you in the job? The approach has so far been caution, supported by a disciplined shadow cabinet, but a large majority may transform the situation.
Yet other leaders have made huge changes quietly. Theresa May, for example, pushed through a net zero law so silently that “nobody even noticed the Tories’ biggest legacy”.
However, to revisit the warning of Asquith, being prime minister is about what a leader is “able” to do. Events blow all governments off course, and plenty have been overwhelmed by crises. Starmer would do well to heed the warning of boxer Mike Tyson that “everyone has a plan until they get punched in the mouth”.
After his win, there is a weight of expectation on Starmer. But trust in all politicians is low and damaged. There will be pressing domestic issues over migration, public service funding, and the NHS. Abroad, as one Labour advisor warned, there is a “stormy world” from Gaza and Ukraine to the US election. The true test of what Prime Minister Starmer may be is when his methodical approach meets a messy world.
Here are the latest charts and statistics for the Commitment of Traders (COT) data published by the Commodities Futures Trading Commission (CFTC).
The latest COT data is updated through Tuesday July 9th and shows a quick view of how large market participants (for-profit speculators and commercial traders) were positioned in the futures markets. All currency positions are in direct relation to the US dollar where, for example, a bet for the euro is a bet that the euro will rise versus the dollar while a bet against the euro will be a bet that the euro will decline versus the dollar.
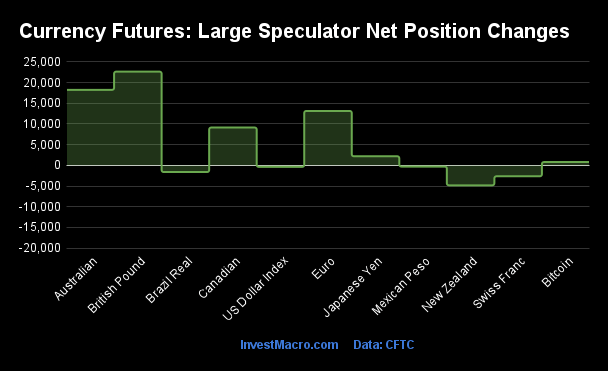
Weekly Speculator Changes led by British Pound & Australian Dollar
The COT currency market speculator bets were higher this week as six out of the eleven currency markets we cover had higher positioning while the other five markets had lower speculator contracts.
Leading the gains for the currency markets was the British Pound (22,649 contracts) with the Australian Dollar (18,249 contracts), the EuroFX (13,142 contracts), the Canadian Dollar (9,140 contracts), the Japanese Yen (2,190 contracts) and Bitcoin (794 contracts) also showing positive weeks.
The currencies seeing declines in speculator bets on the week were the New Zealand Dollar (-4,831 contracts), the Swiss Franc (-2,645 contracts), the Brazilian Real (-1,624 contracts), the US Dollar Index (-374 contracts) and with the Mexican Peso (-304 contracts) also seeing lower bets on the week.
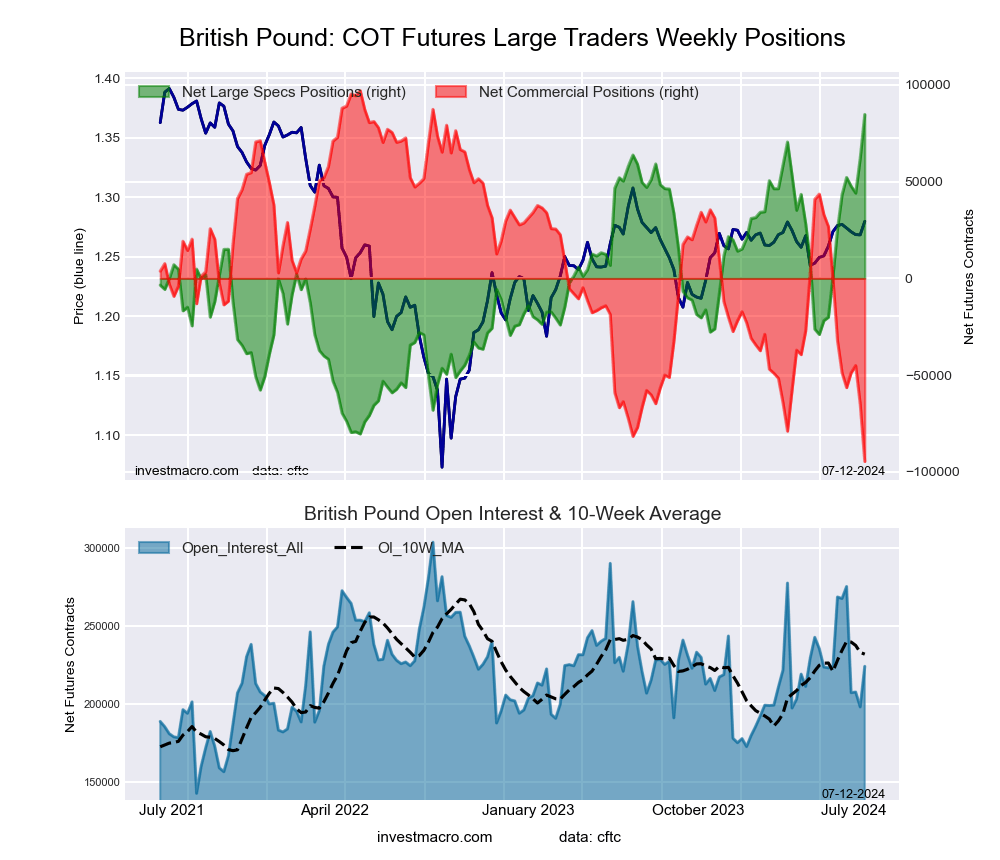
Currency Speculators boost their British Pound bets to highest since 2007
Highlighting this week’s COT currency data is the strong gains in the speculator positioning for the British Pound Sterling (GBP). The Pound Sterling speculative positioning increased this week for a second straight week – jumping by a total of +22,649 contracts following last week’s +17,993 contract gain.
The GBP speculator position has risen for the eighth time out of the past ten weeks for a ten-week gain of +113,680 contracts that has taken the net standing from a total of -28,990 contracts on April 30th to a total of +84,690 contracts this week.
The GBP speculator position is now at the most bullish level in the past 886 weeks, dating back all the way to July 17th of 2007 when the GBP net position hit a record high of +98,366 contracts.
The British Pound’s exchange rate with the US Dollar has been in an uptrend since hitting a recent low in April. The GBP has climbed strongly over the past two weeks and closed out this week at just a touch under the 1.3000 psychological resistance level. This is the highest weekly close for the GBPUSD currency pair since July of 2023 and the first close above the 200-week moving average since that time as well.
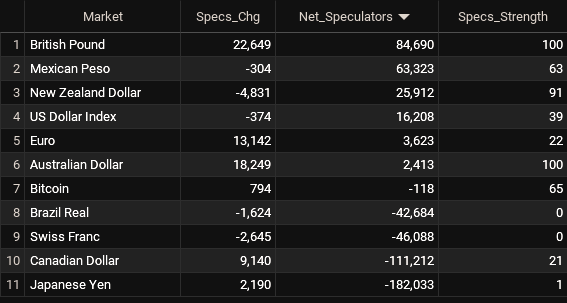
Currencies Net Speculators Leaderboard
Legend: Weekly Speculators Change | Speculators Current Net Position | Speculators Strength Score compared to last 3-Years (0-100 range)
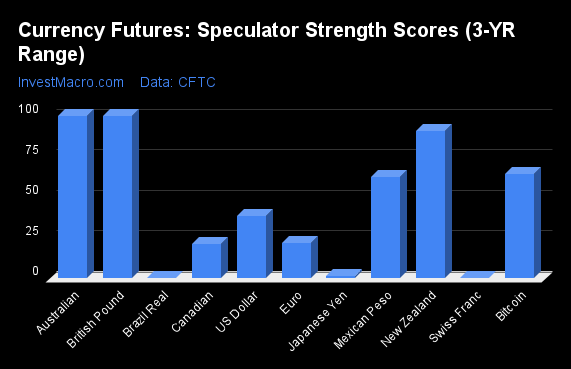
Strength Scores led by British Pound & Australian Dollar
COT Strength Scores (a normalized measure of Speculator positions over a 3-Year range, from 0 to 100 where above 80 is Extreme-Bullish and below 20 is Extreme-Bearish) showed that the British Pound (100 percent) and the Australian Dollar (100 percent) lead the currency markets this week. The New Zealand Dollar (91 percent), Bitcoin (65 percent) and the Mexican Peso (63 percent) come in as the next highest in the weekly strength scores.
On the downside, the Brazilian Real (0 percent), the Swiss Franc (0 percent) and the Japanese Yen (1 percent) come in at the lowest strength levels currently and are in Extreme-Bearish territory (below 20 percent).
Strength Statistics: US Dollar Index (38.6 percent) vs US Dollar Index previous week (39.4 percent) EuroFX (21.9 percent) vs EuroFX previous week (16.3 percent) British Pound Sterling (100.0 percent) vs British Pound Sterling previous week (86.3 percent) Japanese Yen (1.3 percent) vs Japanese Yen previous week (0.0 percent) Swiss Franc (0.0 percent) vs Swiss Franc previous week (4.7 percent) Canadian Dollar (21.0 percent) vs Canadian Dollar previous week (15.8 percent) Australian Dollar (100.0 percent) vs Australian Dollar previous week (83.4 percent) New Zealand Dollar (90.7 percent) vs New Zealand Dollar previous week (100.0 percent) Mexican Peso (62.5 percent) vs Mexican Peso previous week (62.7 percent) Brazilian Real (0.0 percent) vs Brazilian Real previous week (1.7 percent) Bitcoin (64.6 percent) vs Bitcoin previous week (52.7 percent)
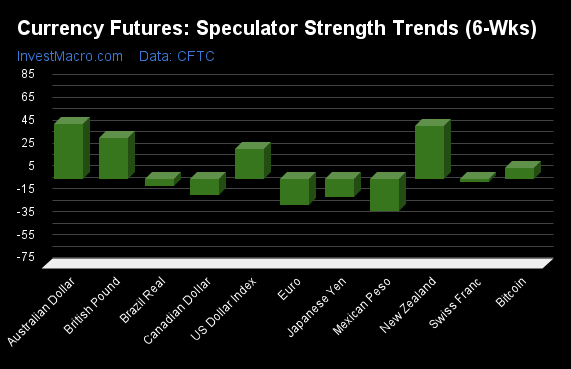
Australian Dollar & New Zealand Dollar top the 6-Week Strength Trends
COT Strength Score Trends (or move index, calculates the 6-week changes in strength scores) showed that the Australian Dollar (48 percent) and the New Zealand Dollar (46 percent) lead the past six weeks trends for the currencies. The British Pound (36 percent), the US Dollar Index (26 percent) and Bitcoin (10 percent) are the next highest positive movers in the latest trends data.
The Mexican Peso (-28 percent) leads the downside trend scores currently with the EuroFX (-23 percent), Japanese Yen (-16 percent) and the Canadian Dollar (-14 percent) following next with lower trend scores.
Strength Trend Statistics: US Dollar Index (25.7 percent) vs US Dollar Index previous week (27.9 percent) EuroFX (-23.0 percent) vs EuroFX previous week (-21.7 percent) British Pound Sterling (35.9 percent) vs British Pound Sterling previous week (36.9 percent) Japanese Yen (-15.8 percent) vs Japanese Yen previous week (-24.3 percent) Swiss Franc (-3.1 percent) vs Swiss Franc previous week (-5.0 percent) Canadian Dollar (-14.1 percent) vs Canadian Dollar previous week (-16.9 percent) Australian Dollar (47.6 percent) vs Australian Dollar previous week (36.7 percent) New Zealand Dollar (45.9 percent) vs New Zealand Dollar previous week (61.7 percent) Mexican Peso (-28.3 percent) vs Mexican Peso previous week (-26.6 percent) Brazilian Real (-6.5 percent) vs Brazilian Real previous week (-3.7 percent) Bitcoin (9.6 percent) vs Bitcoin previous week (-0.3 percent)
Individual COT Forex Markets:
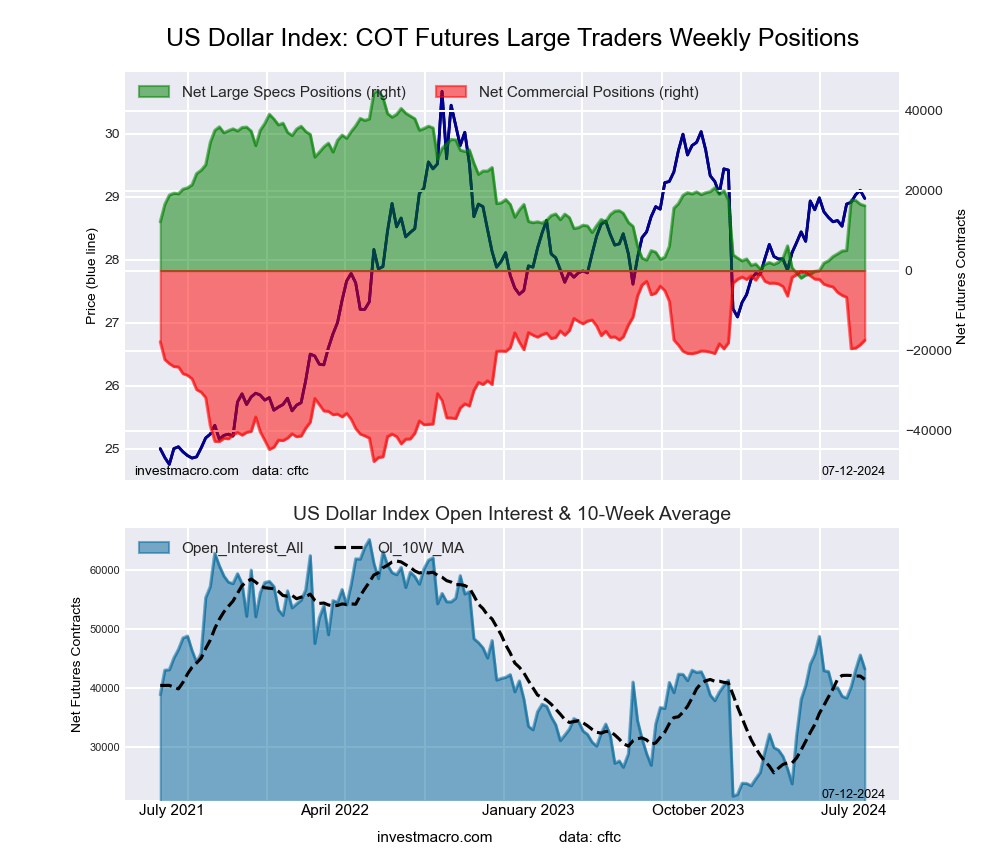
US Dollar Index Futures:
The US Dollar Index large speculator standing this week reached a net position of 16,208 contracts in the data reported through Tuesday. This was a weekly decline of -374 contracts from the previous week which had a total of 16,582 net contracts.
This week’s current strength score (the trader positioning range over the past three years, measured from 0 to 100) shows the speculators are currently Bearish with a score of 38.6 percent. The commercials are Bullish with a score of 63.9 percent and the small traders (not shown in chart) are Bearish with a score of 25.3 percent.
Price Trend-Following Model: Uptrend
Our weekly trend-following model classifies the current market price position as: Uptrend. The current action for the model is considered to be: Hold – Maintain Long Position.
US DOLLAR INDEX Statistics
SPECULATORS
COMMERCIALS
SMALL TRADERS
– Percent of Open Interest Longs:
70.7
18.0
7.4
– Percent of Open Interest Shorts:
33.2
58.2
4.6
– Net Position:
16,208
-17,419
1,211
– Gross Longs:
30,587
7,769
3,200
– Gross Shorts:
14,379
25,188
1,989
– Long to Short Ratio:
2.1 to 1
0.3 to 1
1.6 to 1
NET POSITION TREND:
– Strength Index Score (3 Year Range Pct):
38.6
63.9
25.3
– Strength Index Reading (3 Year Range):
Bearish
Bullish
Bearish
NET POSITION MOVEMENT INDEX:
– 6-Week Change in Strength Index:
25.7
-25.3
-0.6
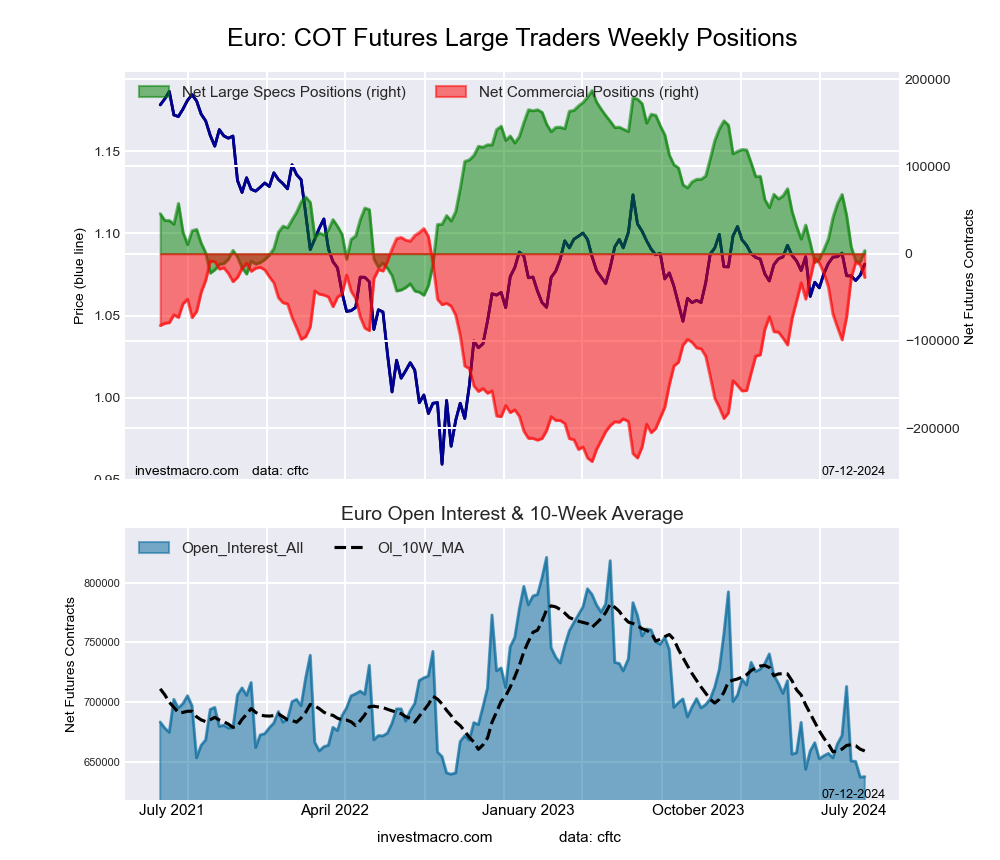
Euro Currency Futures:
The Euro Currency large speculator standing this week reached a net position of 3,623 contracts in the data reported through Tuesday. This was a weekly lift of 13,142 contracts from the previous week which had a total of -9,519 net contracts.
This week’s current strength score (the trader positioning range over the past three years, measured from 0 to 100) shows the speculators are currently Bearish with a score of 21.9 percent. The commercials are Bullish with a score of 79.0 percent and the small traders (not shown in chart) are Bearish with a score of 23.8 percent.
Price Trend-Following Model: Weak Downtrend
Our weekly trend-following model classifies the current market price position as: Weak Downtrend. The current action for the model is considered to be: Hold – Maintain Short Position.
EURO Currency Statistics
SPECULATORS
COMMERCIALS
SMALL TRADERS
– Percent of Open Interest Longs:
26.0
58.9
11.8
– Percent of Open Interest Shorts:
25.5
63.2
8.1
– Net Position:
3,623
-27,239
23,616
– Gross Longs:
165,829
375,248
75,272
– Gross Shorts:
162,206
402,487
51,656
– Long to Short Ratio:
1.0 to 1
0.9 to 1
1.5 to 1
NET POSITION TREND:
– Strength Index Score (3 Year Range Pct):
21.9
79.0
23.8
– Strength Index Reading (3 Year Range):
Bearish
Bullish
Bearish
NET POSITION MOVEMENT INDEX:
– 6-Week Change in Strength Index:
-23.0
21.5
-7.9
British Pound Sterling Futures:
The British Pound Sterling large speculator standing this week reached a net position of 84,690 contracts in the data reported through Tuesday. This was a weekly gain of 22,649 contracts from the previous week which had a total of 62,041 net contracts.
This week’s current strength score (the trader positioning range over the past three years, measured from 0 to 100) shows the speculators are currently Bullish-Extreme with a score of 100.0 percent. The commercials are Bearish-Extreme with a score of 0.0 percent and the small traders (not shown in chart) are Bullish-Extreme with a score of 83.0 percent.
Price Trend-Following Model: Strong Uptrend
Our weekly trend-following model classifies the current market price position as: Strong Uptrend. The current action for the model is considered to be: Hold – Maintain Long Position.
BRITISH POUND Statistics
SPECULATORS
COMMERCIALS
SMALL TRADERS
– Percent of Open Interest Longs:
60.4
20.6
15.5
– Percent of Open Interest Shorts:
22.6
62.8
11.1
– Net Position:
84,690
-94,586
9,896
– Gross Longs:
135,316
46,249
34,670
– Gross Shorts:
50,626
140,835
24,774
– Long to Short Ratio:
2.7 to 1
0.3 to 1
1.4 to 1
NET POSITION TREND:
– Strength Index Score (3 Year Range Pct):
100.0
0.0
83.0
– Strength Index Reading (3 Year Range):
Bullish-Extreme
Bearish-Extreme
Bullish-Extreme
NET POSITION MOVEMENT INDEX:
– 6-Week Change in Strength Index:
35.9
-32.6
6.6
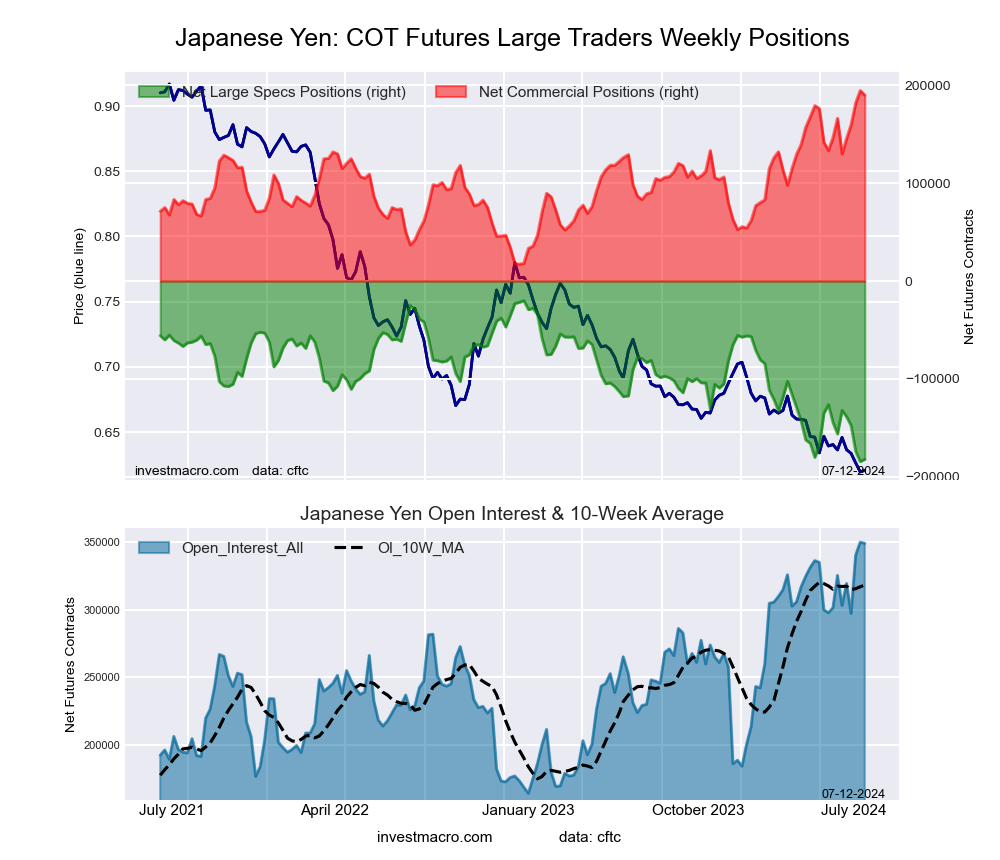
Japanese Yen Futures:
The Japanese Yen large speculator standing this week reached a net position of -182,033 contracts in the data reported through Tuesday. This was a weekly rise of 2,190 contracts from the previous week which had a total of -184,223 net contracts.
This week’s current strength score (the trader positioning range over the past three years, measured from 0 to 100) shows the speculators are currently Bearish-Extreme with a score of 1.3 percent. The commercials are Bullish-Extreme with a score of 97.4 percent and the small traders (not shown in chart) are Bullish with a score of 58.0 percent.
Price Trend-Following Model: Downtrend
Our weekly trend-following model classifies the current market price position as: Downtrend. The current action for the model is considered to be: Hold – Maintain Short Position.
JAPANESE YEN Statistics
SPECULATORS
COMMERCIALS
SMALL TRADERS
– Percent of Open Interest Longs:
11.9
73.8
11.9
– Percent of Open Interest Shorts:
64.1
19.4
14.1
– Net Position:
-182,033
189,867
-7,834
– Gross Longs:
41,521
257,455
41,519
– Gross Shorts:
223,554
67,588
49,353
– Long to Short Ratio:
0.2 to 1
3.8 to 1
0.8 to 1
NET POSITION TREND:
– Strength Index Score (3 Year Range Pct):
1.3
97.4
58.0
– Strength Index Reading (3 Year Range):
Bearish-Extreme
Bullish-Extreme
Bullish
NET POSITION MOVEMENT INDEX:
– 6-Week Change in Strength Index:
-15.8
13.4
7.1
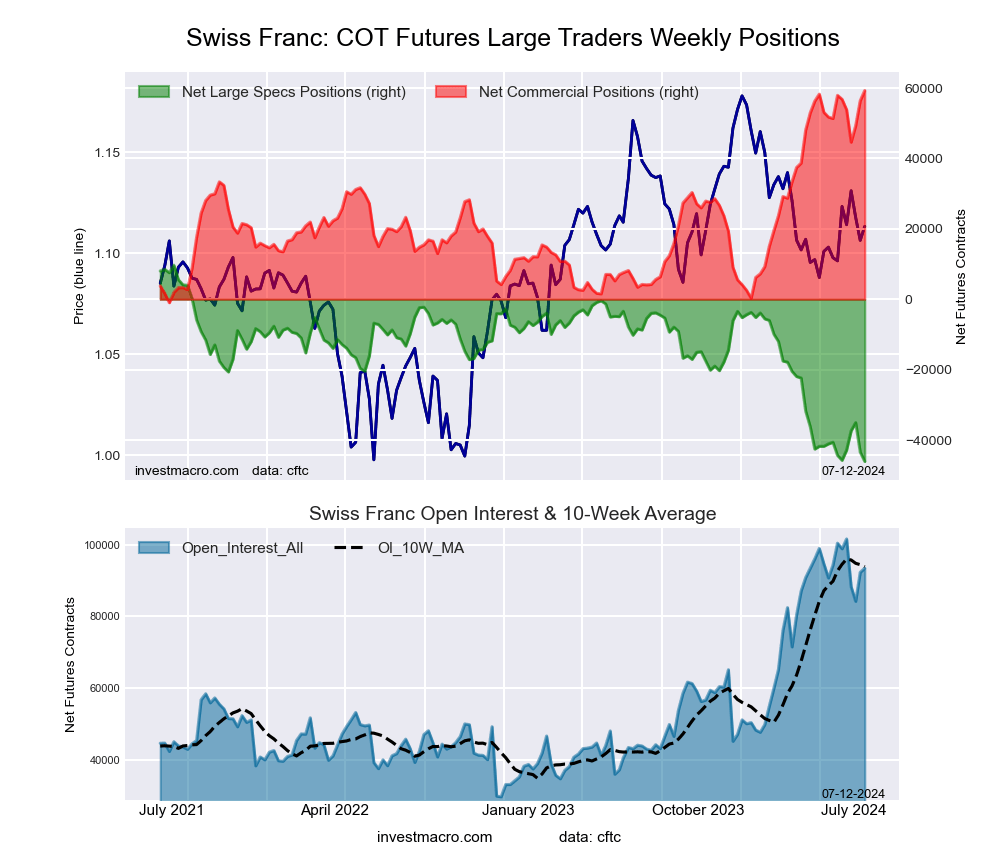
Swiss Franc Futures:
The Swiss Franc large speculator standing this week reached a net position of -46,088 contracts in the data reported through Tuesday. This was a weekly fall of -2,645 contracts from the previous week which had a total of -43,443 net contracts.
This week’s current strength score (the trader positioning range over the past three years, measured from 0 to 100) shows the speculators are currently Bearish-Extreme with a score of 0.0 percent. The commercials are Bullish-Extreme with a score of 100.0 percent and the small traders (not shown in chart) are Bearish-Extreme with a score of 17.2 percent.
Price Trend-Following Model: Weak Downtrend
Our weekly trend-following model classifies the current market price position as: Weak Downtrend. The current action for the model is considered to be: Hold – Maintain Short Position.
SWISS FRANC Statistics
SPECULATORS
COMMERCIALS
SMALL TRADERS
– Percent of Open Interest Longs:
5.7
83.3
10.4
– Percent of Open Interest Shorts:
55.0
19.9
24.6
– Net Position:
-46,088
59,298
-13,210
– Gross Longs:
5,338
77,860
9,743
– Gross Shorts:
51,426
18,562
22,953
– Long to Short Ratio:
0.1 to 1
4.2 to 1
0.4 to 1
NET POSITION TREND:
– Strength Index Score (3 Year Range Pct):
0.0
100.0
17.2
– Strength Index Reading (3 Year Range):
Bearish-Extreme
Bullish-Extreme
Bearish-Extreme
NET POSITION MOVEMENT INDEX:
– 6-Week Change in Strength Index:
-3.1
2.3
1.6
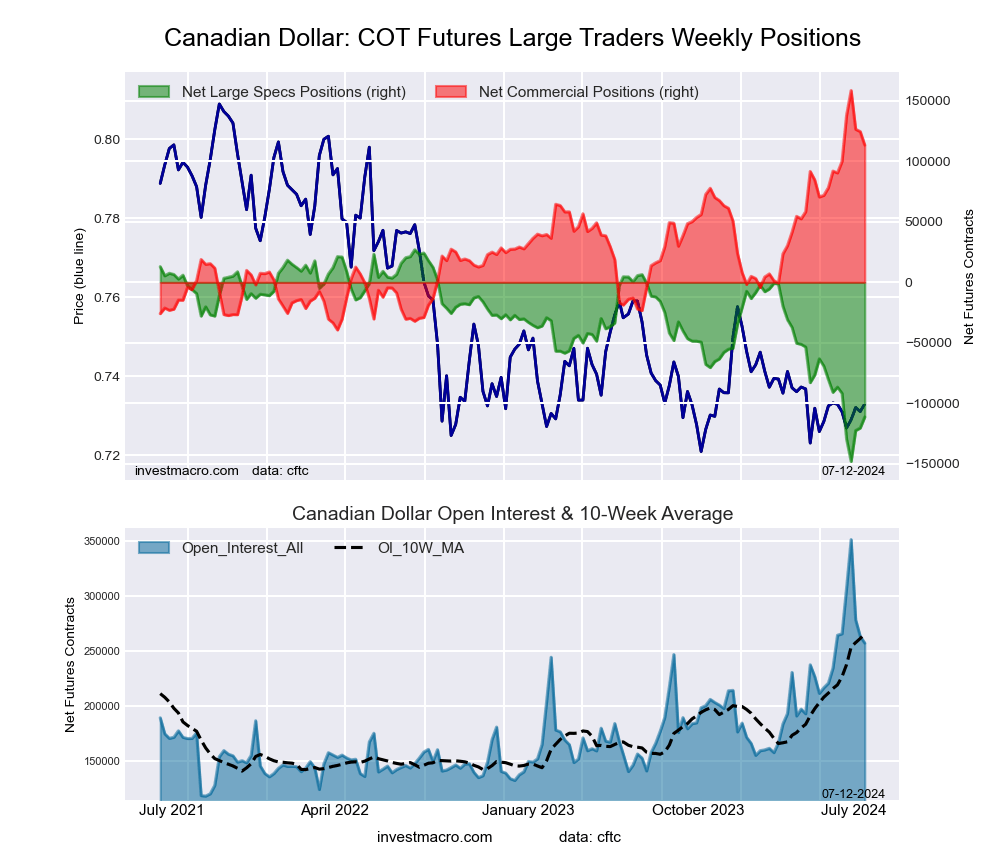
Canadian Dollar Futures:
The Canadian Dollar large speculator standing this week reached a net position of -111,212 contracts in the data reported through Tuesday. This was a weekly advance of 9,140 contracts from the previous week which had a total of -120,352 net contracts.
This week’s current strength score (the trader positioning range over the past three years, measured from 0 to 100) shows the speculators are currently Bearish with a score of 21.0 percent. The commercials are Bullish with a score of 77.2 percent and the small traders (not shown in chart) are Bearish with a score of 24.6 percent.
Price Trend-Following Model: Weak Downtrend
Our weekly trend-following model classifies the current market price position as: Weak Downtrend. The current action for the model is considered to be: Hold – Maintain Short Position.
CANADIAN DOLLAR Statistics
SPECULATORS
COMMERCIALS
SMALL TRADERS
– Percent of Open Interest Longs:
7.9
77.0
12.3
– Percent of Open Interest Shorts:
51.1
33.0
13.1
– Net Position:
-111,212
113,308
-2,096
– Gross Longs:
20,263
198,168
31,676
– Gross Shorts:
131,475
84,860
33,772
– Long to Short Ratio:
0.2 to 1
2.3 to 1
0.9 to 1
NET POSITION TREND:
– Strength Index Score (3 Year Range Pct):
21.0
77.2
24.6
– Strength Index Reading (3 Year Range):
Bearish
Bullish
Bearish
NET POSITION MOVEMENT INDEX:
– 6-Week Change in Strength Index:
-14.1
11.6
4.9
Australian Dollar Futures:
The Australian Dollar large speculator standing this week reached a net position of 2,413 contracts in the data reported through Tuesday. This was a weekly advance of 18,249 contracts from the previous week which had a total of -15,836 net contracts.
This week’s current strength score (the trader positioning range over the past three years, measured from 0 to 100) shows the speculators are currently Bullish-Extreme with a score of 100.0 percent. The commercials are Bearish-Extreme with a score of 0.0 percent and the small traders (not shown in chart) are Bullish-Extreme with a score of 85.1 percent.
Price Trend-Following Model: Strong Uptrend
Our weekly trend-following model classifies the current market price position as: Strong Uptrend. The current action for the model is considered to be: Hold – Maintain Long Position.
AUSTRALIAN DOLLAR Statistics
SPECULATORS
COMMERCIALS
SMALL TRADERS
– Percent of Open Interest Longs:
44.0
39.6
13.5
– Percent of Open Interest Shorts:
42.9
45.0
9.1
– Net Position:
2,413
-12,132
9,719
– Gross Longs:
98,997
89,192
30,274
– Gross Shorts:
96,584
101,324
20,555
– Long to Short Ratio:
1.0 to 1
0.9 to 1
1.5 to 1
NET POSITION TREND:
– Strength Index Score (3 Year Range Pct):
100.0
0.0
85.1
– Strength Index Reading (3 Year Range):
Bullish-Extreme
Bearish-Extreme
Bullish-Extreme
NET POSITION MOVEMENT INDEX:
– 6-Week Change in Strength Index:
47.6
-47.4
25.0
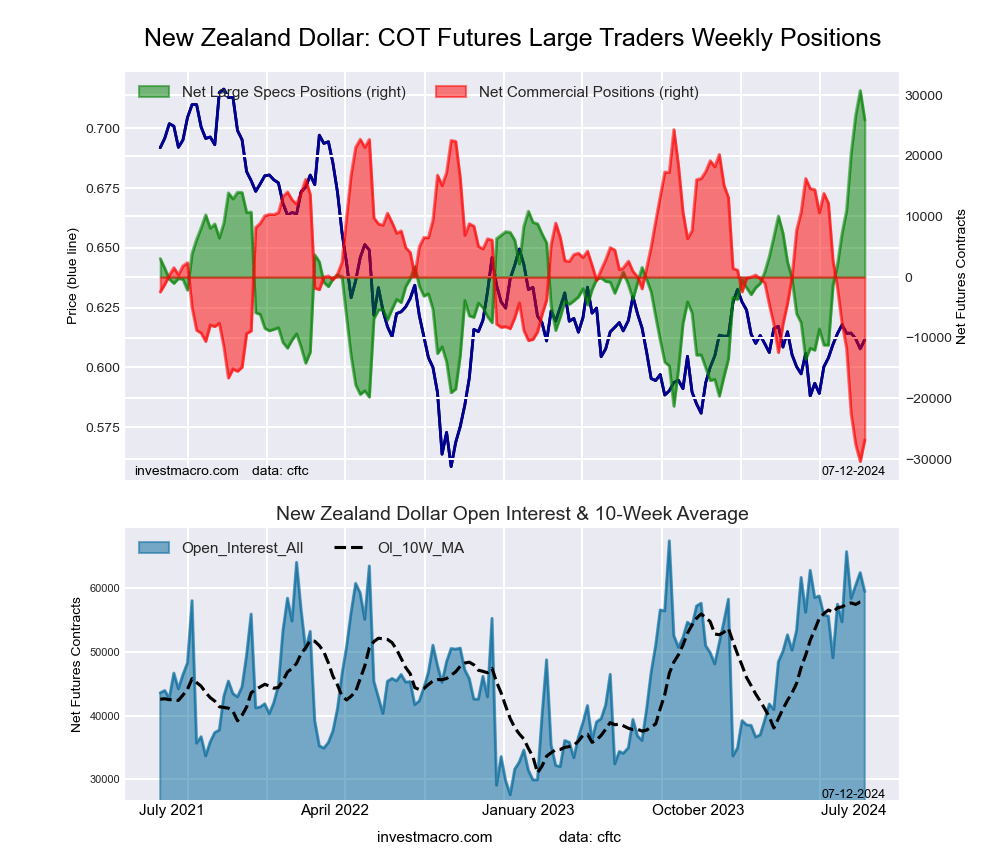
New Zealand Dollar Futures:
The New Zealand Dollar large speculator standing this week reached a net position of 25,912 contracts in the data reported through Tuesday. This was a weekly reduction of -4,831 contracts from the previous week which had a total of 30,743 net contracts.
This week’s current strength score (the trader positioning range over the past three years, measured from 0 to 100) shows the speculators are currently Bullish-Extreme with a score of 90.7 percent. The commercials are Bearish-Extreme with a score of 6.5 percent and the small traders (not shown in chart) are Bullish with a score of 71.2 percent.
Price Trend-Following Model: Strong Uptrend
Our weekly trend-following model classifies the current market price position as: Strong Uptrend. The current action for the model is considered to be: Hold – Maintain Long Position.
NEW ZEALAND DOLLAR Statistics
SPECULATORS
COMMERCIALS
SMALL TRADERS
– Percent of Open Interest Longs:
70.0
18.7
7.1
– Percent of Open Interest Shorts:
26.5
63.8
5.6
– Net Position:
25,912
-26,828
916
– Gross Longs:
41,683
11,129
4,250
– Gross Shorts:
15,771
37,957
3,334
– Long to Short Ratio:
2.6 to 1
0.3 to 1
1.3 to 1
NET POSITION TREND:
– Strength Index Score (3 Year Range Pct):
90.7
6.5
71.2
– Strength Index Reading (3 Year Range):
Bullish-Extreme
Bearish-Extreme
Bullish
NET POSITION MOVEMENT INDEX:
– 6-Week Change in Strength Index:
45.9
-45.8
16.5
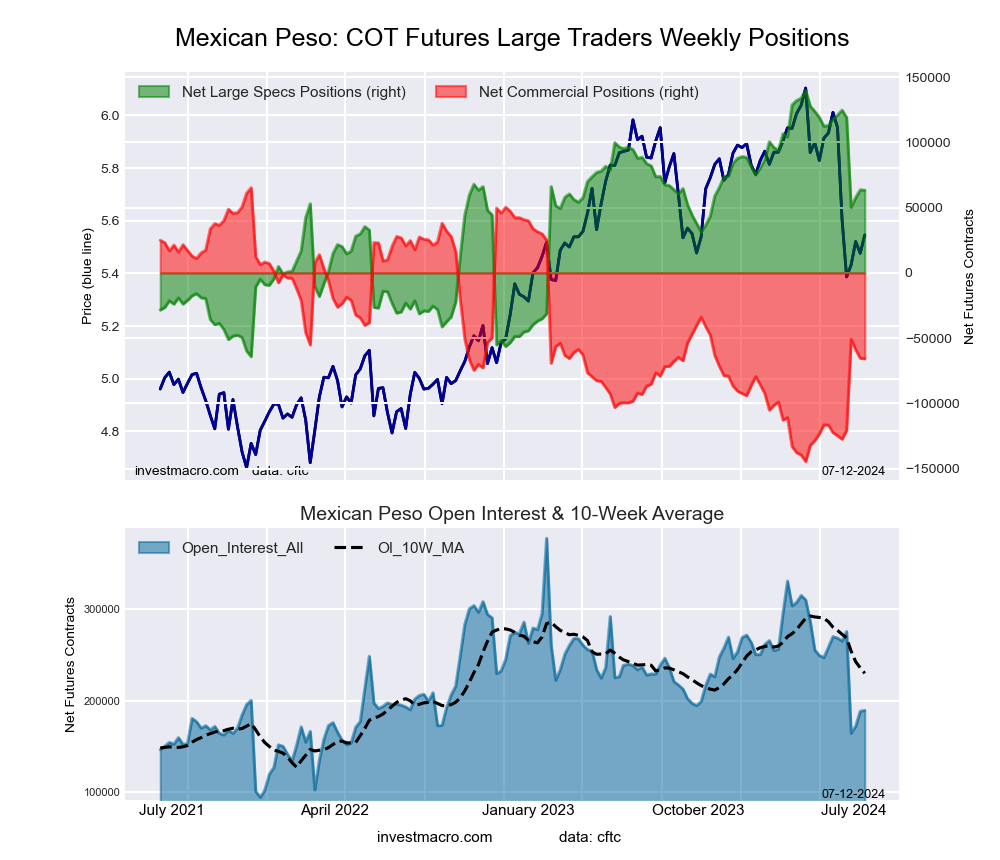
Mexican Peso Futures:
The Mexican Peso large speculator standing this week reached a net position of 63,323 contracts in the data reported through Tuesday. This was a weekly decline of -304 contracts from the previous week which had a total of 63,627 net contracts.
This week’s current strength score (the trader positioning range over the past three years, measured from 0 to 100) shows the speculators are currently Bullish with a score of 62.5 percent. The commercials are Bearish with a score of 37.5 percent and the small traders (not shown in chart) are Bearish with a score of 26.6 percent.
Price Trend-Following Model: Downtrend
Our weekly trend-following model classifies the current market price position as: Downtrend. The current action for the model is considered to be: Hold – Maintain Short Position.
MEXICAN PESO Statistics
SPECULATORS
COMMERCIALS
SMALL TRADERS
– Percent of Open Interest Longs:
50.6
45.1
3.2
– Percent of Open Interest Shorts:
17.1
79.9
2.0
– Net Position:
63,323
-65,743
2,420
– Gross Longs:
95,748
85,441
6,150
– Gross Shorts:
32,425
151,184
3,730
– Long to Short Ratio:
3.0 to 1
0.6 to 1
1.6 to 1
NET POSITION TREND:
– Strength Index Score (3 Year Range Pct):
62.5
37.5
26.6
– Strength Index Reading (3 Year Range):
Bullish
Bearish
Bearish
NET POSITION MOVEMENT INDEX:
– 6-Week Change in Strength Index:
-28.3
28.1
-8.7
Brazilian Real Futures:
The Brazilian Real large speculator standing this week reached a net position of -42,684 contracts in the data reported through Tuesday. This was a weekly lowering of -1,624 contracts from the previous week which had a total of -41,060 net contracts.
This week’s current strength score (the trader positioning range over the past three years, measured from 0 to 100) shows the speculators are currently Bearish-Extreme with a score of 0.0 percent. The commercials are Bullish-Extreme with a score of 100.0 percent and the small traders (not shown in chart) are Bearish with a score of 27.9 percent.
Price Trend-Following Model: Downtrend
Our weekly trend-following model classifies the current market price position as: Downtrend. The current action for the model is considered to be: Hold – Maintain Short Position.
BRAZIL REAL Statistics
SPECULATORS
COMMERCIALS
SMALL TRADERS
– Percent of Open Interest Longs:
26.6
70.9
2.2
– Percent of Open Interest Shorts:
75.2
21.4
3.0
– Net Position:
-42,684
43,388
-704
– Gross Longs:
23,319
62,170
1,919
– Gross Shorts:
66,003
18,782
2,623
– Long to Short Ratio:
0.4 to 1
3.3 to 1
0.7 to 1
NET POSITION TREND:
– Strength Index Score (3 Year Range Pct):
0.0
100.0
27.9
– Strength Index Reading (3 Year Range):
Bearish-Extreme
Bullish-Extreme
Bearish
NET POSITION MOVEMENT INDEX:
– 6-Week Change in Strength Index:
-6.5
6.3
0.1
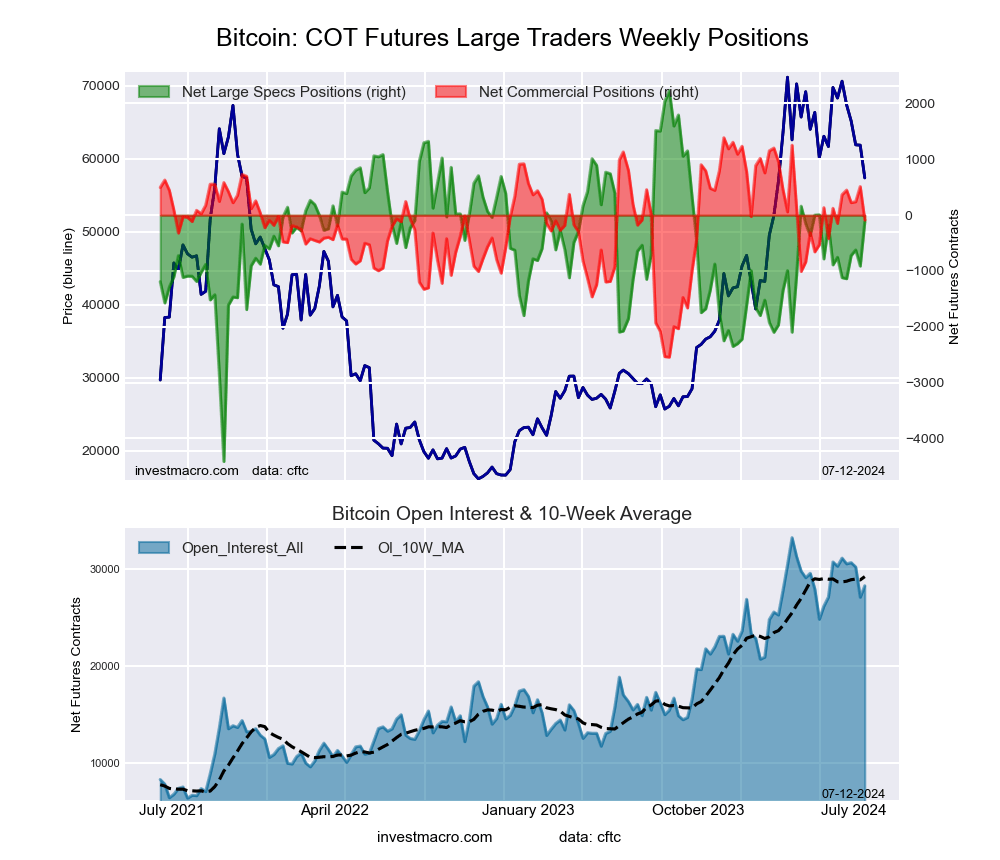
Bitcoin Futures:
The Bitcoin large speculator standing this week reached a net position of -118 contracts in the data reported through Tuesday. This was a weekly increase of 794 contracts from the previous week which had a total of -912 net contracts.
This week’s current strength score (the trader positioning range over the past three years, measured from 0 to 100) shows the speculators are currently Bullish with a score of 64.6 percent. The commercials are Bullish with a score of 62.5 percent and the small traders (not shown in chart) are Bearish-Extreme with a score of 17.6 percent.
Price Trend-Following Model: Strong Downtrend
Our weekly trend-following model classifies the current market price position as: Strong Downtrend. The current action for the model is considered to be: New Sell – Short Position.
BITCOIN Statistics
SPECULATORS
COMMERCIALS
SMALL TRADERS
– Percent of Open Interest Longs:
81.7
2.6
4.8
– Percent of Open Interest Shorts:
82.2
2.9
4.1
– Net Position:
-118
-88
206
– Gross Longs:
23,083
736
1,363
– Gross Shorts:
23,201
824
1,157
– Long to Short Ratio:
1.0 to 1
0.9 to 1
1.2 to 1
NET POSITION TREND:
– Strength Index Score (3 Year Range Pct):
64.6
62.5
17.6
– Strength Index Reading (3 Year Range):
Bullish
Bullish
Bearish-Extreme
NET POSITION MOVEMENT INDEX:
– 6-Week Change in Strength Index:
9.6
1.5
-15.9
Article By InvestMacro – Receive our weekly COT Newsletter
*COT Report: The COT data, released weekly to the public each Friday, is updated through the most recent Tuesday (data is 3 days old) and shows a quick view of how large speculators or non-commercials (for-profit traders) were positioned in the futures markets.
The CFTC categorizes trader positions according to commercial hedgers (traders who use futures contracts for hedging as part of the business), non-commercials (large traders who speculate to realize trading profits) and nonreportable traders (usually small traders/speculators) as well as their open interest (contracts open in the market at time of reporting). See CFTC criteria here.
The latest update for the weekly Commitment of Traders (COT) report was released by the Commodity Futures Trading Commission (CFTC) on Friday for data ending on July 9th 2024.
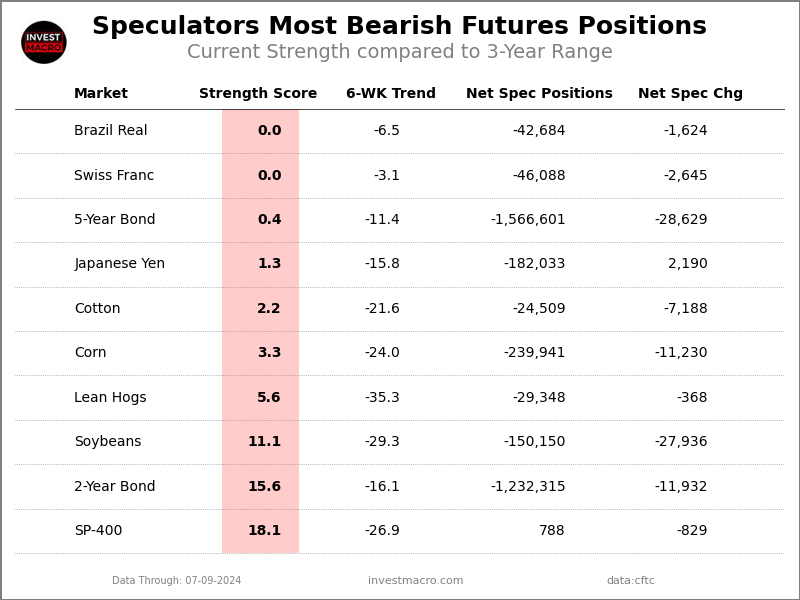
This weekly Extreme Positions report highlights the Most Bullish and Most Bearish Positions for the speculator category. Extreme positioning in these markets can foreshadow strong moves in the underlying market.
To signify an extreme position, we use the Strength Index (also known as the COT Index) of each instrument, a common method of measuring COT data. The Strength Index is simply a comparison of current trader positions against the range of positions over the previous 3 years. We use over 80 percent as extremely bullish and under 20 percent as extremely bearish. (Compare Strength Index scores across all markets in the data table or cot leaders table)
Here Are This Week’s Most Bullish Speculator Positions:
Australian Dollar
The Australian Dollar speculator position comes in as the most bullish extreme standing this week. The Australian Dollar speculator level is currently at the maximum 100.0 percent score of its 3-year range.
The six-week trend for the percent strength score totaled 47.6 this week. The overall net speculator position was a total of 2,413 net contracts this week with a boost of 18,249 contract in the weekly speculator bets.
Speculators or Non-Commercials Notes:
Speculators, classified as non-commercial traders by the CFTC, are made up of large commodity funds, hedge funds and other significant for-profit participants. The Specs are generally regarded as trend-followers in their behavior towards price action – net speculator bets and prices tend to go in the same directions. These traders often look to buy when prices are rising and sell when prices are falling. To illustrate this point, many times speculator contracts can be found at their most extremes (bullish or bearish) when prices are also close to their highest or lowest levels.
These extreme levels can be dangerous for the large speculators as the trade is most crowded, there is less trading ammunition still sitting on the sidelines to push the trend further and prices have moved a significant distance. When the trend becomes exhausted, some speculators take profits while others look to also exit positions when prices fail to continue in the same direction. This process usually plays out over many months to years and can ultimately create a reverse effect where prices start to fall and speculators start a process of selling when prices are falling.
Silver
The Silver speculator position comes next in the extreme standings this week. The Silver speculator level is also now at a 100.0 percent score of its 3-year range.
The six-week trend for the percent strength score was 5.2 this week. The speculator position registered 61,056 net contracts this week with a weekly gain of 5,222 contracts in speculator bets.
British Pound
The British Pound speculator position comes in third this week in the extreme standings. The British Pound speculator level resides at a 100.0 percent score of its 3-year range.
The six-week trend for the speculator strength score came in at 35.9 this week. The overall speculator position was 84,690 net contracts this week with a jump of 22,649 contracts in the weekly speculator bets.
Coffee
The Coffee speculator position comes up number four in the extreme standings this week. The Coffee speculator level is at a 99.4 percent score of its 3-year range.
The six-week trend for the speculator strength score totaled a change of 12.0 this week. The overall speculator position was 75,420 net contracts this week with an increase by 7,659 contracts in the speculator bets.
Gold
The Gold speculator position rounds out the top five in this week’s bullish extreme standings. The Gold speculator level sits at a 91.2 percent score of its 3-year range. The six-week trend for the speculator strength score was 8.2 this week.
The speculator position was 254,775 net contracts this week with a rise of 13,232 contracts in the weekly speculator bets.
This Week’s Most Bearish Speculator Positions:
Brazil Real
The Brazil Real speculator position comes in as the most bearish extreme standing this week. The Brazil Real speculator level is at a 0.0 percent score of its 3-year range.
The six-week trend for the speculator strength score was -6.5 this week. The overall speculator position was -42,684 net contracts this week with a dip of -1,624 contracts in the speculator bets.
Swiss Franc
The Swiss Franc speculator position comes in next for the most bearish extreme standing on the week. The Swiss Franc speculator level is at a 0.0 percent score of its 3-year range.
The six-week trend for the speculator strength score was -3.1 this week. The speculator position was -46,088 net contracts this week with a decrease of -2,645 contracts in the weekly speculator bets.
5-Year Bond
The 5-Year Bond speculator position comes in as third most bearish extreme standing of the week. The 5-Year Bond speculator level resides at a 0.4 percent score of its 3-year range.
The six-week trend for the speculator strength score was -11.4 this week. The overall speculator position was -1,566,601 net contracts this week with a decline of -28,629 contracts in the speculator bets.
Japanese Yen
The Japanese Yen speculator position comes in as this week’s fourth most bearish extreme standing. The Japanese Yen speculator level is at a 1.3 percent score of its 3-year range.
The six-week trend for the speculator strength score was -15.8 this week. The speculator position was -182,033 net contracts this week with a small gain of 2,190 contracts in the weekly speculator bets.
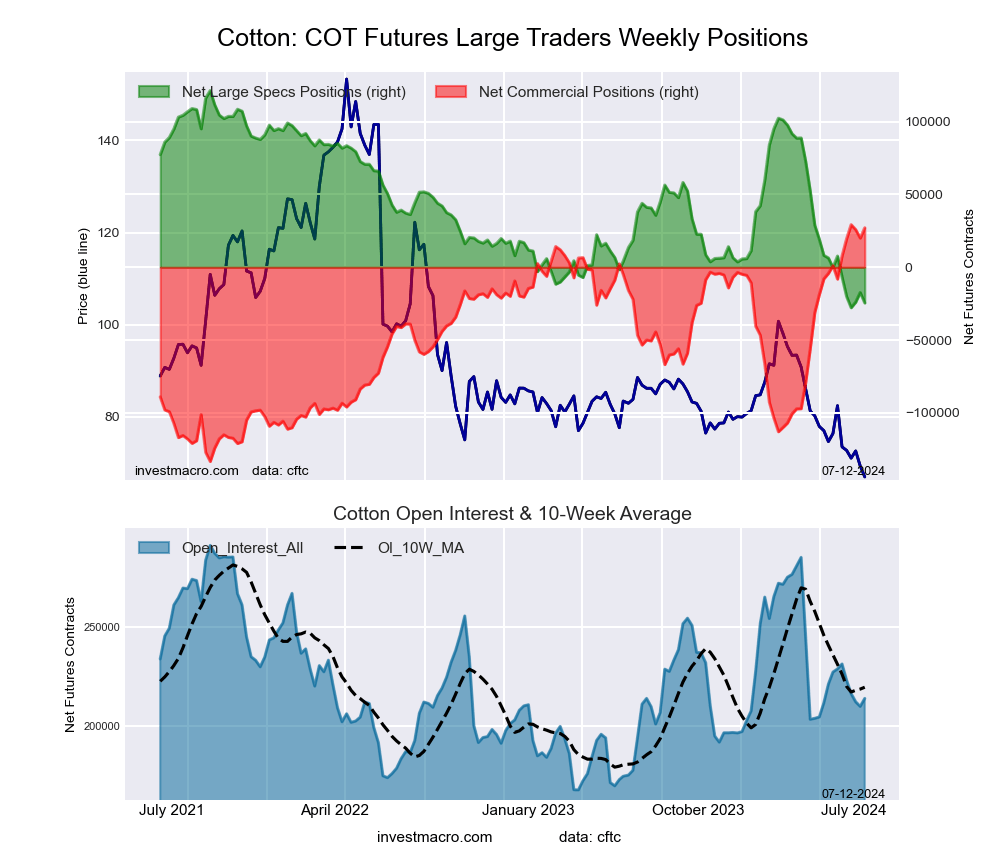
Cotton
Finally, the Cotton speculator position comes in as the fifth most bearish extreme standing for this week. The Cotton speculator level is at a 2.2 percent score of its 3-year range.
The six-week trend for the speculator strength score was -21.6 this week. The speculator position was -24,509 net contracts this week with a reduction by -7,188 contracts in the weekly speculator bets.
Article By InvestMacro – Receive our weekly COT Newsletter
*COT Report: The COT data, released weekly to the public each Friday, is updated through the most recent Tuesday (data is 3 days old) and shows a quick view of how large speculators or non-commercials (for-profit traders) were positioned in the futures markets.
The CFTC categorizes trader positions according to commercial hedgers (traders who use futures contracts for hedging as part of the business), non-commercials (large traders who speculate to realize trading profits) and nonreportable traders (usually small traders/speculators) as well as their open interest (contracts open in the market at time of reporting). See CFTC criteria here.
Over past year ECB decision triggered moves of ↑ 1.5% & ↓ 0.3%
Index trading 3% away from YTD high at 5142.3
Technical levels = 5010 & 4880
Watch out for fresh trading opportunities in the week ahead due to key data, corporate earnings, and the European Central Bank (ECB) meeting:
Monday, 15th July
CN50: China GDP, retail sales, industrial production
EU50: Eurozone industrial production
US500: US Empire State Manufacturing, Fed Chair Jerome Powell speech
US30: Goldman Sachs earnings
Tuesday, 16th July
GER40: Germany ZEW survey expectations
EU50: Eurozone ZEW survey expectations
JP225: Japan tertiary industry index
US500: US retail sales, Morgan Stanley, Bank of America earnings
Wednesday, 17th July
EU50: Eurozone CPI
SG20: Singapore trade
UK100: UK CPI
US500: US industrial production, Fed Beige book
NETH25: ASML earnings
Thursday, 18th July
AU200: Australia unemployment
EU50: ECB rate decision
UK100: UK jobless claims, unemployment
US500: US initial jobless claims, Fed speech
NAS100: Netflix earnings
TWN: TSMC earnings
Friday, 19th July
JP225: Japan CPI
US500: New York Fed President Williams, Atlanta Fed President Bostic speech
Our spotlight shines on FXTM’s EU50 which has been trapped within a weekly range since mid-February 2024. Still, the index has gained 10% year-to-date and is 3% away from its 2024 high at 5142.3.
Note: FXTM’s EU50 tracks the underlying Euro Stoxx 50 index – which represents the performance of the 50 largest blue-chip companies operating within eurozone nations.
With all the above discussed, here are 3 forces that may rock the EU50 in the week ahead:
1) Key EU data
Economic releases from Europe may impact bets around when the ECB cuts rates again in 2024.
Keep an eye on the latest Eurozone industrial production, the final print of June’s inflation reading along with the ZEW survey expectations from Germany – the largest economy in Europe. While the incoming data is unlikely to impact what decision the ECB makes this month, it could expectations for September and beyond.
Should overall European data support the argument for lower rates, this could push the EU50 higher.
A positive set of economic reports or an unexpected upward revision to the CPI print could pull the EU50 lower.
Golden nugget: Over the past year, the Germany ZEW survey has triggered upside moves as much as 0.5% or declines of 0.5% in a 6-hour window post-release.
2) ECB rate decision
Markets widely expect the ECB to leave interest rates unchanged on Thursday 18th July.
In June, the central bank cut interest rates for the first time since 2019 but adopted a cautious stance on future moves. Much focus will be on Lagarde’s press conference for additional clues on future policy moves, especially after the recent political drama in Europe.
Traders are currently pricing in an 82% probability of a 25-basis point ECB cut by September with a move fully priced in by October.
The EU50 could receive a boost if the ECB signals that a September rate cut is on the cards.
If the ECB sounds more hawkish than expected or offers little insight on future moves, the EU50 may dip.
Golden nugget: Over the past year, the ECB rate decision has triggered upside moves as much as 1.5% or declines of 0.3% in a 6-hour window post-release.
3) Technical forces
Prices remain trapped within a wide range on the daily charts with the first layer of support at 4880 and resistance at 5010. The candlesticks are trading marginally below the 50 and 100-day SMA as of writing with the MACD below zero.
A solid breakout above 5010, may open a path towards 5115 and 5142. Should bulls push beyond the 2024 high, this could trigger a move toward the next psychological point at 5150.
Sustained weakness below 5010, could see bears challenge 4880 and 4835.
As financeprofessors, we find this at least as important. The Supreme Court’s 6-3 ruling in SEC v. Jarkesy could make it more challenging for the Securities and Exchange Commission – the U.S. agency that regulates securities markets – to fight fraud. And any time the SEC loses power, as it just did, market trust and transparency may be at risk.
What matters for investors, including anyone with a 401(k) plan, is how the SEC chooses to handle cases moving forward.
In 2013, the SEC accused the fund manager – George Jarkesy – of committing securities fraud, alleging that he overestimated fund values and made other false claims. The SEC charged Jarkesy and fined him US$300,000 in a proceeding in an in-house SEC court overseen by an administrative law judge.
Jarkesy then sued the SEC, claiming he hadn’t been granted a fair trial.
The case found its way before the Supreme Court, which ruled in Jarkesy’s favor. The ruling determined that the SEC proceedings used to identify fraud and impose fines didn’t meet the criteria for a fair trial. Moving forward, such cases will need to be tried in federal court.
It’s an important precedent for the defense of people accused of misdeeds by government agencies. And the SEC isn’t the only agency to use such internal administrative proceedings. More than two dozen other agencies, including the Department of Labor and the Environmental Protection Agency, will be affected by the court’s ruling.
However, a ruling that the SEC now must turn to judiciary trials or proceedings instead of internal administrative proceedings will move all securities-fraud cases involving fines to the federal courts, potentially raising the cost of prosecution. That, in turn, could result in fewer enforcement efforts, given limited agency resources.
What’s more, losing the implicit home-court advantage the SEC previously had with its internal proceedings could further slow and complicate enforcement efforts. The result could be that when people commit securities fraud, the SEC won’t have the resources to ensure they’re caught and punished.
To understand what will likely change, it’s important to understand the former status quo.
In the most recent fiscal year, 2023, the SEC filed 784 enforcement actions, ordering nearly $5 billion in fines and distributing nearly $1 billion to harmed investors. That was a 3% increase in enforcement actions over 2022. And the past two years of SEC fines have been the largeston record.
But now, the SEC cannot fine defendants through administrative courts and must seek civil penalties through federal courts.
One potential outcome could be a smaller regulatory burden for investment professionals who may have been concerned with how their actions would be viewed by the SEC – including, but not necessarily limited to, fraudsters. This is because the SEC may bring forward fewer fines or cases with fines due to the additional resources necessary for judiciary proceedings.
If that happens, fraudsters might be emboldened – since the expected cost of committing securities fraud would be lower than it was before the ruling – and investors would have to depend less on regulators protecting them and more on limiting risks themselves.
This could pose a problem for less sophisticated investors. Lots of people don’t know how to define securities fraud; even fewer can figure out whether a fund manager may have committed it. That risk, in turn, could limit the way investors participate in markets.
But if that simply means Americans buy more shares of S&P 500 exchange-traded funds and invest less in hedge funds, it shouldn’t be a problem for anyone’s bottom line. And more sophisticated investors should be well-equipped to evaluate risks on their own.
Enforcement will remain key to maintaining transparency in markets, but the method of enforcement – be it in a federal court or elsewhere – may not matter very much. The important thing is that people who commit financial crimes continue to face consequences.