Archive for Opinions – Page 43

Space missions are getting more complex − lessons from Amazon and FedEx can inform satellite and spacecraft management in orbit

By Koki Ho, Georgia Institute of Technology and Mariel Borowitz, Georgia Institute of Technology 

Most space mission systems historically have used one spacecraft designed to complete an entire mission independently. Whether it was a weather satellite or a human-crewed module like Apollo, nearly every spacecraft was deployed and performed its one-off mission completely on its own.

But today, space industry organizations are exploring missions with many satellites working together. For example, SpaceX’s Starlink constellations include thousands of satellites. And new spacecraft could soon have the capabilities to link up or engage with other satellites in orbit for repairs or refueling.

Some of these spacecraft are already operating and serving customers, such as Northrop Grumman’s mission extension vehicle. This orbiting craft has extended the lives of multiple communications satellites.

Northrup Grumman’s mission extension vehicle is one example of a craft designed to service other satellites and spacecraft while in orbit.

These new design options and in-orbit capabilities make space missions look more like large logistics operations on Earth.

We’re researchers who have studied the space industry for years. We’ve studied how the space sector could learn lessons from companies like Amazon or FedEx about managing complex fleets and coordinating operations.

As companies develop satellite constellations as shown in this illustration, they’ll need to repair satellites in orbit.
NOIRLab/NSF/AURA/P. Marenfeld, CC BY-ND

Lessons from the ground transportation network

Space mission designers plan their routes in order to deliver their payloads to the Moon or Mars, or orbit efficiently within a set of cost, timeline and capacity constraints. But when they need to coordinate multiple space vehicles working together, route planning can get complicated.

Logistics companies on the ground solve similar problems every day and transport goods and commodities across the globe. So, researchers can study how these companies manage their logistics to help space companies and agencies figure out how to successfully plan their mission operations.

One NASA-funded study in the early 2000s had an idea for simulating space logistics operations. These researchers viewed orbits or planets as cities and the trajectories connecting them as routes. They also viewed the payload, consumables, fuel and other items to transport as commodities.

This approach helped them reframe the space mission problem as a commodity flow problem – a type of question that ground logistics companies work on all the time.

Lessons from ground logistics infrastructure

New capabilities for refueling and repairing spacecraft in orbit create new opportunities as well as challenges.

Namely, space operators don’t usually know which satellite will be the next one to fail or when that will happen. For these new technologies to be useful, space mission designers would need to come up with an infrastructure system. That could look like a fleet of service vehicles and depots in space that quickly respond to any unpredictable events.

Fortunately, space mission designers can learn from operations on the ground. City planners and emergency response organizations think through these types of challenges while determining where to locate hospitals or fire departments. They also consider these facilities’ capacities to respond to unpredictable calls.

We can draw an analogy between a ground logistics system design and an in-space servicing system design. This way, researchers can leverage theories developed for ground logistics to improve the space mission design practice.

One study published in November 2020 developed a framework for servicing spacecraft on orbit using what logistics experts call spatial queuing theory. Researchers most commonly use this modeling theory to analyze the performance of a ground logistics system.

Lessons from ground warehouse management

In the past, individual spacecraft carried out their missions independently, so if a satellite failed, its mission engineers had to develop and send a replacement.

Now, for missions with multiple satellites, such as the Iridium satellite constellation, operators often maintain one or more spares on orbit.

This becomes complicated for constellations made up of hundreds or thousands of spacecraft. Mission designers want to ensure they have enough spare satellites in orbit so they don’t have to interrupt the mission if one breaks. But sending too many spare satellites gets expensive.

When dealing with these types of large constellations, mission designers can learn from the methods Amazon and other ground companies use to manage their warehouses. Amazon puts these warehouses in specific places and stocks them with certain items to make sure the deliveries are handled efficiently.

Inventory management theories on the ground can help inform how space companies tackle these challenges.

A study published in November 2019 developed an approach that space companies could use to manage their spare strategies. This approach can help them decide where in orbit to allocate their spare satellites to meet their needs while minimizing any service interruptions.

International dimensions

Spacecraft operate in a complex and rapidly changing environment. Operators need to know where other missions are operating and what rules they should follow when refueling or repairing in space. In space, however, nobody has defined these rules yet.

Ships, aircraft and ground vehicles all have clear rules of the road to follow when interacting with other vehicles. For example, civilian ships and aircraft have to share their location with other vehicles and officials to help manage traffic.

Some researchers are examining what similar rules could look like for space. One study examined how developing rules based on a spacecraft’s size, age or other attributes might help future space operations run more smoothly. For example, one rule might be that the spacecraft that launched most recently should take responsibility for maneuvering when there’s another craft in its path.

With more satellites and spacecraft launching now than ever, companies and government agencies will need new technologies and policies to coordinate them. As space activity becomes more complex, researchers can continue to apply what they’ve learned on the ground to new missions in space.The Conversation

About the Author:

Koki Ho, Associate Professor of Aerospace Engineering, Georgia Institute of Technology and Mariel Borowitz, Associate Professor of International Affairs, Georgia Institute of Technology

This article is republished from The Conversation under a Creative Commons license. Read the original article.


Speculators sharply raise Euro, British Pound & Canadian Dollar bets

By InvestMacro

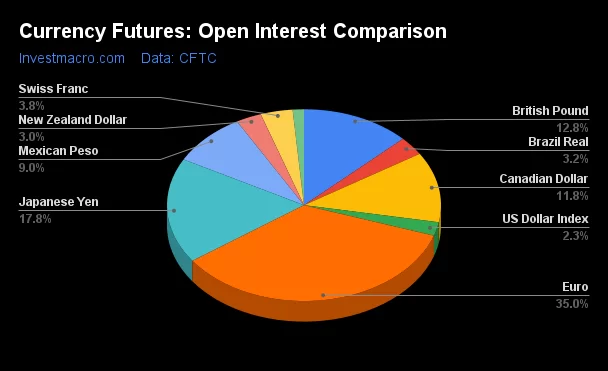
Here are the latest charts and statistics for the Commitment of Traders (COT) data published by the Commodities Futures Trading Commission (CFTC).

The latest COT data is updated through Tuesday August 20th and shows a quick view of how large market participants (for-profit speculators and commercial traders) were positioned in the futures markets. All currency positions are in direct relation to the US dollar where, for example, a bet for the euro is a bet that the euro will rise versus the dollar while a bet against the euro will be a bet that the euro will decline versus the dollar.

Weekly Speculator Changes led by Euro & British Pound

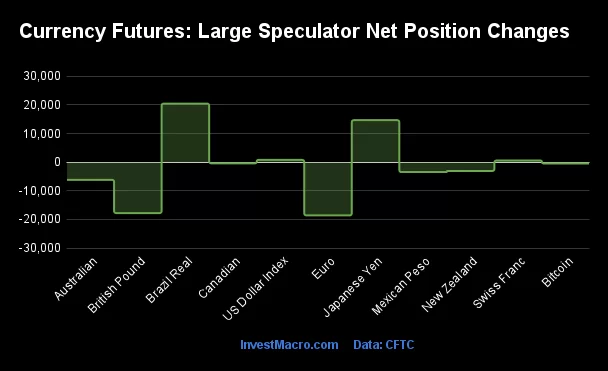
The COT currency market speculator bets were higher this week as seven out of the eleven currency markets we cover had higher positioning while the other four markets had lower speculator contracts.

Leading the gains for the currency markets was the EuroFX (29,034 contracts) with the British Pound (19,699 contracts), the Canadian Dollar (15,201 contracts), the Australian Dollar (3,731 contracts), the Brazilian Real (2,887 contracts), the New Zealand Dollar (1,855 contracts) and the Japanese Yen (481 contracts) also showing positive weeks.

The currencies seeing declines in speculator bets on the week were the Mexican Peso (-15,448 contracts), the Swiss Franc (-4,050 contracts), the US Dollar Index (-945 contracts) and with Bitcoin (-638 contracts) also registering lower bets on the week.
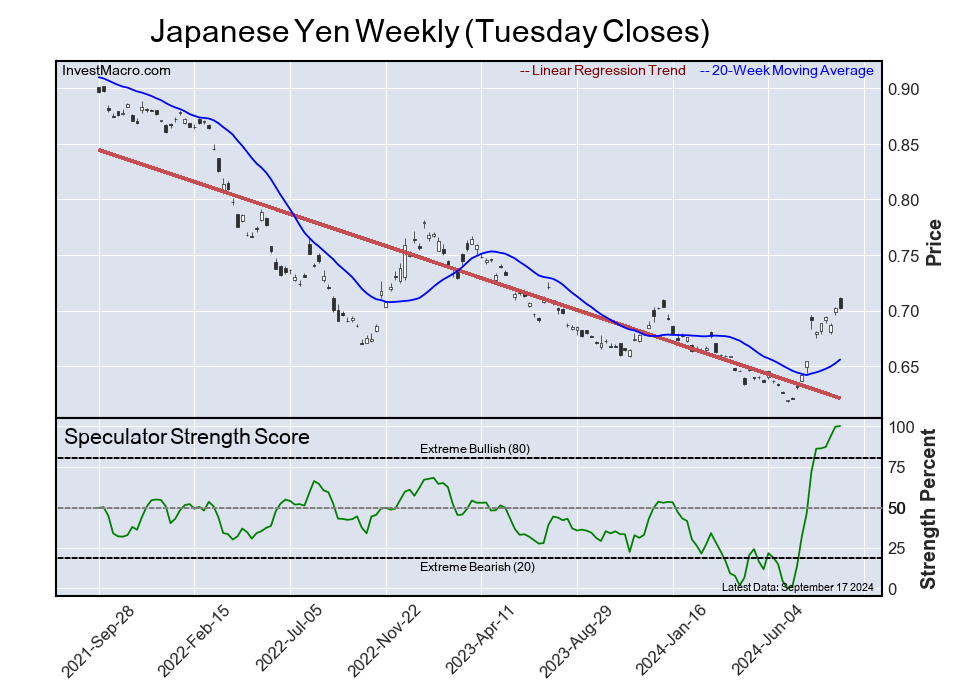
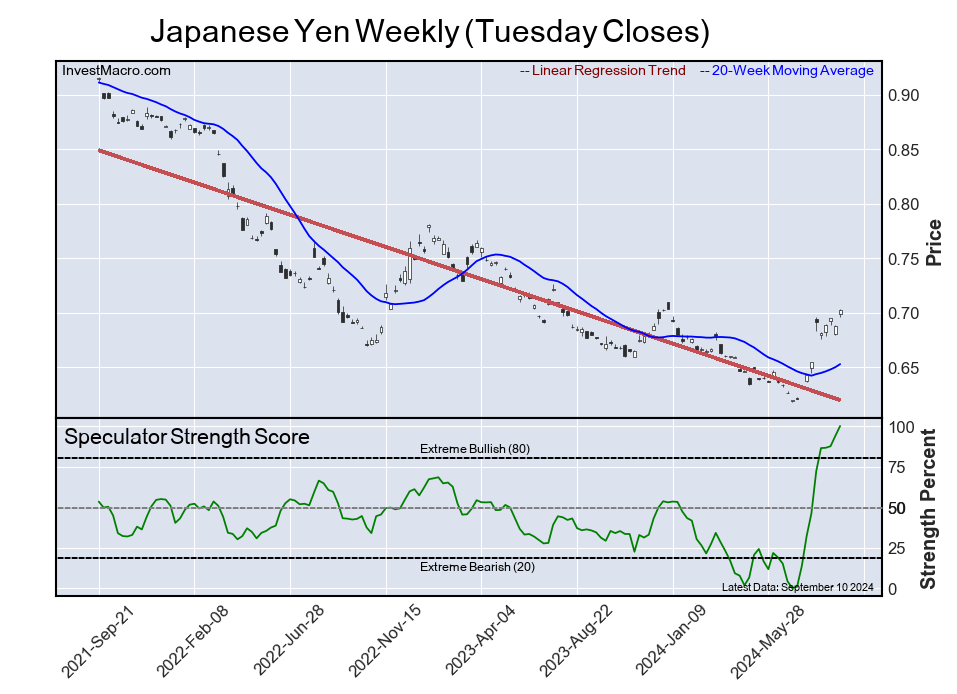
Currency Speculators sharply raise Euro, British Pound & Canadian Dollar bets

This week’s COT currency’s data saw improvement in many of the non-dollar currencies this week. The US Dollar Index fell by over 1 percent this week as the American currency faces pressure from moderating inflation and expected interest rate cuts from the US Federal Reserve starting in September.

Here is this week’s COT currency roundup:

The Euro speculator positioning jumped by +29,034 contracts this week and rose for the fifth time out of the past seven weeks. This week’s gain was the highest weekly rise in over a year and brought the overall bullish position to an 11-week high. Euro positions have now been in bullish territory for seven straight weeks after a brief fall onto the bearish side for two weeks in late-June and early-July. The Euro exchange rate versus the dollar closed this week above it’s 200-week moving average and right below the 1.1200 exchange rate — the highest weekly close since July of 2023.

The British pound sterling speculator contracts rose strongly this week (+19,699 contracts) following sharp declines over the past three weeks that had taken a total of -94,371 contracts off of the speculator’s bullish standing. The GBP speculator position had surged to an all-time record high on July 23rd at a total of +142,183 contracts before embarking on a three-week slide. The previous record high speculator position had been prior (July 17th 2007 at +98,366 contracts) to the start of the Great Financial Crisis. This week’s rebound brings the speculator standing back up to a total of +67,511 contracts. The GBPUSD exchange rate this week has touched its highest level since March of 2022 against the US dollar and closed over 1.3200 to end the week.

The Canadian dollar has been on the other side of the spectrum than that of the British pound as it recently fell to an all-time record bearish speculator level. The CAD spec bets had dropped to -196,263 contracts on July 30th but have now rebounded for three straight weeks including this week’s gain by over +15,000 contracts. The CAD position settled this week at a standing of -164,410 contracts (the 4th most bearish level on record) and, overall, has now been in a bearish position for fifty-five straight weeks, dating back to August 1st of 2023. The Canadian dollar exchange rate had a strong week versus the US dollar and rose over 1 percent as the CAD futures price closed over the 0.7400 threshold and up against the top of its weekly down-trending channel that started in May/June of 2021.

Finally, the Japanese yen speculator bets continued to gain for a seventh straight week this week after dropping to the second lowest level on record at -184,223 contracts on July 2nd. The seven-week improvement has totaled +207,808 contracts and has taken the speculator position from -184,223 contracts on July 2nd to this week’s total of +23,585 contracts. Traders have been quick to reverse their positions on central bank policy changes (and currency intervention) with the US Federal Reserve ready to reduce interest rates while the Bank of Japan is possibly looking to raise their rates. The yen exchange rate versus the dollar rose strongly this week with a 5-day gain over 2 percent. The Japanese yen strength brought the USDJPY currency pair to the 144.39 exchange rate, the best weekly close for the yen since January.


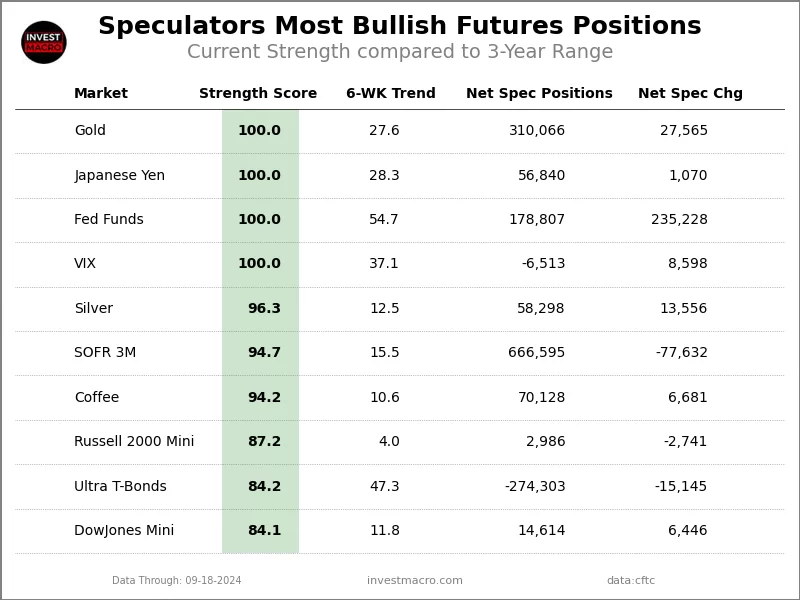
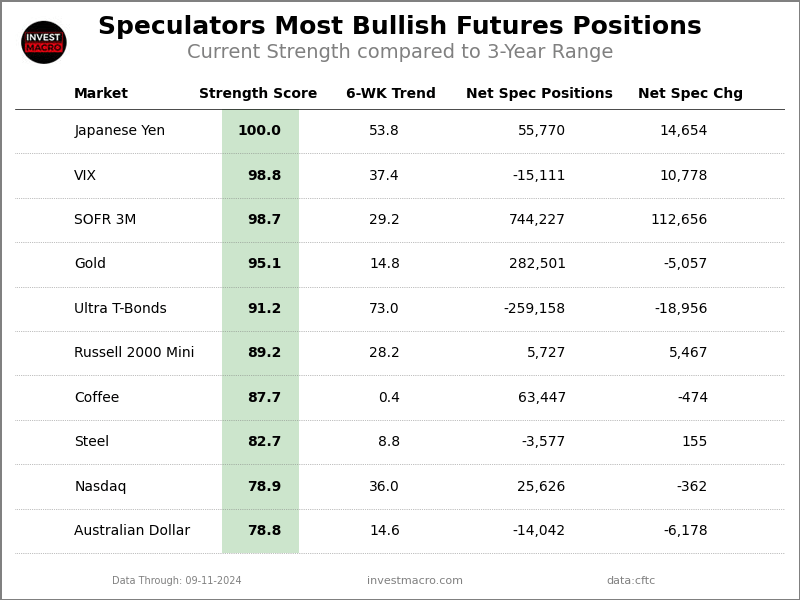
Currencies Net Speculators Leaderboard

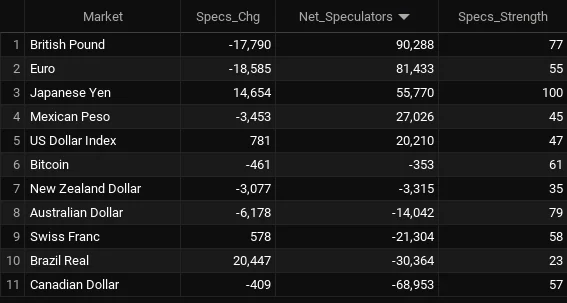
Legend: Weekly Speculators Change | Speculators Current Net Position | Speculators Strength Score compared to last 3-Years (0-100 range)


Strength Scores led by Japanese Yen

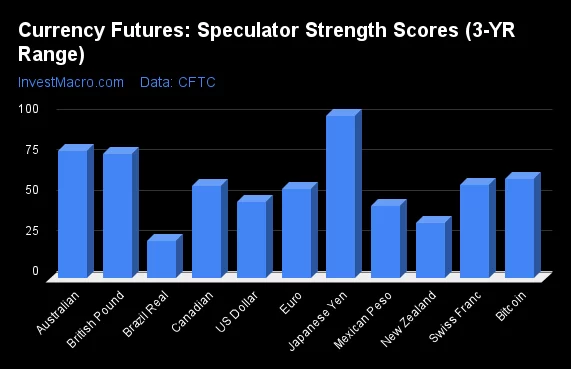
COT Strength Scores (a normalized measure of Speculator positions over a 3-Year range, from 0 to 100 where above 80 is Extreme-Bullish and below 20 is Extreme-Bearish) showed that the Japanese Yen (100 percent) leads the currency markets this week. The the British Pound (66 percent), Bitcoin (63 percent) and the Australian Dollar (58 percent) come in as the next highest in the weekly strength scores.

On the downside, the Brazilian Real (4 percent), the New Zealand Dollar (14 percent) and the Canadian Dollar (14 percent) come in at the lowest strength levels currently and are in Extreme-Bearish territory (below 20 percent).

Strength Statistics:
US Dollar Index (41.5 percent) vs US Dollar Index previous week (43.6 percent)
EuroFX (44.2 percent) vs EuroFX previous week (31.8 percent)
British Pound Sterling (66.4 percent) vs British Pound Sterling previous week (57.6 percent)
Japanese Yen (100.0 percent) vs Japanese Yen previous week (99.8 percent)
Swiss Franc (44.8 percent) vs Swiss Franc previous week (52.3 percent)
Canadian Dollar (14.3 percent) vs Canadian Dollar previous week (7.5 percent)
Australian Dollar (57.9 percent) vs Australian Dollar previous week (54.7 percent)
New Zealand Dollar (14.4 percent) vs New Zealand Dollar previous week (10.9 percent)
Mexican Peso (48.5 percent) vs Mexican Peso previous week (56.0 percent)
Brazilian Real (3.7 percent) vs Brazilian Real previous week (1.0 percent)
Bitcoin (62.7 percent) vs Bitcoin previous week (72.4 percent)


Japanese Yen & Swiss Franc top the 6-Week Strength Trends

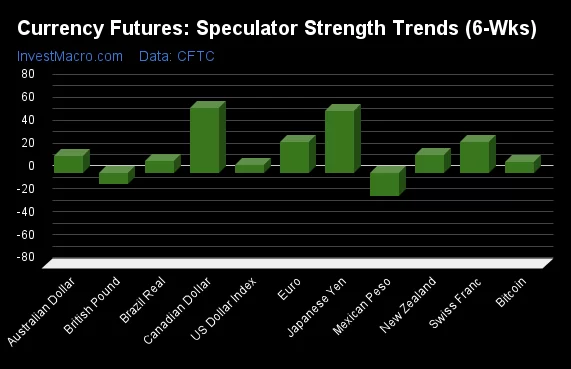
COT Strength Score Trends (or move index, calculates the 6-week changes in strength scores) showed that the Japanese Yen (99 percent) and the Swiss Franc (38 percent) lead the past six weeks trends for the currencies. The EuroFX (22 percent) and the US Dollar Index (3 percent) are the next highest positive movers in the latest trends data.

The New Zealand Dollar (-76 percent) leads the downside trend scores currently with the Australian Dollar (-35 percent), Canadian Dollar (-24 percent) and the Mexican Peso (-14 percent) following next with lower trend scores.

Strength Trend Statistics:
US Dollar Index (2.9 percent) vs US Dollar Index previous week (4.2 percent)
EuroFX (22.3 percent) vs EuroFX previous week (15.5 percent)
British Pound Sterling (-7.7 percent) vs British Pound Sterling previous week (-6.4 percent)
Japanese Yen (98.9 percent) vs Japanese Yen previous week (99.8 percent)
Swiss Franc (37.9 percent) vs Swiss Franc previous week (40.5 percent)
Canadian Dollar (-23.8 percent) vs Canadian Dollar previous week (-26.6 percent)
Australian Dollar (-34.8 percent) vs Australian Dollar previous week (-22.6 percent)
New Zealand Dollar (-76.3 percent) vs New Zealand Dollar previous week (-89.1 percent)
Mexican Peso (-14.1 percent) vs Mexican Peso previous week (-6.6 percent)
Brazilian Real (-7.8 percent) vs Brazilian Real previous week (-12.1 percent)
Bitcoin (-1.9 percent) vs Bitcoin previous week (19.7 percent)


Individual COT Forex Markets:

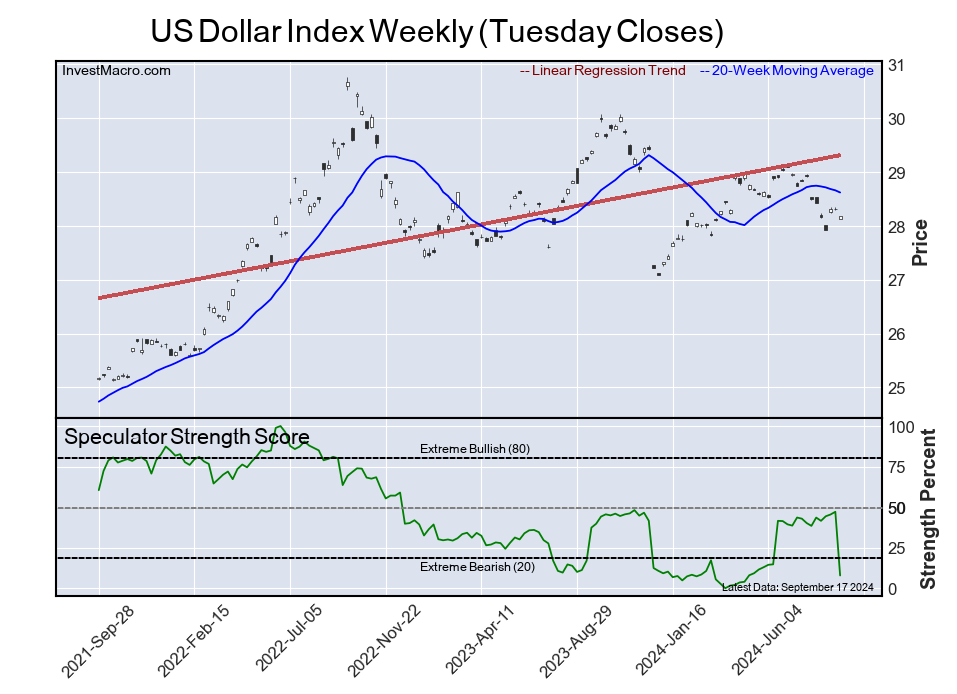
US Dollar Index Futures:

US Dollar Index Forex Futures COT Chart
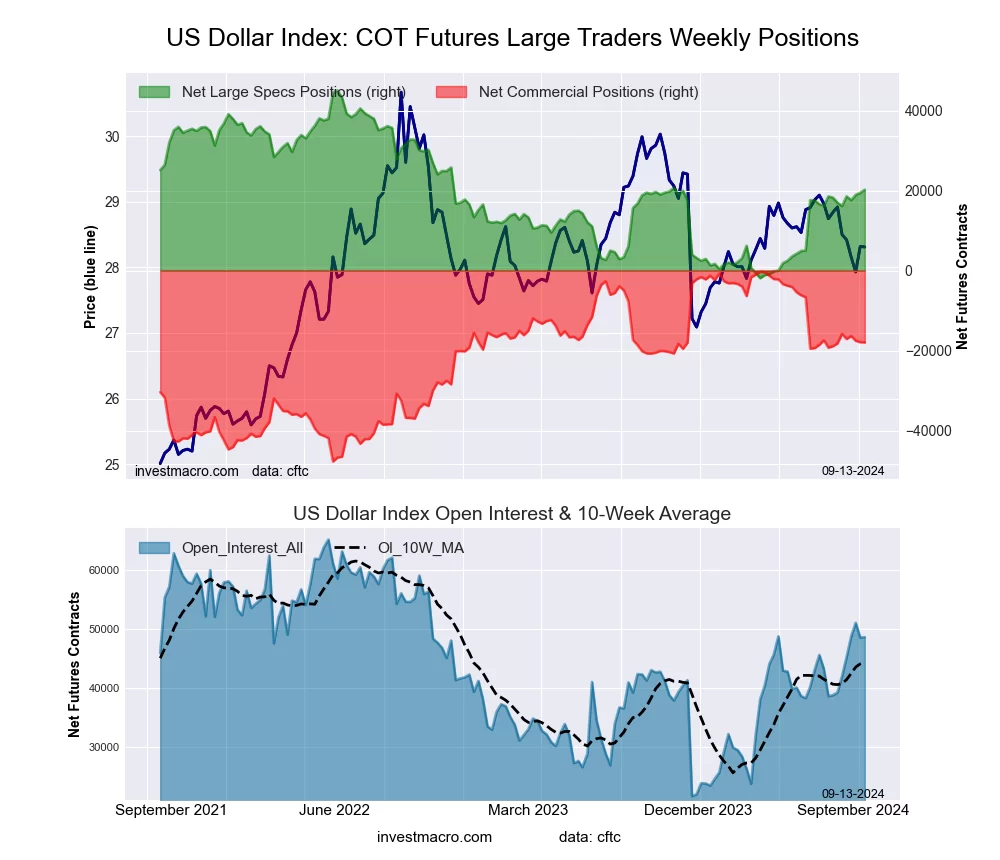
The US Dollar Index large speculator standing this week equaled a net position of 17,591 contracts in the data reported through Tuesday. This was a weekly fall of -945 contracts from the previous week which had a total of 18,536 net contracts.

This week’s current strength score (the trader positioning range over the past three years, measured from 0 to 100) shows the speculators are currently Bearish with a score of 41.5 percent. The commercials are Bullish with a score of 66.1 percent and the small traders (not shown in chart) are Bearish-Extreme with a score of 2.2 percent.

Price Trend-Following Model: Strong Downtrend

Our weekly trend-following model classifies the current market price position as: Strong Downtrend. The current action for the model is considered to be: New Sell – Short Position.

US DOLLAR INDEX StatisticsSPECULATORSCOMMERCIALSSMALL TRADERS
– Percent of Open Interest Longs:72.819.34.8
– Percent of Open Interest Shorts:36.752.97.3
– Net Position:17,591-16,372-1,219
– Gross Longs:35,4529,4122,361
– Gross Shorts:17,86125,7843,580
– Long to Short Ratio:2.0 to 10.4 to 10.7 to 1
NET POSITION TREND:
– Strength Index Score (3 Year Range Pct):41.566.12.2
– Strength Index Reading (3 Year Range):BearishBullishBearish-Extreme
NET POSITION MOVEMENT INDEX:
– 6-Week Change in Strength Index:2.92.2-26.9


Euro Currency Futures:

Euro Currency Futures COT Chart
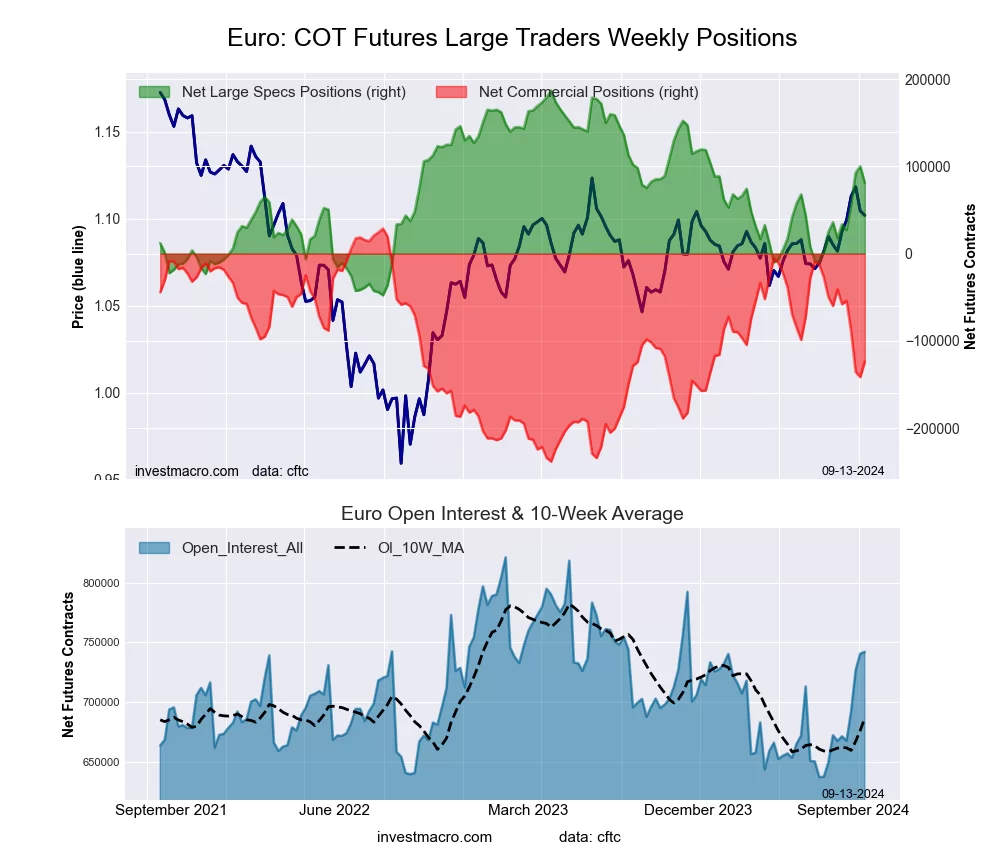
The Euro Currency large speculator standing this week equaled a net position of 56,017 contracts in the data reported through Tuesday. This was a weekly gain of 29,034 contracts from the previous week which had a total of 26,983 net contracts.

This week’s current strength score (the trader positioning range over the past three years, measured from 0 to 100) shows the speculators are currently Bearish with a score of 44.2 percent. The commercials are Bullish with a score of 55.8 percent and the small traders (not shown in chart) are Bearish with a score of 45.7 percent.

Price Trend-Following Model: Strong Uptrend

Our weekly trend-following model classifies the current market price position as: Strong Uptrend. The current action for the model is considered to be: Hold – Maintain Long Position.

EURO Currency StatisticsSPECULATORSCOMMERCIALSSMALL TRADERS
– Percent of Open Interest Longs:28.155.911.9
– Percent of Open Interest Shorts:20.068.87.1
– Net Position:56,017-89,22433,207
– Gross Longs:194,350386,94882,517
– Gross Shorts:138,333476,17249,310
– Long to Short Ratio:1.4 to 10.8 to 11.7 to 1
NET POSITION TREND:
– Strength Index Score (3 Year Range Pct):44.255.845.7
– Strength Index Reading (3 Year Range):BearishBullishBearish
NET POSITION MOVEMENT INDEX:
– 6-Week Change in Strength Index:22.3-23.221.9


British Pound Sterling Futures:

British Pound Sterling Futures COT Chart
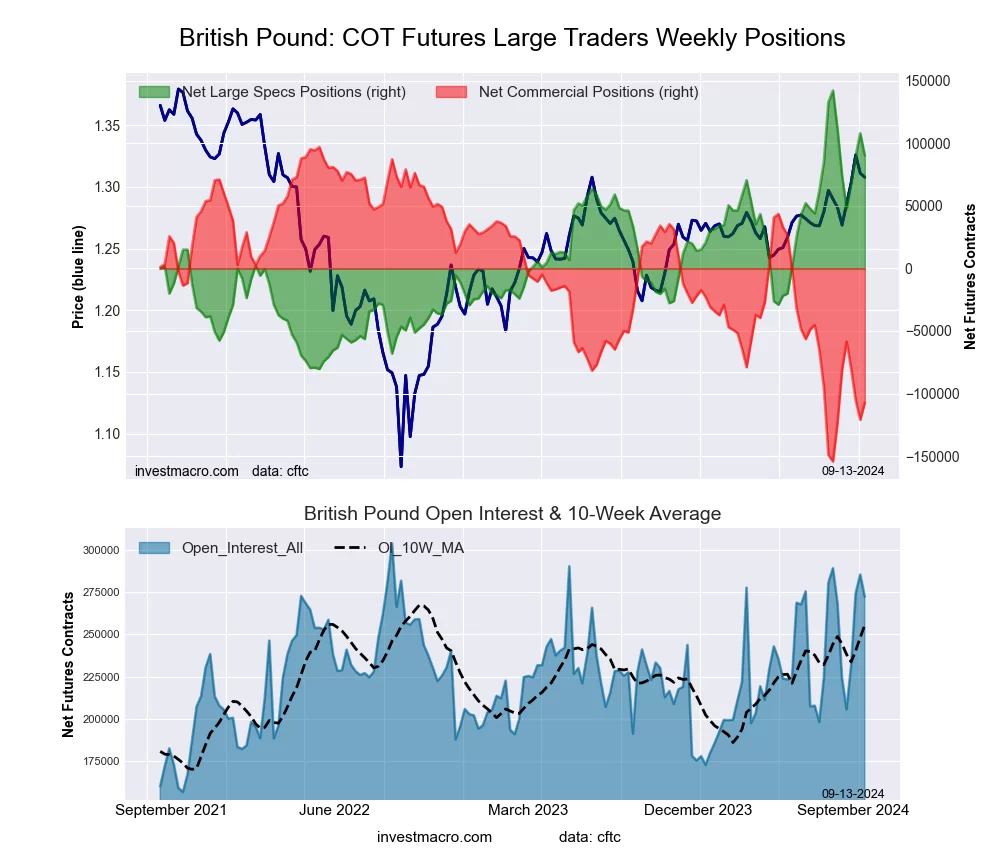
The British Pound Sterling large speculator standing this week equaled a net position of 67,511 contracts in the data reported through Tuesday. This was a weekly lift of 19,699 contracts from the previous week which had a total of 47,812 net contracts.

This week’s current strength score (the trader positioning range over the past three years, measured from 0 to 100) shows the speculators are currently Bullish with a score of 66.4 percent. The commercials are Bearish with a score of 29.6 percent and the small traders (not shown in chart) are Bullish-Extreme with a score of 88.3 percent.

Price Trend-Following Model: Strong Uptrend

Our weekly trend-following model classifies the current market price position as: Strong Uptrend. The current action for the model is considered to be: Hold – Maintain Long Position.

BRITISH POUND StatisticsSPECULATORSCOMMERCIALSSMALL TRADERS
– Percent of Open Interest Longs:54.323.916.3
– Percent of Open Interest Shorts:25.158.410.9
– Net Position:67,511-79,95512,444
– Gross Longs:125,63455,24837,610
– Gross Shorts:58,123135,20325,166
– Long to Short Ratio:2.2 to 10.4 to 11.5 to 1
NET POSITION TREND:
– Strength Index Score (3 Year Range Pct):66.429.688.3
– Strength Index Reading (3 Year Range):BullishBearishBullish-Extreme
NET POSITION MOVEMENT INDEX:
– 6-Week Change in Strength Index:-7.75.85.4


Japanese Yen Futures:

Japanese Yen Forex Futures COT Chart
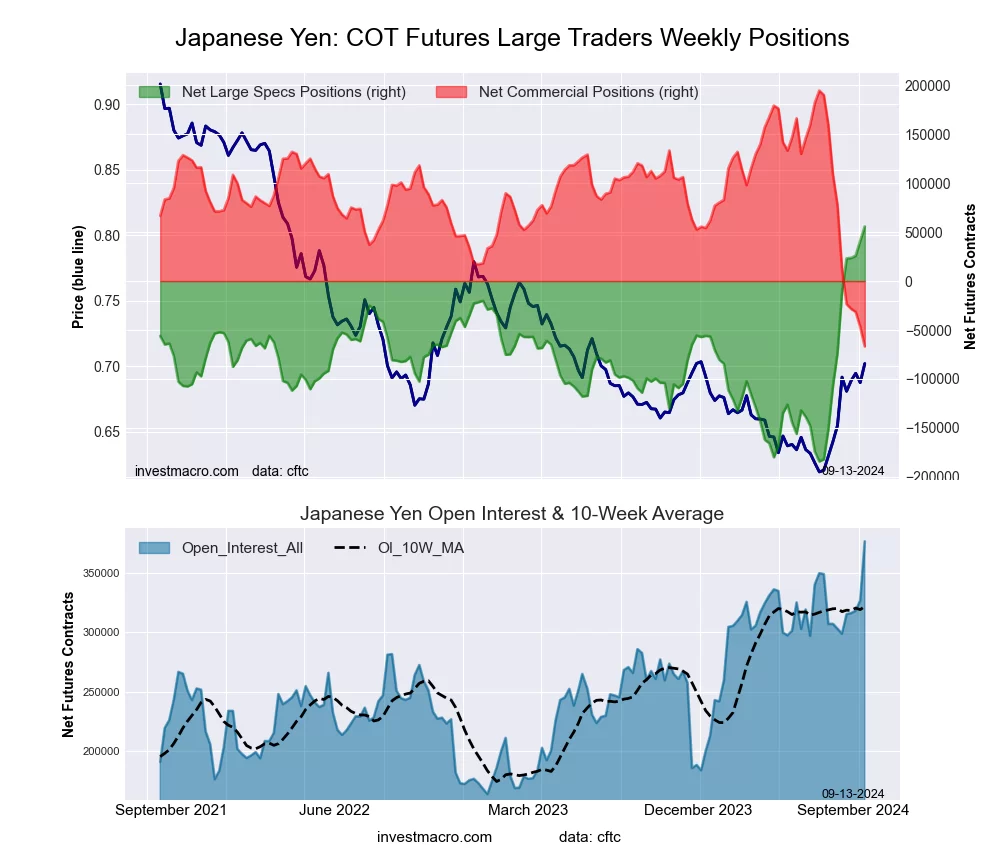
The Japanese Yen large speculator standing this week equaled a net position of 23,585 contracts in the data reported through Tuesday. This was a weekly increase of 481 contracts from the previous week which had a total of 23,104 net contracts.

This week’s current strength score (the trader positioning range over the past three years, measured from 0 to 100) shows the speculators are currently Bullish-Extreme with a score of 100.0 percent. The commercials are Bearish-Extreme with a score of 0.0 percent and the small traders (not shown in chart) are Bullish-Extreme with a score of 97.7 percent.

Price Trend-Following Model: Strong Uptrend

Our weekly trend-following model classifies the current market price position as: Strong Uptrend. The current action for the model is considered to be: Hold – Maintain Long Position.

JAPANESE YEN StatisticsSPECULATORSCOMMERCIALSSMALL TRADERS
– Percent of Open Interest Longs:28.159.211.4
– Percent of Open Interest Shorts:20.668.19.9
– Net Position:23,585-28,4014,816
– Gross Longs:88,761187,05535,989
– Gross Shorts:65,176215,45631,173
– Long to Short Ratio:1.4 to 10.9 to 11.2 to 1
NET POSITION TREND:
– Strength Index Score (3 Year Range Pct):100.00.097.7
– Strength Index Reading (3 Year Range):Bullish-ExtremeBearish-ExtremeBullish-Extreme
NET POSITION MOVEMENT INDEX:
– 6-Week Change in Strength Index:98.9-97.939.7


Swiss Franc Futures:

Swiss Franc Forex Futures COT Chart
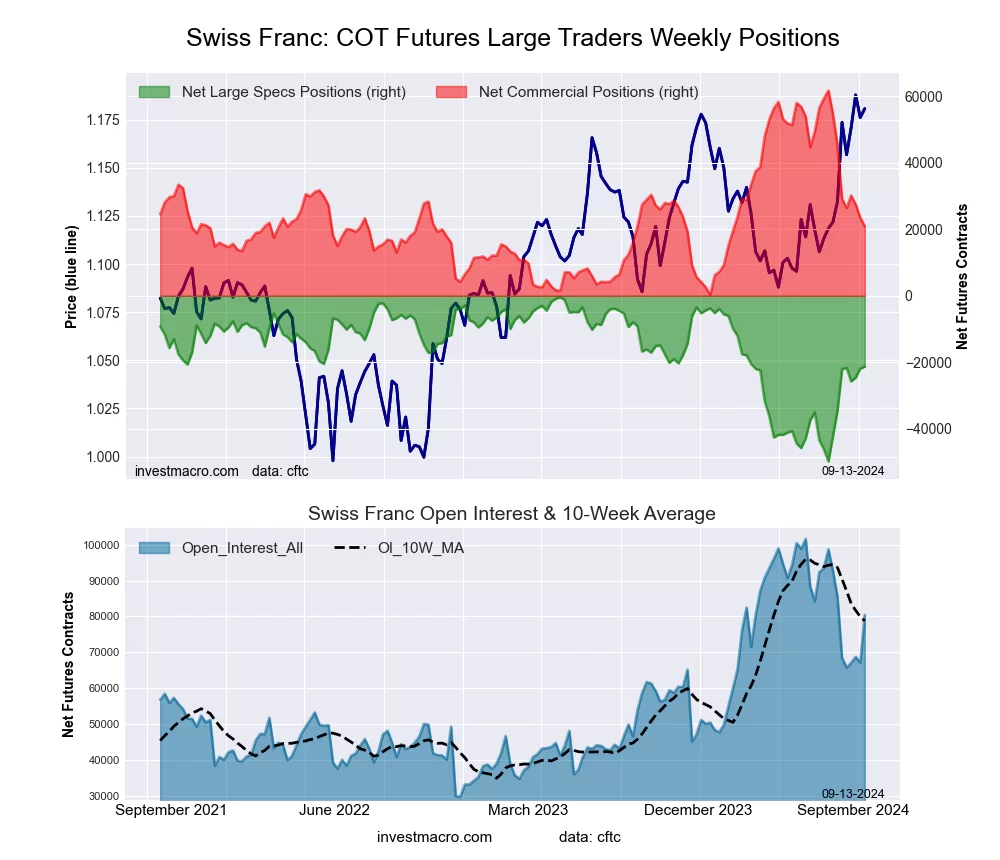
The Swiss Franc large speculator standing this week equaled a net position of -25,714 contracts in the data reported through Tuesday. This was a weekly decline of -4,050 contracts from the previous week which had a total of -21,664 net contracts.

This week’s current strength score (the trader positioning range over the past three years, measured from 0 to 100) shows the speculators are currently Bearish with a score of 44.8 percent. The commercials are Bearish with a score of 48.6 percent and the small traders (not shown in chart) are Bullish with a score of 57.3 percent.

Price Trend-Following Model: Strong Uptrend

Our weekly trend-following model classifies the current market price position as: Strong Uptrend. The current action for the model is considered to be: Hold – Maintain Long Position.

SWISS FRANC StatisticsSPECULATORSCOMMERCIALSSMALL TRADERS
– Percent of Open Interest Longs:11.369.918.4
– Percent of Open Interest Shorts:49.625.124.9
– Net Position:-25,71430,096-4,382
– Gross Longs:7,60046,90712,329
– Gross Shorts:33,31416,81116,711
– Long to Short Ratio:0.2 to 12.8 to 10.7 to 1
NET POSITION TREND:
– Strength Index Score (3 Year Range Pct):44.848.657.3
– Strength Index Reading (3 Year Range):BearishBearishBullish
NET POSITION MOVEMENT INDEX:
– 6-Week Change in Strength Index:37.9-47.640.1


Canadian Dollar Futures:

Canadian Dollar Forex Futures COT Chart
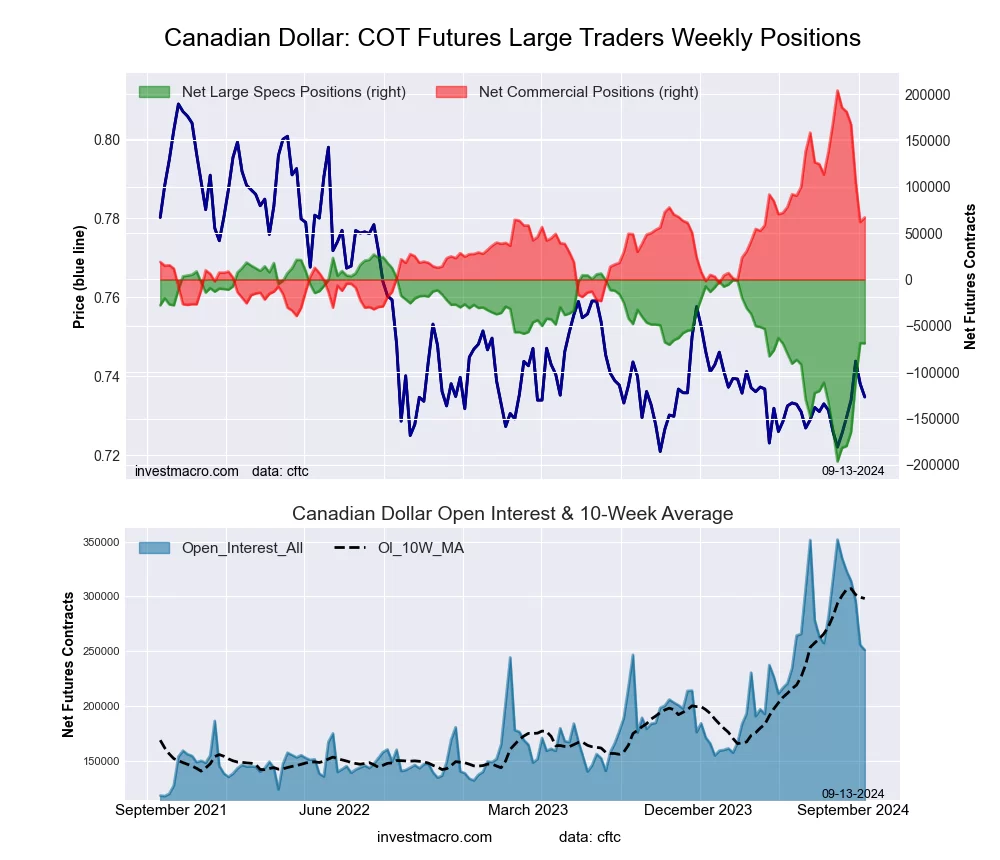
The Canadian Dollar large speculator standing this week equaled a net position of -164,410 contracts in the data reported through Tuesday. This was a weekly lift of 15,201 contracts from the previous week which had a total of -179,611 net contracts.

This week’s current strength score (the trader positioning range over the past three years, measured from 0 to 100) shows the speculators are currently Bearish-Extreme with a score of 14.3 percent. The commercials are Bullish-Extreme with a score of 84.9 percent and the small traders (not shown in chart) are Bearish with a score of 23.1 percent.

Price Trend-Following Model: Weak Downtrend

Our weekly trend-following model classifies the current market price position as: Weak Downtrend. The current action for the model is considered to be: Hold – Maintain Short Position.

CANADIAN DOLLAR StatisticsSPECULATORSCOMMERCIALSSMALL TRADERS
– Percent of Open Interest Longs:6.282.29.6
– Percent of Open Interest Shorts:58.629.110.4
– Net Position:-164,410167,006-2,596
– Gross Longs:19,528258,24630,062
– Gross Shorts:183,93891,24032,658
– Long to Short Ratio:0.1 to 12.8 to 10.9 to 1
NET POSITION TREND:
– Strength Index Score (3 Year Range Pct):14.384.923.1
– Strength Index Reading (3 Year Range):Bearish-ExtremeBullish-ExtremeBearish
NET POSITION MOVEMENT INDEX:
– 6-Week Change in Strength Index:-23.822.1-1.5


Australian Dollar Futures:

Australian Dollar Forex Futures COT Chart
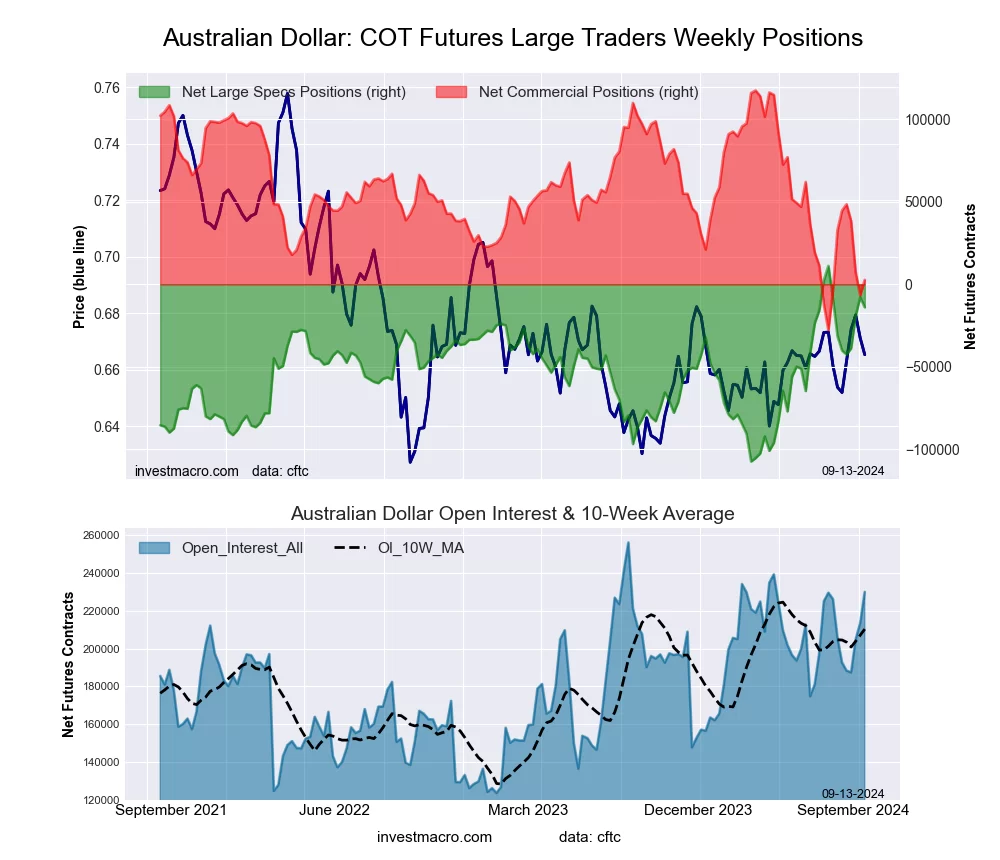
The Australian Dollar large speculator standing this week equaled a net position of -38,885 contracts in the data reported through Tuesday. This was a weekly boost of 3,731 contracts from the previous week which had a total of -42,616 net contracts.

This week’s current strength score (the trader positioning range over the past three years, measured from 0 to 100) shows the speculators are currently Bullish with a score of 57.9 percent. The commercials are Bearish with a score of 45.6 percent and the small traders (not shown in chart) are Bullish with a score of 57.5 percent.

Price Trend-Following Model: Strong Uptrend

Our weekly trend-following model classifies the current market price position as: Strong Uptrend. The current action for the model is considered to be: Hold – Maintain Long Position.

AUSTRALIAN DOLLAR StatisticsSPECULATORSCOMMERCIALSSMALL TRADERS
– Percent of Open Interest Longs:37.747.713.5
– Percent of Open Interest Shorts:58.427.313.2
– Net Position:-38,88538,366519
– Gross Longs:70,55489,42925,338
– Gross Shorts:109,43951,06324,819
– Long to Short Ratio:0.6 to 11.8 to 11.0 to 1
NET POSITION TREND:
– Strength Index Score (3 Year Range Pct):57.945.657.5
– Strength Index Reading (3 Year Range):BullishBearishBullish
NET POSITION MOVEMENT INDEX:
– 6-Week Change in Strength Index:-34.834.7-24.0


New Zealand Dollar Futures:

New Zealand Dollar Forex Futures COT Chart
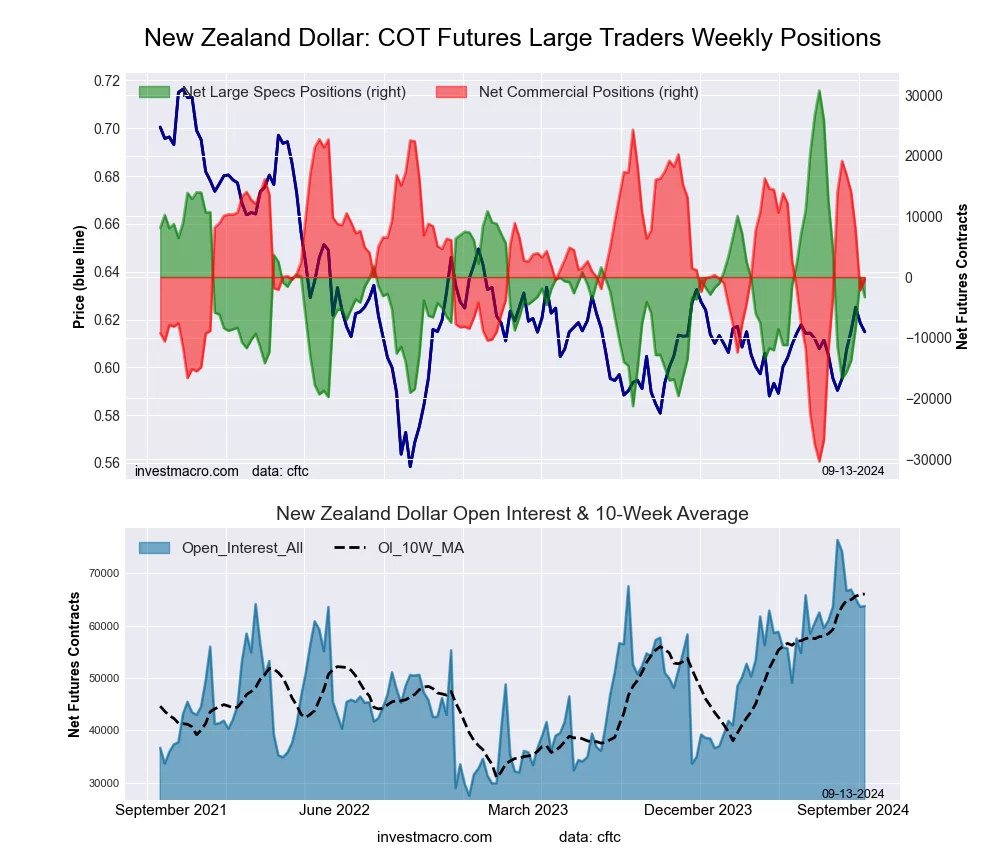
The New Zealand Dollar large speculator standing this week equaled a net position of -13,769 contracts in the data reported through Tuesday. This was a weekly increase of 1,855 contracts from the previous week which had a total of -15,624 net contracts.

This week’s current strength score (the trader positioning range over the past three years, measured from 0 to 100) shows the speculators are currently Bearish-Extreme with a score of 14.4 percent. The commercials are Bullish-Extreme with a score of 81.2 percent and the small traders (not shown in chart) are Bullish with a score of 55.3 percent.

Price Trend-Following Model: Strong Uptrend

Our weekly trend-following model classifies the current market price position as: Strong Uptrend. The current action for the model is considered to be: Hold – Maintain Long Position.

NEW ZEALAND DOLLAR StatisticsSPECULATORSCOMMERCIALSSMALL TRADERS
– Percent of Open Interest Longs:28.364.26.7
– Percent of Open Interest Shorts:48.943.27.0
– Net Position:-13,76914,000-231
– Gross Longs:18,88742,9074,465
– Gross Shorts:32,65628,9074,696
– Long to Short Ratio:0.6 to 11.5 to 11.0 to 1
NET POSITION TREND:
– Strength Index Score (3 Year Range Pct):14.481.255.3
– Strength Index Reading (3 Year Range):Bearish-ExtremeBullish-ExtremeBullish
NET POSITION MOVEMENT INDEX:
– 6-Week Change in Strength Index:-76.374.7-16.0


Mexican Peso Futures:

Mexican Peso Futures COT Chart
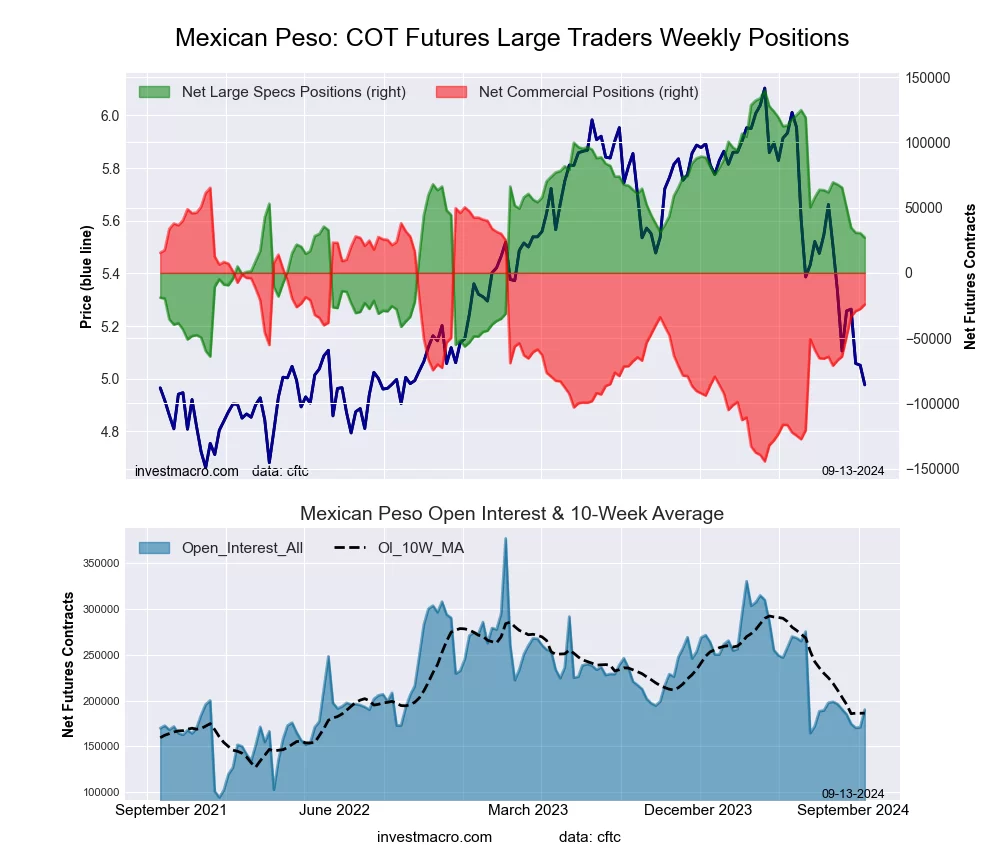
The Mexican Peso large speculator standing this week equaled a net position of 34,646 contracts in the data reported through Tuesday. This was a weekly decrease of -15,448 contracts from the previous week which had a total of 50,094 net contracts.

This week’s current strength score (the trader positioning range over the past three years, measured from 0 to 100) shows the speculators are currently Bearish with a score of 48.5 percent. The commercials are Bullish with a score of 53.0 percent and the small traders (not shown in chart) are Bearish-Extreme with a score of 3.3 percent.

Price Trend-Following Model: Strong Downtrend

Our weekly trend-following model classifies the current market price position as: Strong Downtrend. The current action for the model is considered to be: Hold – Maintain Short Position.

MEXICAN PESO StatisticsSPECULATORSCOMMERCIALSSMALL TRADERS
– Percent of Open Interest Longs:38.257.32.3
– Percent of Open Interest Shorts:18.476.53.0
– Net Position:34,646-33,410-1,236
– Gross Longs:66,745100,0923,948
– Gross Shorts:32,099133,5025,184
– Long to Short Ratio:2.1 to 10.7 to 10.8 to 1
NET POSITION TREND:
– Strength Index Score (3 Year Range Pct):48.553.03.3
– Strength Index Reading (3 Year Range):BearishBullishBearish-Extreme
NET POSITION MOVEMENT INDEX:
– 6-Week Change in Strength Index:-14.115.4-23.3


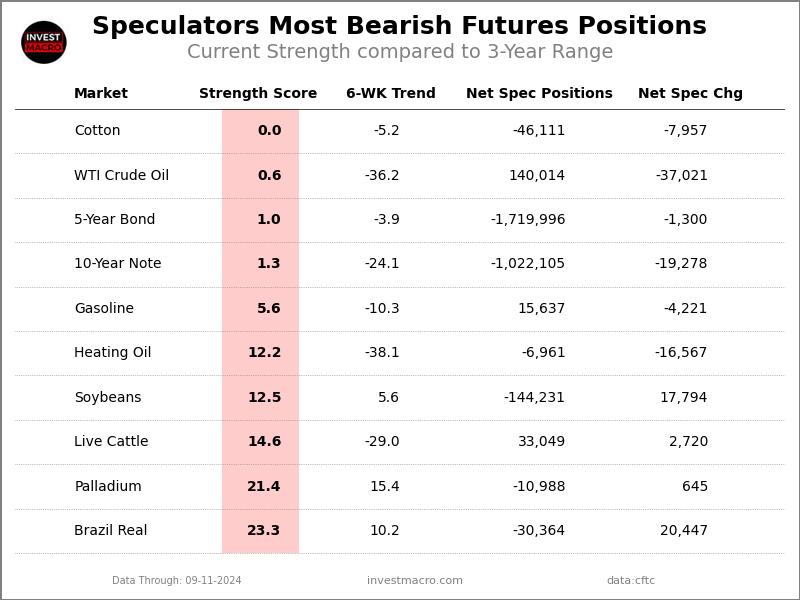
Brazilian Real Futures:

Brazil Real Futures COT Chart
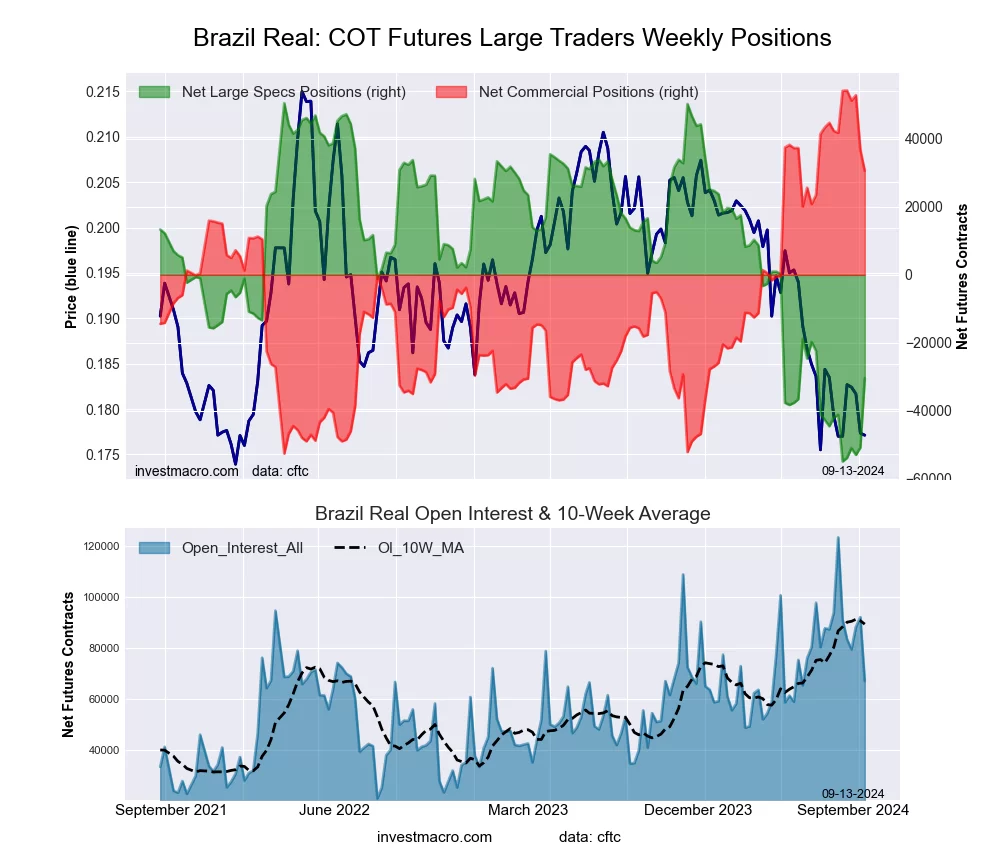
The Brazilian Real large speculator standing this week equaled a net position of -50,955 contracts in the data reported through Tuesday. This was a weekly increase of 2,887 contracts from the previous week which had a total of -53,842 net contracts.

This week’s current strength score (the trader positioning range over the past three years, measured from 0 to 100) shows the speculators are currently Bearish-Extreme with a score of 3.7 percent. The commercials are Bullish-Extreme with a score of 97.2 percent and the small traders (not shown in chart) are Bearish with a score of 31.8 percent.

Price Trend-Following Model: Downtrend

Our weekly trend-following model classifies the current market price position as: Downtrend. The current action for the model is considered to be: Hold – Maintain Short Position.

BRAZIL REAL StatisticsSPECULATORSCOMMERCIALSSMALL TRADERS
– Percent of Open Interest Longs:18.178.62.9
– Percent of Open Interest Shorts:82.214.23.2
– Net Position:-50,95551,235-280
– Gross Longs:14,35562,4902,300
– Gross Shorts:65,31011,2552,580
– Long to Short Ratio:0.2 to 15.6 to 10.9 to 1
NET POSITION TREND:
– Strength Index Score (3 Year Range Pct):3.797.231.8
– Strength Index Reading (3 Year Range):Bearish-ExtremeBullish-ExtremeBearish
NET POSITION MOVEMENT INDEX:
– 6-Week Change in Strength Index:-7.87.33.9


Bitcoin Futures:

Bitcoin Crypto Futures COT Chart
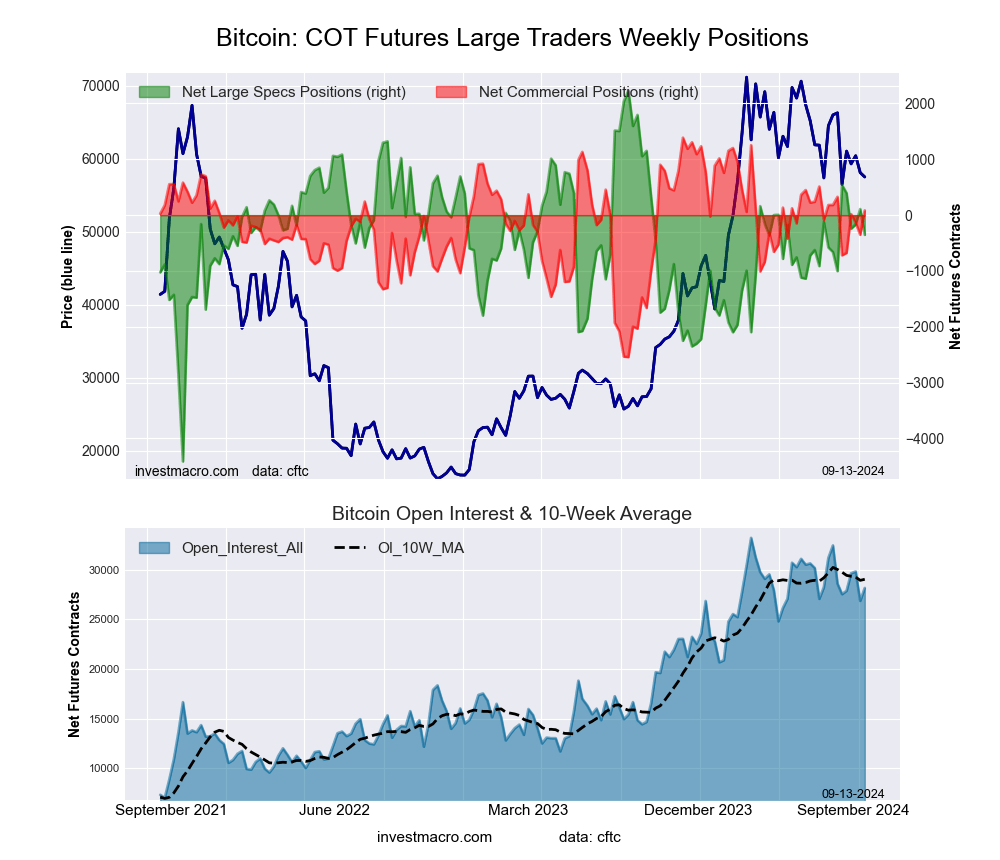
The Bitcoin large speculator standing this week equaled a net position of -243 contracts in the data reported through Tuesday. This was a weekly lowering of -638 contracts from the previous week which had a total of 395 net contracts.

This week’s current strength score (the trader positioning range over the past three years, measured from 0 to 100) shows the speculators are currently Bullish with a score of 62.7 percent. The commercials are Bullish with a score of 65.1 percent and the small traders (not shown in chart) are Bearish-Extreme with a score of 18.1 percent.

Price Trend-Following Model: Downtrend

Our weekly trend-following model classifies the current market price position as: Downtrend. The current action for the model is considered to be: Hold – Maintain Short Position.

BITCOIN StatisticsSPECULATORSCOMMERCIALSSMALL TRADERS
– Percent of Open Interest Longs:81.13.14.1
– Percent of Open Interest Shorts:81.93.13.3
– Net Position:-24317226
– Gross Longs:24,0169271,215
– Gross Shorts:24,259910989
– Long to Short Ratio:1.0 to 11.0 to 11.2 to 1
NET POSITION TREND:
– Strength Index Score (3 Year Range Pct):62.765.118.1
– Strength Index Reading (3 Year Range):BullishBullishBearish-Extreme
NET POSITION MOVEMENT INDEX:
– 6-Week Change in Strength Index:-1.92.70.5


Article By InvestMacroReceive our weekly COT Newsletter

*COT Report: The COT data, released weekly to the public each Friday, is updated through the most recent Tuesday (data is 3 days old) and shows a quick view of how large speculators or non-commercials (for-profit traders) were positioned in the futures markets.

The CFTC categorizes trader positions according to commercial hedgers (traders who use futures contracts for hedging as part of the business), non-commercials (large traders who speculate to realize trading profits) and nonreportable traders (usually small traders/speculators) as well as their open interest (contracts open in the market at time of reporting). See CFTC criteria here.

Speculator Extremes: Yen, Gold, 5-Year, 10-Year & Cotton lead Bullish & Bearish Positions

By InvestMacro

The latest update for the weekly Commitment of Traders (COT) report was released by the Commodity Futures Trading Commission (CFTC) on Friday for data ending on August 20th.

This weekly Extreme Positions report highlights the Most Bullish and Most Bearish Positions for the speculator category. Extreme positioning in these markets can foreshadow strong moves in the underlying market.

To signify an extreme position, we use the Strength Index (also known as the COT Index) of each instrument, a common method of measuring COT data. The Strength Index is simply a comparison of current trader positions against the range of positions over the previous 3 years. We use over 80 percent as extremely bullish and under 20 percent as extremely bearish. (Compare Strength Index scores across all markets in the data table or cot leaders table)


Here Are This Week’s Most Bullish Speculator Positions:

Japanese Yen


The Japanese Yen speculator position comes in as the most bullish extreme standing again this week following a recent change in policy for the BOJ and position switching of speculators. The Japanese Yen speculator level is currently at a 100.0 percent score of its 3-year range.

The six-week trend for the percent strength score totaled 98.9 this week. The overall net speculator position was a total of 23,585 net contracts this week with a small gain of 481 contract in the weekly speculator bets.


Speculators or Non-Commercials Notes:

Speculators, classified as non-commercial traders by the CFTC, are made up of large commodity funds, hedge funds and other significant for-profit participants. The Specs are generally regarded as trend-followers in their behavior towards price action – net speculator bets and prices tend to go in the same directions. These traders often look to buy when prices are rising and sell when prices are falling. To illustrate this point, many times speculator contracts can be found at their most extremes (bullish or bearish) when prices are also close to their highest or lowest levels.

These extreme levels can be dangerous for the large speculators as the trade is most crowded, there is less trading ammunition still sitting on the sidelines to push the trend further and prices have moved a significant distance. When the trend becomes exhausted, some speculators take profits while others look to also exit positions when prices fail to continue in the same direction. This process usually plays out over many months to years and can ultimately create a reverse effect where prices start to fall and speculators start a process of selling when prices are falling.


Gold


The Gold speculator position comes next in the extreme standings this week. The Gold speculator level is also at a 100.0 percent score of its 3-year range.

The six-week trend for the percent strength score was 15.3 this week. The speculator position registered 291,253 net contracts this week with a weekly boost by 23,989 contracts in speculator bets.


VIX


The VIX speculator position comes in third this week in the extreme standings. The VIX speculator level resides at a 88.5 percent score of its 3-year range.

The six-week trend for the speculator strength score came in at 39.9 this week. The overall speculator position was -24,592 net contracts this week with a decline of -4,330 contracts in the weekly speculator bets.


Coffee


The Coffee speculator position comes up number four in the extreme standings this week. The Coffee speculator level is at a 88.4 percent score of its 3-year range.

The six-week trend for the speculator strength score totaled a change of -11.0 this week. The overall speculator position was 64,158 net contracts this week with an increase by 5,218 contracts in the speculator bets.


Silver


The Silver speculator position rounds out the top five in this week’s bullish extreme standings. The Silver speculator level sits at a 84.1 percent score of its 3-year range. The six-week trend for the speculator strength score was -15.9 this week.

The speculator position was 49,324 net contracts this week with a rise of 4,035 contracts in the weekly speculator bets.


This Week’s Most Bearish Speculator Positions:

5-Year Bond


The 5-Year Bond speculator position comes in as the most bearish extreme standing this week. The 5-Year Bond speculator level is at a 0.0 percent score of its 3-year range.

The six-week trend for the speculator strength score was -9.9 this week. The overall speculator position was -1,736,810 net contracts this week with a drop of -41,738 contracts in the speculator bets.


10-Year Note


The 10-Year Note speculator position comes in next for the most bearish extreme standing on the week. The 10-Year Note speculator level is at a 0.0 percent score of its 3-year range.

The six-week trend for the speculator strength score was -50.9 this week. The speculator position was -1,038,112 net contracts this week with a decline by -177,869 contracts in the weekly speculator bets.


Cotton


The Cotton speculator position comes in as third most bearish extreme standing of the week. The Cotton speculator level resides at a 0.0 percent score of its 3-year range.

The six-week trend for the speculator strength score was -11.2 this week. The overall speculator position was -42,828 net contracts this week with a dip of -1,158 contracts in the speculator bets.


Brazil Real


The Brazil Real speculator position comes in as this week’s fourth most bearish extreme standing. The Brazil Real speculator level is at a 3.7 percent score of its 3-year range.

The six-week trend for the speculator strength score was -7.8 this week. The speculator position was -50,955 net contracts this week with a gain by 2,887 contracts in the weekly speculator bets.


Soybeans


Finally, the Soybeans speculator position comes in as the fifth most bearish extreme standing for this week. The Soybeans speculator level is at a 4.3 percent score of its 3-year range.

The six-week trend for the speculator strength score was -6.8 this week. The speculator position was -178,893 net contracts this week with a reduction by -13,170 contracts in the weekly speculator bets.


Article By InvestMacroReceive our weekly COT Newsletter

*COT Report: The COT data, released weekly to the public each Friday, is updated through the most recent Tuesday (data is 3 days old) and shows a quick view of how large speculators or non-commercials (for-profit traders) were positioned in the futures markets.

The CFTC categorizes trader positions according to commercial hedgers (traders who use futures contracts for hedging as part of the business), non-commercials (large traders who speculate to realize trading profits) and nonreportable traders (usually small traders/speculators) as well as their open interest (contracts open in the market at time of reporting). See CFTC criteria here.

Quantum information theorists are shedding light on entanglement, one of the spooky mysteries of quantum mechanics

By William Mark Stuckey, Elizabethtown College 

The year 2025 marks the 100th anniversary of the birth of quantum mechanics. In the century since the field’s inception, scientists and engineers have used quantum mechanics to create technologies such as lasers, MRI scanners and computer chips.

Today, researchers are looking toward building quantum computers and ways to securely transfer information using an entirely new sister field called quantum information science.

But despite creating all these breakthrough technologies, physicists and philosophers who study quantum mechanics still haven’t come up with the answers to some big questions raised by the field’s founders. Given recent developments in quantum information science, researchers like me are using quantum information theory to explore new ways of thinking about these unanswered foundational questions. And one direction we’re looking into relates Albert Einstein’s relativity principle to the qubit.

Quantum computers

Quantum information science focuses on building quantum computers based on the quantum “bit” of information, or qubit. The qubit is historically grounded in the discoveries of physicists Max Planck and Einstein. They instigated the development of quantum mechanics in 1900 and 1905, respectively, when they discovered that light exists in discrete, or “quantum,” bundles of energy.

These quanta of energy also come in small forms of matter, such as atoms and electrons, which make up everything in the universe. It is the odd properties of these tiny packets of matter and energy that are responsible for the computational advantages of the qubit.

A computer based on a quantum bit rather than a classical bit could have a significant computing advantage. And that’s because a classical bit produces a binary response – either a 1 or a 0 – to only one query.

In contrast, the qubit produces a binary response to infinitely many queries using the property of quantum superposition. This property allows researchers to connect multiple qubits in what’s called a quantum entangled state. Here, the entangled qubits act collectively in a way that arrays of classical bits cannot.

That means a quantum computer can do some calculations much faster than an ordinary computer. For example, one device reportedly used 76 entangled qubits to solve a sampling problem 100 trillion times faster than a classical computer.

But the exact force or principle of nature responsible for this quantum entangled state that underlies quantum computing is a big unanswered question. A solution that my colleagues and I in quantum information theory have proposed has to do with Einstein’s relativity principle.

Quantum superposition and entanglement allow qubits to contain far more information than classical bits.

Quantum information theory

The relativity principle says that the laws of physics are the same for all observers, regardless of where they are in space, how they’re oriented or how they’re moving relative to each other. My team showed how to use the relativity principle in conjunction with the principles of quantum information theory to account for quantum entangled particles.

Quantum information theorists like me think about quantum mechanics as a theory of information principles rather than a theory of forces. That’s very different than the typical approach to quantum physics, in which force and energy are important concepts for doing the calculations. In contrast, quantum information theorists don’t need to know what sort of physical force might be causing the mysterious behavior of entangled quantum particles.

That gives us an advantage for explaining quantum entanglement because, as physicist John Bell proved in 1964, any explanation for quantum entanglement in terms of forces requires what Einstein called “spooky actions at a distance.”

That’s because the measurement outcomes of the two entangled quantum particles are correlated – even if those measurements are done at the same time and the particles are physically separated by a vast distance. So, if a force is causing quantum entanglement, it would have to act faster than the speed of light. And a faster-than-light force violates Einstein’s theory of special relativity.

Quantum entanglement is important to quantum computing.

Many researchers are trying to find an explanation for quantum entanglement that doesn’t require spooky actions at a distance, like my team’s proposed solution.

Classical and quantum entanglement

In entanglement, you can know something about two particles collectively – call them particle 1 and particle 2 – so that when you measure particle 1, you immediately know something about particle 2.

Imagine you’re mailing two friends, whom physicists typically call Alice and Bob, each one glove from the same pair of gloves. When Alice opens her box and sees a left-hand glove, she’ll know immediately that when Bob opens the other box he will see the right-hand glove. Each box and glove combination produces one of two outcomes, either a right-hand glove or a left-hand glove. There’s only one possible measurement – opening the box – so Alice and Bob have entangled classical bits of information.

But in quantum entanglement the situation involves entangled qubits, which behave very differently than classical bits.

Qubit behavior

Consider a property of electrons called spin. When you measure an electron’s spin using magnets that are oriented vertically, you always get a spin that’s up or down, nothing in between. That’s a binary measurement outcome, so this is a bit of information.

Two diagrams showing electrons passing through magnets. The top diagram shows one on top and one below the electrons' path. The electrons are either deflected up or down, as indicated by the split paths, after passing through the magnet. The bottom diagram shows two magnets, one on the left and one on the right of the electrons' path. The electrons are either deflected left or right, as indicated by the split paths, after passing through the magnet.
Two magnets oriented vertically can measure an electron’s vertical spin. After moving through the magnets, the electron is deflected either up or down. Similarly, two magnets oriented horizontally can measure an electron’s horizontal spin. After moving through the magnets, the electron is deflected either left or right.
Timothy McDevitt

If you turn the magnets on their sides to measure an electron’s spin horizontally, you always get a spin that’s left or right, nothing in between. The vertical and horizontal orientations of the magnets constitute two different measurements of this same bit. So, electron spin is a qubit – it produces a binary response to multiple measurements.

Quantum superposition

Now suppose you first measure an electron’s spin vertically and find it is up, then you measure its spin horizontally. When you stand straight up, you don’t move to your right or your left at all. So, if I measure how much you move side to side as you stand straight up, I’ll get zero.

That’s exactly what you might expect for the vertical spin up electrons. Since they have vertically oriented spin up, analogous to standing straight up, they should not have any spin left or right horizontally, analogous to moving side to side.

Surprisingly, physicists have found that half of them are horizontally right and half are horizontally left. Now it doesn’t seem to make sense that a vertical spin up electron has left spin (-1) and right spin (+1) outcomes when measured horizontally, just as we expect no side-to-side movement when standing straight up.

But when you add up all the left (-1) and right (+1) spin outcomes you do get zero, as we expected in the horizontal direction when our spin state is vertical spin up. So, on average, it’s like having no side-to-side or horizontal movement when we stand straight up.

This 50-50 ratio over the binary (+1 and -1) outcomes is what physicists are talking about when they say that a vertical spin up electron is in a quantum superposition of horizontal spins left and right.

Entanglement from the relativity principle

According to quantum information theory, all of quantum mechanics, to include its quantum entangled states, is based on the qubit with its quantum superposition.

What my colleagues and I proposed is that this quantum superposition results from the relativity principle, which (again) states the laws of physics are the same for all observers with different orientations in space.

If the electron with a vertical spin in the up direction were to pass straight through the horizontal magnets as you might expect, it would have no spin horizontally. This would violate the relativity principle, which says the particle should have a spin regardless of whether it’s being measured in the horizontal or vertical direction.

Because an electron with a vertical spin in the up direction does have a spin when measured horizontally, quantum information theorists can say that the relativity principle is (ultimately) responsible for quantum entanglement.

And since there is no force used in this principle explanation, there are none of the “spooky actions at a distance” that Einstein derided.

With quantum entanglement’s technological implications for quantum computing firmly established, it’s nice to know that one big question about its origin may be answered with a highly regarded physics principle.The Conversation

About the Author:

William Mark Stuckey, Professor of Physics, Elizabethtown College

This article is republished from The Conversation under a Creative Commons license. Read the original article.


Week Ahead: Nvidia earnings showdown could set market tone

By ForexTime 

  • Nvidia shares ↑150% year-to-date
  • Data center business and Q3 guidance in focus
  • Shares could move 10.4% ↑ or ↓ post earnings
  • Prices edging higher on H1 but RSI near oversold
  • Technical levels – $130, $119, 200 SMA and $110

Financial markets may end August with a bang thanks to key data and high-impact events.

Earnings from tech titan Nvidia and the Fed’s preferred inflation gauge have the potential to set the tone for the new trading month:

Monday, 26th Aug

  • GER40: Germany IFO business climate
  • NGN: Nigeria GDP
  • SG20: Singapore industrial production
  • US500: US durable goods

Tuesday, 27th Aug

  • CN50: China industrial profits
  • GER40: Germany GDP
  • AU200: BHP, Woodside Energy earnings
  • US30: US Conference Board consumer confidence

Wednesday 28th Aug

  • AU200: Australia CPI
  • NAS100: Nvidia earnings
  • USDInd: Atlanta Fed President Raphael Bostic speech

Thursday, 29th Aug

  • EU50: Eurozone consumer confidence
  • GER40: Germany CPI
  • SEK: Sweden GDP
  • US500: US GDP, initial jobless claims, Fed speak

Friday, 30th Aug

  • CHINAH: ICBC (China’s largest commercial bank) earnings
  • CAD: Canada GDP
  • EU50: Eurozone CPI, German unemployment
  • JP225: Japan unemployment, Tokyo CPI, industrial production, retail sales
  • US500: US PCE report, University of Michigan consumer sentiment

The end of earnings season is near, and Nvidia now comes into sharp focus, after mostly disappointing results from the so-called Magnificent Seven.

When considering Nvidia’s central role in the AI boom, its upcoming earnings have the potential to shape market sentiment with investors undoubtedly looking for another round of outstanding results.

Fun fact: Nvidia shares are up roughly 150% since the start of 2024

When will earnings be published

Nvidia reports its earnings for the second quarter of its 2025 fiscal year after US markets close on Wednesday 28th August.

Market expectations

The tech giant is forecast to post earnings per share of $0.65 compared to $0.27 a year ago.

Quarterly revenues are expected to rise $28.7 billion from $13.5 billion in the prior year – representing a 112.6% increase.  

Investors will also be paying close attention to the data center segment and whether earning guidance is raised for Q3.

As highlighted earlier, there is little room for error with exceptional results needed to justify its whopping $3 trillion valuation.

Potential challenges

  • Concerns over the Blackwell chip delay potentially weighing on the business outlook.
  • Increasing competition from the likes of AMD and Intel which are investing in their own AI chips.
  • Potential US bans hitting demand for Nvidia chips in China

How will Nvidia shares react to earnings

Markets are forecasting a 10.4% move, either Up or Down, for Nvidia stocks on Thursday post earnings. 

This is equivalent to a move of roughly $300 billion, bigger than the entire market cap of many large companies in the S&P500 and Nasdaq 100.

How will wider markets be influenced?

Over the past 12 months, the Nasdaq 100 has shown a 74% positive correlation with Nvidia shares.

But more interestingly, over a rolling 5-day from the past 10 years:

  • US500: +97%
  • UK100: +53%
  • Intel Corp: +95%
  • Broadcom: +99%
  • Advanced Micro Devices: +90%

What does this mean?

Given how some US and European equities are trading near all-time highs, a positive set of results from Nvidia could mean fresh upside gains – opening the doors to more records.

Technical forces

Prices may continue to consolidate within a range until the earnings are published.

Still, Nvidia stocks have been trending higher on the H1 charts with prices above the 100 and 200- SMA. But weakness below the 50 SMA could signal a decline toward the 119.00 support regions. Keep an eye on the Relative Strength Index (RSI) index is edging towards oversold levels.

  • Key levels of interest can be found at $130, 119, 200 SMA and $110.

vd


Forex-Time-LogoArticle by ForexTime

ForexTime Ltd (FXTM) is an award winning international online forex broker regulated by CySEC 185/12 www.forextime.com

Banana apocalypse, part 2 – a genomicist explains the tricky genetics of the fungus devastating bananas worldwide

By Li-Jun Ma, UMass Amherst 

Did you know that the bananas you eat today are not the same type as the ones people were eating a few generations ago? The banana you might have had with your breakfast today is a variety called the Cavendish banana, while the one that was in grocery stores up to the 1950s was a variety called Gros Michel, which was wiped out by a disease called Fusarium wilt of banana, or FWB.

FWB of Gros Michel was caused by Fusarium oxysporum race 1, a fungal pathogen that affects bananas. This fungal infection kills a plant by occupying its vascular system, blocking water and mineral transportation.

Plant biologists developed the Fusarium-resistant Cavendish variety to replace the Gros Michel. Yet, over the past few decades, a resurgence of FWB caused by a different strain of the same fungus called tropical race 4, or TR4, is once again threatening global banana production.

How did Fusarium oxysporum gain the ability to overcome resistance and infect so many different plants?

The two-part genome of F. oxysporum

I am a genomicist who has spent the past decade studying the genetic evolution of Fusarium oxysporum. As a species complex, F. oxysporum can cause wilt and root rot diseases in over 120 plant species. Certain strains can also infect people.

In 2010, my lab discovered that each F. oxysporum genome can be divided into two parts: a core genome shared among all strains that codes for essential housekeeping functions, and an accessory genome varying from strain to strain that codes for specialized functions like the ability to infect a specific plant host.

Each species of plant has a sophisticated immune response to defend against microbial invasion. So to establish an infection, each F. oxysporum strain uses its accessory genome to suppress a plant’s unique defense system. This functional compartmentalization allows F. oxysporum to greatly increase its host range.

Petri dish with four red, oblong colonies crowing on separate corners
The genomic structure of Fusarium oxysporum allows it to have a wide range of hosts, such as tomatoes, cucumbers and watermelon.
Edward L. Barnard, Florida Department of Agriculture and Consumer Services, Bugwood.org, CC BY-SA

In our newly published research, my team and colleagues in China and South Africa found that the TR4 strain that kills Cavendish bananas has a different evolutionary origin and different sequences in its accessory genome compared with the strain that killed Gros Michel bananas.

Looking at the interface of where the TR4 strain is battling with its Cavendish banana host, we found that some of its activated accessory genes release nitric oxide, a gas harmful to the Cavendish banana. This sudden burst of toxic gases facilitates infection by disarming the plant’s defense system. At the same time, the fungus protects itself by increasing production of chemicals that detoxify nitric oxide.

Increasing banana diversity

In tracing the global spread of this new version of Fusarium oxysporum, we realized that a major cause for the recent resurgence of this fungal infection is the domination of the international banana industry by a single clone of banana.

Growing different varieties of bananas can make agriculture more sustainable and reduce disease pressure on a single crop. Farmers and researchers can control Fusarium wilt of banana by identifying or developing banana varieties that are tolerant or resistant to TR4. Our findings suggest that another way to protect Cavendish bananas would be to design effective nitric oxide scavengers to reduce the toxic pressure of the gas burst.

The banana industry has dark origins.

It can be hard to imagine how a consumer who simply enjoys eating bananas could participate in the battle against the disease devastating banana crops. However, consumers determine the market, and farmers are forced to grow what the market demands.

You can help increase banana diversity in your supermarket by intentionally trying one or more of the other hundreds of other existing banana varieties when they show up there. You can also buy local varieties of other fruits and agricultural products to help preserve plant diversity and support local growers.

Collaboration among scientists, farmers, industry and consumers around the world can help avoid future shortages of bananas and other crops.The Conversation

About the Author:

Li-Jun Ma, Professor of Biochemistry and Molecular Biology, UMass Amherst

This article is republished from The Conversation under a Creative Commons license. Read the original article.


Thailand’s democracy has taken another hit, but the country’s progressive forces won’t be stopped

By Adam Simpson, University of South Australia 

After two tumultuous weeks in Thai politics, the country has a new prime minister and new opposition party in parliament. The sweeping changes have demonstrated yet again the power of the Constitutional Court over Thailand’s fragile democratic institutions.

The political intrigue began on August 7 when the court dissolved the progressive Move Forward Party, the main opposition party in parliament following its surprising showing in the 2023 national elections.

Two days later, the party reconstituted itself as the People’s Party and announced it would continue to lead the opposition.

Then, on August 14, the Constitutional Court disqualified Prime Minister Srettha Thavisin of the Pheu Thai party from holding the post, and removed him from office.

And two days after that decision, the parliament duly elected Pheu Thai leader Paetongtarn Shinawatra as his replacement. She is the third member of her family to serve as prime minister after her father, Thaksin Shinawatra (2001–06), and aunt, Yingluck Shinawatra (2011–14).

Unfortunately, these kinds of incidents have become normalised in Thailand. They demonstrate the extent to which conservative forces in the country continue to use various tools of “lawfare”, including the Constitutional Court, to target opposition politicians and parties and stifle the will of the people.

Despite these setbacks to Thailand’s democracy, the country is changing fast. It is becoming more progressive and less submissive to military and monarchy authority.

So, these latest manoeuvres by the country’s gerontocracy may not be a show of strength after all. Rather, as one Thai politics expert put it, these moves may be the “last gasp” of the conservative old guard that has long dominated Thai politics and society.

Revolving door of prime ministers

Over the last two decades, five prime ministers from the Pheu Thai party and its predecessors have been forced from office.

Thaksin Shinawatra was removed in a military coup in September 2006 and his party was later dissolved by the Constitutional Court.

Yingluck Shinatwatra led another successor party to a win at the 2011 elections, but she, too, was removed from power by the Constitutional Court in 2014, followed by another military coup.

With Paetongtarn Shinawatra’s elevation to prime minister last week, the powerful Shinawatra family has made a stunning return to the top of Thai politics. However, this may not be quite the triumphant re-establishment of a family political dynasty that Thaksin Shinawatra expects.

Paetongtarn Shinawatra is just 37 years old and inexperienced. And despite the fact the economy showed some growth in the first quarter of this year, her government faces significant economic challenges, such as high levels of household and corporate debt and an economic slowdown in the US and China.

Thaksin Shinawatra also remains in the cross-hairs of the conservative military establishment. After spending 15 years in self-imposed exile to avoid facing charges he contends were politically motivated, he returned to Thailand last year after Pheu Thai took power.

He was then indicted in June for allegedly insulting the monarchy during a media interview in 2015.

Another new progressive party dissolved

Perhaps the more concerning development in recent days, however, was the Constitutional Court’s decision to dissolve the progressive Move Forward party, which had won the most seats in parliament in last year’s election.

Progressive politicians have fallen afoul of the court a number of times in recent years.

In the 2019 elections, for example, Future Forward, a brand new progressive political party led by a young, charismatic politician, Thanathorn Juangroongruangkit, stunned observers by winning 80 seats. The court, however, soon disqualified Thanathorn from parliament and dissolved the party.

The party reconstituted itself as Move Forward under the leadership of another young leader, Pita Limjaroenrat, and it did even better in the 2023 elections, winning 151 seats in the House of Representatives.

The court, however, suspended Pita and dissolved his party over its attempts to reform the anti-democratic lese majeste law. It also banned the party’s leadership, including Pita, from politics for ten years.

The party’s remaining MPs will be able to stay in parliament under the banner of the People’s Party, though nearly 40 are now under investigation for alleged ethics violations, including its new leader, Natthaphong Ruengpanyawut.

What does this mean for Thai democracy?

There now appear to be three distinct centres of political power in Thailand:

  • Thaksin Shinawatra and the Pheu Thai party
  • the military-monarchy complex and their associated parties
  • the new progressive People’s Party.

While Pita warned against the continued use of “lawfare” to muzzle the opposition in an essay for The Economist earlier this month, there is some room for optimism.

It appears much of the population has moved on from the nepotism and rampant self-interest that has long defined Thai politics. According to a recent poll, nearly half of respondents said their preferred prime minister would be Pita (47%), while Paetongtarn was favoured by just 10.5% and Srettha just 8.7%.

The People’s Party is also offering a much more democratic vision for Thailand, based on integrity and reforming the lese majeste law. (Its leader, Natthaphong, has acknowledged, though, that the party must now “think carefully about how to amend it”.)

The party’s electoral march towards government looks difficult to stop. It’s likely Move Forward’s win in the 2023 election will turn into a landslide for the People’s Party at the next election.

The historical obedience and submission to the monarchy and military in Thai society is gradually being whittled away, as older, conservative voters are being replaced by those who want a more democratic and responsive government.

In recent years, there has also been some improvement in Thailand for personal freedoms — notably the legalisation of same-sex marriage and cannabis. The pressure to expand and consolidate basic political freedoms within a multi-party democracy will only increase.

Thailand is not an authoritarian regime – unlike its neighbours Myanmar and Laos – and at some point in the not-too-distant future, the rapidly changing Thai society may well force the military-monarchy complex to cede power for good.The Conversation

About the Author:

Adam Simpson, Senior Lecturer, International Studies, University of South Australia

This article is republished from The Conversation under a Creative Commons license. Read the original article.

Recycling more than pop cans: A circular economy for our energy landscapes

By Martin J. Pasqualetti, Arizona State University; Chad Walker, Dalhousie University, and Michelle Adams, Dalhousie University 

From cereal boxes to our distinct milk bags, Canadians have been told that one of the best things we can do for the planet is to embrace the circular economy — reusing, repurposing or reallocating assets to ensure they’re kept within useful circulation as long as possible, and ideally forever.

Originally conceptualized as recycling, we are all familiar with the good feeling that comes from tossing paper, plastic and other materials into the blue bin rather than throwing them in a landfill. It’s time to consider applying an expanded version of this approach to what we call energy landscapes.

Considering the thousands of square kilometres that we have carved, scraped and bulldozed to produce the energy we crave, it is past time we started figuring out how we can recycle energy landscapes and make them useful for new purposes.

In our over-crowded world, we can no longer justify exploiting our landscapes for the energy we need and then simply walking away. We need to embrace a circular economy for our energy landscapes of the past and prepare to recycle the landscapes of the future.

Recycling landscapes

Recycling of energy landscapes comes to two forms; that is, the land itself and the infrastructure we place upon it.

Although rare in Canada, the idea is quickly catching on elsewhere. Lignite pits in Germany have been converted to recreational lakes. A derelict, coal-burning power plant in London has been transformed into an exhibition, condominiums and retail space.

In Nova Scotia, a 14 MW wind farm was developed at the site of the province’s coal-fired Lingan power station, and newly proposed green hydrogen production facilities are to be built on the land of stalled liquefied natural gas projects.

The idea of recycling or reusing applies not just to fossil fuels, but to renewable energy policies as well.

Last summer, the Conservative government of Alberta made decisions on the future land use of renewable energy projects like wind and solar farms. As outlined by academic Ian Urquhart earlier this year, the government’s seven-month moratorium banned all new projects under the rationale they threatened the province’s best agricultural lands and “Alberta’s pristine landscapes.”

However, the restrictions brought in, including a 35-kilometre buffer zone, do not apply to new oil and gas projects. Alberta Premier Danielle Smith’s government therefore created a unique set of recycling concerns around renewables that didn’t apply to fossil fuels.

Reusing space in an energy transition

At a time when more local smart grid projects — bringing together local renewables, battery storage, smart controls, heat pumps and electric vehicles — are being developed, there’s a need to consider how to go beyond recycling to reuse existing space and infrastructure.

Rooftop solar is an obvious choice to better utilize space, though the footprint of household and on-street EV charging infrastructure is similarly unsubstantial compared to your neighbourhood gas station.

Recycling in a clean energy transition will not only have great value in energy landscapes, but also in new clean energy technologies themselves. While we are already slowing the rise of climate change-fuelling emissions, we can go further if we advance the practice of recycling EV batteries and solar panels.

But we can’t stop there. We must also prepare to recycle the landscapes these technologies create.

Abandonment is not an option

Abandoning exhausted energy sites is wasteful, unnecessary and costly. The customary energy life cycle includes exploration, development, extraction, processing, transmission and sometimes reclamation. We advocate for an additional stage: recycling, thus preparing the land to be reimagined for another cycle of useful purpose.

We must take greater care of the precious Canadian landscape, especially those that have paid dearly to provide the energy we need. Once the land gives all it can, we should consider it not the end of the life cycle but as a new beginning.

Recycling energy landscapes as a strategy challenges the status quo. We must chart a path toward ensuring that such landscapes are repurposed to benefit both ecosystems and society, and embrace a circular economy for the land.The Conversation

About the Authors:

Martin J. Pasqualetti, Professor of Geography and Senior Global Futures Scientist, Arizona State University; Chad Walker, Assistant professor, Low-carbon Transitions, School of Planning, Dalhousie University, and Michelle Adams, Associate professor, School for Resource and Environmental Studies, Dalhousie University

This article is republished from The Conversation under a Creative Commons license. Read the original article.

AI pioneers want bots to replace human teachers – here’s why that’s unlikely

By Annette Vee, University of Pittsburgh 

OpenAI co-founder Andrej Karpathy envisions a world in which artificial intelligence bots can be made into subject matter experts that are “deeply passionate, great at teaching, infinitely patient and fluent in all of the world’s languages.” Through this vision, the bots would be available to “personally tutor all 8 billion of us on demand.”

The embodiment of that idea is his latest venture, Eureka Labs, which is merely the newest prominent example of how tech entrepreneurs are seeking to use AI to revolutionize education.

Karpathy believes AI can solve a long-standing challenge: the scarcity of good teachers who are also subject experts.

And he’s not alone. OpenAI CEO Sam Altman, Khan Academy CEO Sal Khan, venture capitalist Marc Andreessen and University of California, Berkeley computer scientist Stuart Russell also dream of bots becoming on-demand tutors, guidance counselors and perhaps even replacements for human teachers.

As a researcher focused on AI and other new writing technologies, I’ve seen many cases of high-tech “solutions” for teaching problems that fizzled. AI certainly may enhance aspects of education, but history shows that bots probably won’t be an effective substitute for humans. That’s because students have long shown resistance to machines, however sophisticated, and a natural preference to connect with and be inspired by fellow humans.

The costly challenge of teaching writing to the masses

As the director of the English Composition program at the University of Pittsburgh, I oversee instruction for some 7,000 students a year. Programs like mine have long wrestled with how to teach writing efficiently and effectively to so many people at once.

The best answer so far is to keep class sizes to no more than 15 students. Research shows that students learn writing better in smaller classes because they are more engaged.

Yet small classes require more instructors, and that can get expensive for school districts and colleges.

Resuscitating dead scholars

Enter AI. Imagine, Karpathy posits, that the great theoretical physicist Richard Feynman, who has been dead for over 35 years, could be brought back to life as a bot to tutor students.

For Karpathy, an ideal learning experience would be working through physics material “together with Feynman, who is there to guide you every step of the way.” Feynman, renowned for his accessible way of presenting theoretical physics, could work with an unlimited number of students at the same time.

In this vision, human teachers still design course materials, but they are supported by an AI teaching assistant. This teacher-AI team “could run an entire curriculum of courses on a common platform,” Karpathy wrote. “If we are successful, it will be easy for anyone to learn anything,” whether it be a lot of people learning about one subject, or one person learning about many subjects.

Other efforts to personalize learning fall short

Yet technologies for personal learning aren’t new. Exactly 100 years ago, at the 1924 meeting of the American Psychological Association, inventor Sidney Pressey unveiled an “automatic teacher” made out of typewriter parts that asked multiple-choice questions.

In the 1950s, the psychologist B. F. Skinner designed “teaching machines.” If a student answered a question correctly, the machine advanced to ask about the problem’s next step. If not, the student stayed on that step of the problem until they solved it.

In both cases, students received positive feedback for correct answers. This gave them confidence as well as skills in the subject. The problem was that students didn’t learn much – they also found these nonhuman approaches boring, education writer Audrey Watters documents in “Teaching Machines.”

More recently, the world of education saw the rise and fall of “massive open online courses,” or MOOCs. These classes, which delivered video and quizzes, were heralded by The New York Times and others for their promise of democratizing education. Again, students lost interest and logged off.

Other web-based efforts have popped up, including course platforms like Coursera and Outlier. But the same problem persists: There’s no genuine interactivity to keep students engaged. One of the latest casualties in online learning was 2U, which acquired leading MOOC company edX in 2021 and in July 2024 filed for bankruptcy restructuring to reduce its US$945 million debt load. The culprit: falling demand for services.

Now comes the proliferation of AI-fueled platforms. Khanmigo deploys AI tutors to, as Sal Khan writes in his latest book, “personalize and customize coaching, as well as adapt to an individual’s needs while hovering beside our learners as they work.”

The educational publisher Pearson, too, is integrating AI into its educational materials. More than 1,000 universities are adopting these materials for fall 2024.

AI in education isn’t just coming; it’s here. The question is how effective it will be.

Drawbacks in AI learning

Some tech leaders believe bots can customize teaching and replace human teachers and tutors, but they’re likely to face the same problem as these earlier attempts: Students may not like it.

There are important reasons why, too. Students are unlikely to be inspired and excited the way they can be by a live instructor. Students in crisis often turn to trusted adults like teachers and coaches for help. Would they do the same with a bot? And what would the bot do if they did? We don’t know yet.

A lack of data privacy and security can also be a deterrent. These platforms collect volumes of information on students and their academic performance that can be misused or sold. Legislation may try to prevent this, but some popular platforms are based in China, out of reach of U.S. law.

Finally, there are concerns even if AI tutors and teachers become popular. If a bot teaches millions of students at once, we may lose diversity of thought. Where does originality come from when everyone receives the same teachings, especially if “academic success” relies on regurgitating what the AI instructor says?

The idea of an AI tutor in every pocket sounds exciting. I would love to learn physics from Richard Feynman or writing from Maya Angelou or astronomy from Carl Sagan. But history reminds us to be cautious and keep a close eye on whether students are actually learning. The promises of personalized learning are no guarantee for positive results.The Conversation

About the Author:

Annette Vee, Associate Professor of English, University of Pittsburgh

This article is republished from The Conversation under a Creative Commons license. Read the original article.

Can Boeing Recover? Analyzing the Company’s Path to Profitability

By The Ino.com Team

Since the start of 2024, aerospace giant The Boeing Company (BA) has faced a turbulent ride, with its stock plummeting over 30%. The decline was primarily triggered by heightened regulatory scrutiny following a severe safety incident involving one of its planes earlier this year.

Boeing has been working hard to enhance its safety protocols and address regulatory concerns. While these efforts show progress, the company’s latest Q2 earnings report has done little to restore investor confidence. The results revealed a larger-than-expected loss and weaker revenue, culminating in a significant leadership shakeup, with the CEO stepping down.

What’s Going on With Boeing?

Last month, Boeing missed the earnings targets by a wide margin. Revenue for the second quarter that ended June 30, 2024, came in at $16.87 billion, down 15% year-over-year. It fell short of the $17.35 billion revenue analysts had anticipated. On the bottom line, the company posted a non-GAAP net loss of $2.90 per share, much worse than the expected negative $2.01 per share. That compared to a loss per share of $0.82 a year ago.

Moreover, the company’s free cash flow, which was positive in last year’s second quarter, has now turned negative. The company has burned more than $8.26 billion so far this year, leaving with just $12.60 billion in its cash reserves against a hefty debt of $57.90 billion. Also, it reported a cash burn of $4.3 billion in just one quarter.

The management attributed the disappointing second-quarter results to two main factors: lower commercial aircraft deliveries and significant losses on fixed-price defense development programs. During the quarter, Boeing delivered just 92 commercial planes (down 32% year-over-year), leading to a corresponding 32% decline in revenue from what was once its largest business segment.

Meanwhile, the defense, space, and security unit experienced a smaller 2% sales dip but posted a loss of $913 million, nearly double the previous year’s loss of $527 million. Profit margins continued to worsen across these segments. The global services division was the only area with slight improvement, reflecting a 3% revenue increase and a 2% rise in operating earnings, but even here, profit margins declined.

Boeing’s disappointing results came during a period of intense scrutiny, as it faces multiple investigations into its safety practices and manufacturing standards. The company recently pleaded guilty to a federal fraud charge tied to its 737 Max following two fatal crashes that killed 346 people. As a result, the FAA has increased its oversight and limited BA’s production capacity after a serious incident involving an Alaska Airlines Max.

Furthermore, CFO Brian West warned that due to “near-term working capital pressures,” the third quarter will likely see another outflow of cash.

Boeing’s Critical Challenges

Boeing’s troubles are no secret; its repair list is long and daunting. For instance, the company’s commercial airplanes unit has struggled with recurring quality control problems, including serious incidents like doors falling off planes.

In the defense sector, Boeing is struggling with the Pentagon’s push for fixed-price contracts, leading to significant financial write-downs, like those from the Air Force tanker deal. That puts Boeing in a tough spot: accept risky fixed-price contracts or risk losing future defense agreements to competitors who will agree to them.

The company’s space segment isn’t faring much better. Boeing’s Starliner crew transport, essential to fulfilling its commercial crew contract with NASA, has been stranded at the International Space Station for over two months. Boeing might face hefty write-downs and losses if it fails to safely return the astronauts. Thus, addressing these challenges head-on seems crucial for the company’s path to recovery.

A New Leader for Boeing: What’s Next?

As Boeing grapples with its ongoing challenges, outgoing CEO Dave Calhoun assured that the company is “making substantial progress” in enhancing its quality management system and preparing for the future. However, Calhoun will not be steering BA through these transitions, as he announced his retirement shortly after the second quarter earnings report.

On August 8, former Rockwell Collins and RTX executive Robert Kelly Ortberg was appointed Boeing’s new CEO. Unlike his recent predecessors, Ortberg brings a background in Mechanical Engineering, which signals a shift towards prioritizing engineering and safety. This move could address previous criticisms of cost-cutting measures and refocus the company on improving aircraft safety, ultimately benefiting shareholders by mitigating the risk of future incidents.

Can Boeing Recover?

Despite recent safety setbacks, BA’s demand for its planes remains surprisingly strong. By the end of the second quarter, the company had amassed a hefty backlog of $516 billion, which includes over 5,400 commercial plane orders. The Farnborough Airshow further highlighted this demand with 118 new orders and commitments worth $17.1 billion.

This indicates that, despite its current challenges, the appetite for the company’s planes is robust. The path to recovery will depend on Boeing’s ability to address safety issues and lift the FAA’s production cap on the 737 MAX. If the company can make these adjustments, it could quickly regain its footing, especially since it showed promising progress in 2023.

Moreover, the air travel market is set to hit new highs this year, with Airbus projecting increased air traffic in the coming years. This provides Boeing with ample growth opportunities, provided it can navigate its current issues. Street expects the company’s revenue to increase by 20.7% year-over-year in the fiscal year 2025, with a projected EPS of $4.06.

Despite the promising growth prospects, investors should be aware of several risks. There’s no guarantee that Boeing won’t face another safety incident, as seen earlier this year, which could disrupt production and financial stability. Additionally, Airbus continues to outpace the company, and the emerging Chinese C919 could erode market share if Boeing faces more setbacks. While the aerospace giant has promising prospects, navigating these risks will be crucial to sustaining long-term growth and investor confidence.

Should you Invest in Boeing?

While BA’s market cap of $110.36 billion might suggest stability, it’s far from a safe bet. With no dividends since 2020 and a streak of unprofitability since 2018, BA’s investment appeal hinges on its turnaround potential.

The big question is whether or not the new CEO, Kelly Ortberg, can turn things around and revive the company’s fortunes. If Ortberg successfully navigates the company’s current challenges, there could be a significant upside. However, until then, investing in BA is decidedly riskier than it once was.

By Ino.com – See our Trader Blog, INO TV Free & Market Analysis Alerts

Source: Can Boeing Recover? Analyzing the Company’s Path to Profitability