By InvestMacro
Here are the latest charts and statistics for the Commitment of Traders (COT) data published by the Commodities Futures Trading Commission (CFTC).
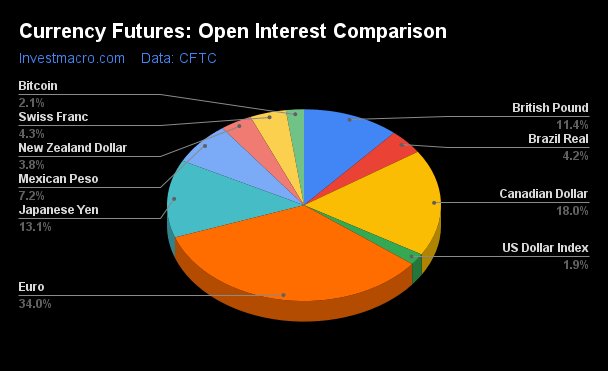
The latest COT data is updated through Tuesday November 19th and shows a quick view of how large market participants (for-profit speculators and commercial traders) were positioned in the futures markets. All currency positions are in direct relation to the US dollar where, for example, a bet for the euro is a bet that the euro will rise versus the dollar while a bet against the euro will be a bet that the euro will decline versus the dollar.
Weekly Speculator Changes led by the Japanese Yen
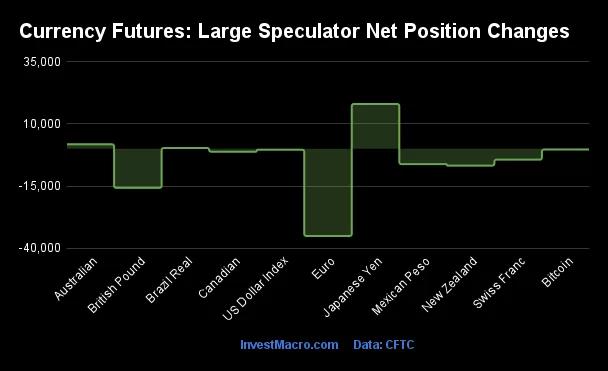
The COT currency market speculator bets were overall lower this week as just three out of the eleven currency markets we cover had higher positioning while the other eight markets had lower speculator contracts.
Leading the gains for the currency markets was the Japanese Yen (18,034 contracts) with the Australian Dollar (1,803 contracts) and the Brazilian Real (300 contracts) also showing positive weeks.
The currencies seeing declines in speculator bets on the week were the EuroFX (-35,120 contracts), the British Pound (-15,735 contracts), the New Zealand Dollar (-6,778 contracts), the Mexican Peso (-6,179 contracts), the Swiss Franc (-4,377 contracts), the Canadian Dollar (-1,177 contracts), the US Dollar Index (-401 contracts) and with Bitcoin (-286 contracts) also registering lower bets on the week.
USD Index Bets continue divergence, Speculators cut their Euro bets
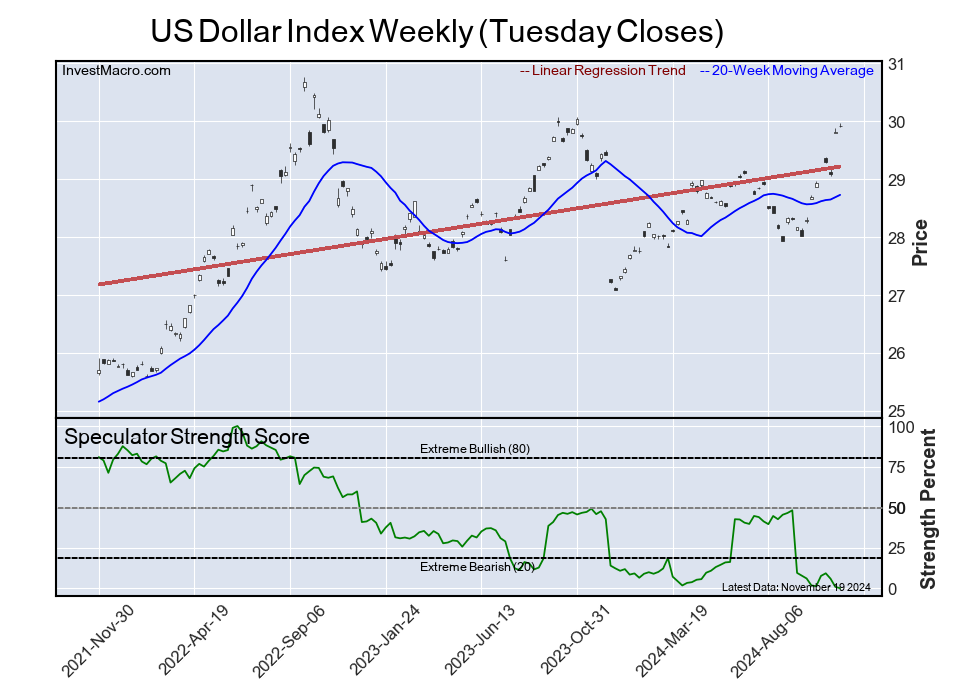
Highlighting the COT currency’s data for the week was the continued divergence in the US Dollar Index price and the US Dollar Index speculator positioning.
The large speculative US Dollar Index positions decreased for a third straight week this week and for the eighth time out of the past ten weeks. This is a total decline of -22,923 contracts over the ten-week period and has brought the USD Index positioning to a new multi-year low dating back to March 3rd of 2021.
Despite this recent sentiment deficit, the US Dollar Index (DX) price has continued to go the opposite way of the speculators – which are usually trend-following and buying price on the way up while doing the opposite on the way down.
The DX rose by almost 1 percent this week and has now gained for three weeks in a row as well as for seven increases out of the past eight weeks. The DX broke through the 106.50-107.00 resistance level this week with a high above 108.00 before settling back to close the week at approximately 107.50. This is the highest weekly close since the fourth quarter of 2022. Next up, look for overhead resistance in the 109.00-110.00 areas if the bullish trend continues.
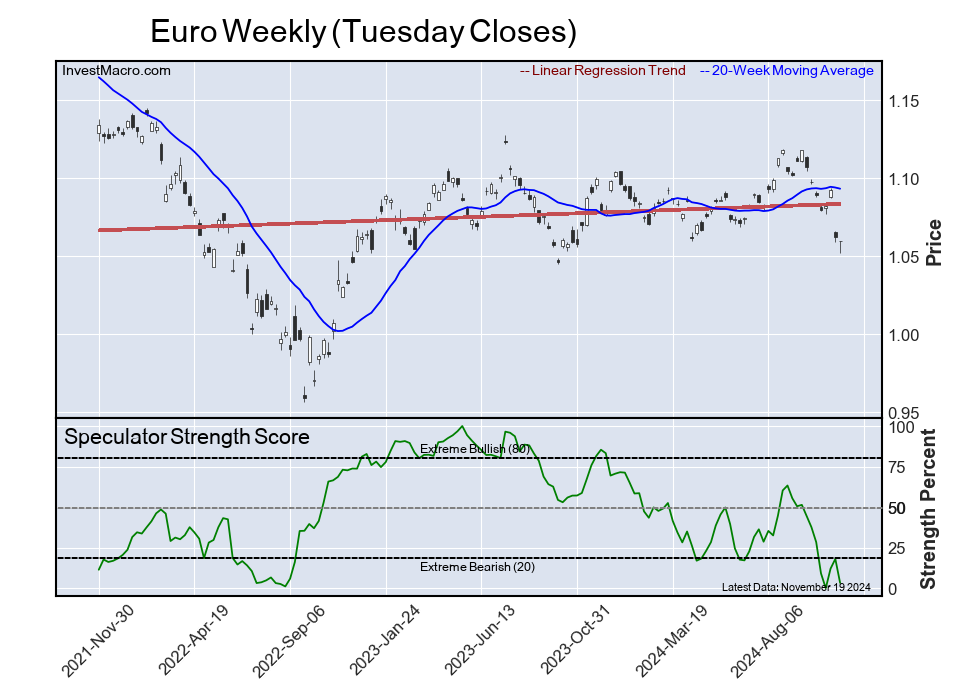
Euro bets drop sharply, exchange rate on the downswing
Euro currency bets dropped sharply by over -35,120 net contracts this week and pretty much erased the gains of the past two weeks (+14,216 contracts on Nov 12th and +28,651 contracts on Nov. 5th). Speculator positioning in the Euro has been volatile in the past few months but overall, bets have been going mostly bearish for the currency. Over the past eleven weeks, Euro net positions have in total dropped by -142,575 contracts and have taken the position from a total of +100,018 contracts on September 3rd to this week’s standing of -42,557 net contracts.
The Euro exchange rate has been taking it on the chin and has dropped by over 1 percent in each of the past three weeks. After ascending to a 2024-high in September at over 1.1200, the Euro has spiraled lower in quick work and closed this week at approximately 1.0420. This is over a 7 percent decrease in just two months. If the currency continues to slide through the 1.0400 resistance, we can look for the 1.0250 level and eventually the Euro could test parity at 1.00 to the US Dollar. The Euro last fell to parity and below in the second half of 2022 with the Euro dropping all the way to the 0.9602 level which marked the lowest level in over two decades.
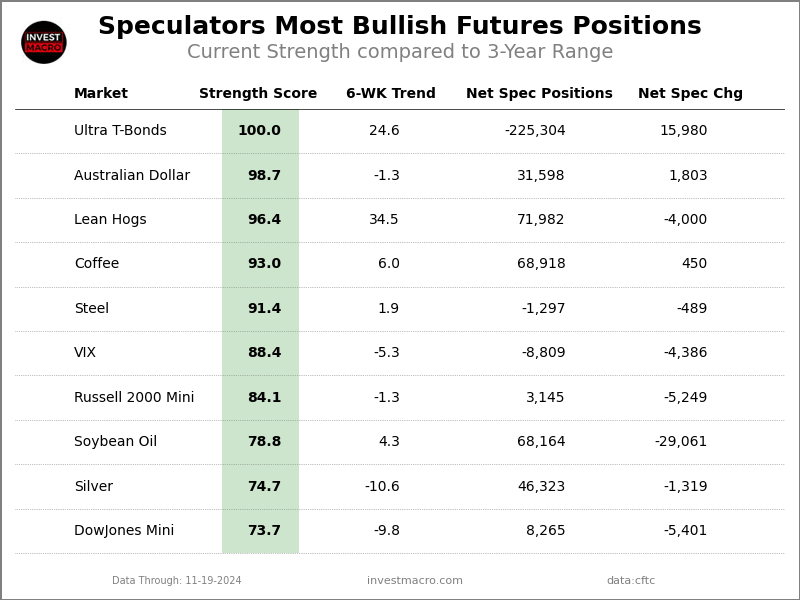
Currencies Net Speculators Leaderboard
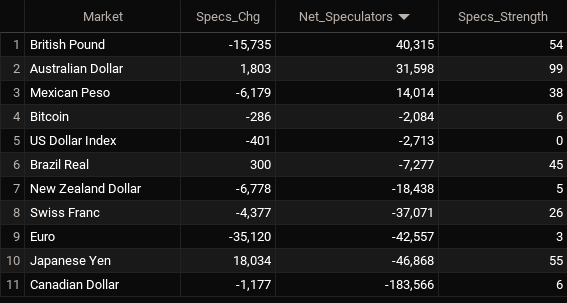
Legend: Weekly Speculators Change | Speculators Current Net Position | Speculators Strength Score compared to last 3-Years (0-100 range)
Strength Scores led by Australian Dollar
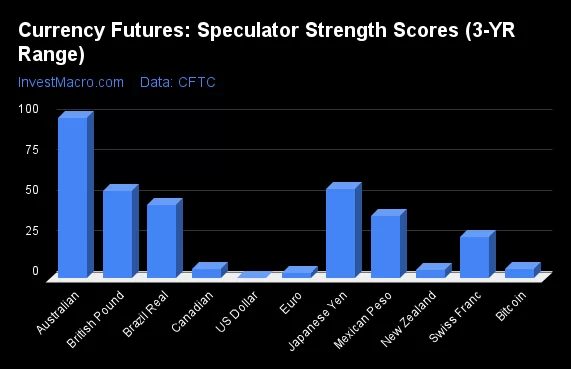
COT Strength Scores (a normalized measure of Speculator positions over a 3-Year range, from 0 to 100 where above 80 is Extreme-Bullish and below 20 is Extreme-Bearish) showed that the Australian Dollar (99 percent) leads the currency markets this week. The Japanese Yen (55 percent) and the British Pound (54 percent) come in as the next highest in the weekly strength scores.
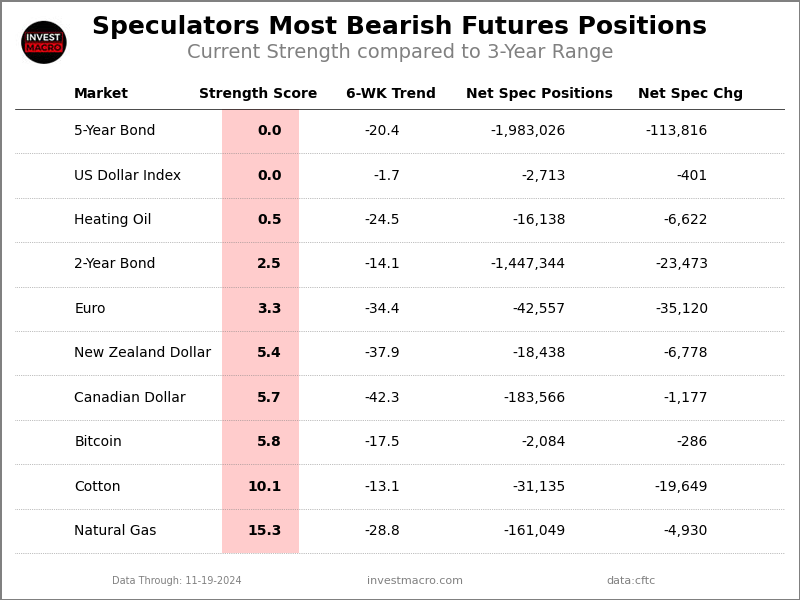
On the downside, the US Dollar Index (0 percent), the EuroFX (3 percent), the New Zealand Dollar (5 percent), the Canadian Dollar (5.7 percent) and Bitcoin (6 percent) come in at the lowest strength levels currently and are all in Extreme-Bearish territory (below 20 percent).
3-Year Strength Statistics:
US Dollar Index (0.0 percent) vs US Dollar Index previous week (0.8 percent)
EuroFX (3.3 percent) vs EuroFX previous week (18.1 percent)
British Pound Sterling (54.2 percent) vs British Pound Sterling previous week (61.3 percent)
Japanese Yen (54.9 percent) vs Japanese Yen previous week (47.7 percent)
Swiss Franc (25.8 percent) vs Swiss Franc previous week (34.6 percent)
Canadian Dollar (5.7 percent) vs Canadian Dollar previous week (6.2 percent)
Australian Dollar (98.7 percent) vs Australian Dollar previous week (97.4 percent)
New Zealand Dollar (5.4 percent) vs New Zealand Dollar previous week (18.5 percent)
Mexican Peso (38.3 percent) vs Mexican Peso previous week (41.4 percent)
Brazilian Real (45.2 percent) vs Brazilian Real previous week (44.9 percent)
Bitcoin (5.8 percent) vs Bitcoin previous week (12.1 percent)
Brazilian Real tops the 6-Week Strength Trends
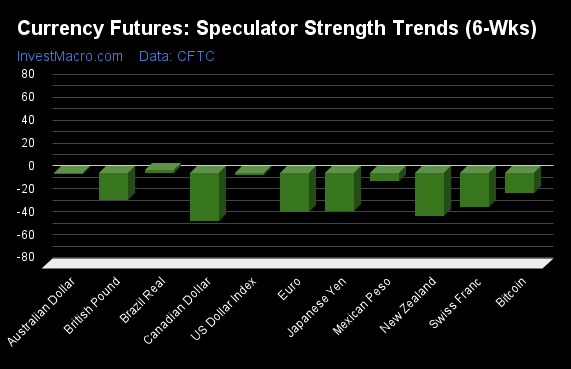
COT Strength Score Trends (or move index, calculates the 6-week changes in strength scores) showed that the Brazilian Real (3 percent) leads the past six weeks trends for the currencies and is currently the only positive mover in the 3-Year trends data.
The Canadian Dollar (-42 percent) leads the downside trend scores currently with the New Zealand Dollar (-38 percent), EuroFX (-34 percent) and the Japanese Yen (-33 percent) following next with lower trend scores.
3-Year Strength Trends:
US Dollar Index (-1.7 percent) vs US Dollar Index previous week (-5.2 percent)
EuroFX (-34.4 percent) vs EuroFX previous week (-26.4 percent)
British Pound Sterling (-23.7 percent) vs British Pound Sterling previous week (-16.9 percent)
Japanese Yen (-33.3 percent) vs Japanese Yen previous week (-48.6 percent)
Swiss Franc (-29.6 percent) vs Swiss Franc previous week (-19.9 percent)
Canadian Dollar (-42.3 percent) vs Canadian Dollar previous week (-50.4 percent)
Australian Dollar (-1.3 percent) vs Australian Dollar previous week (10.8 percent)
New Zealand Dollar (-37.9 percent) vs New Zealand Dollar previous week (-26.2 percent)
Mexican Peso (-7.4 percent) vs Mexican Peso previous week (-3.0 percent)
Brazilian Real (2.6 percent) vs Brazilian Real previous week (29.1 percent)
Bitcoin (-17.5 percent) vs Bitcoin previous week (-2.5 percent)
Individual COT Forex Markets:
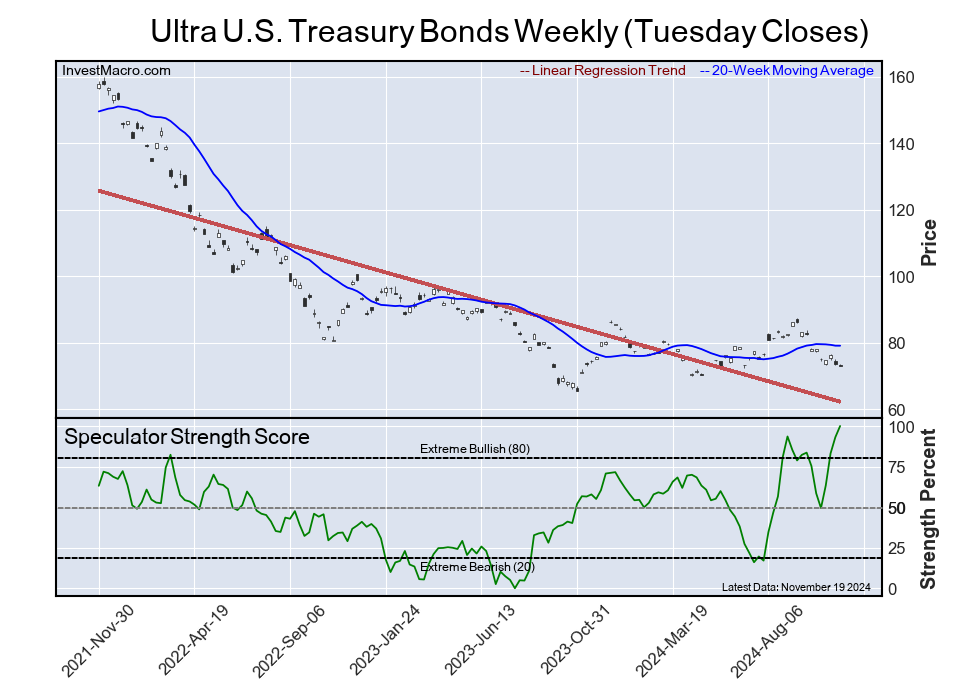
US Dollar Index Futures:
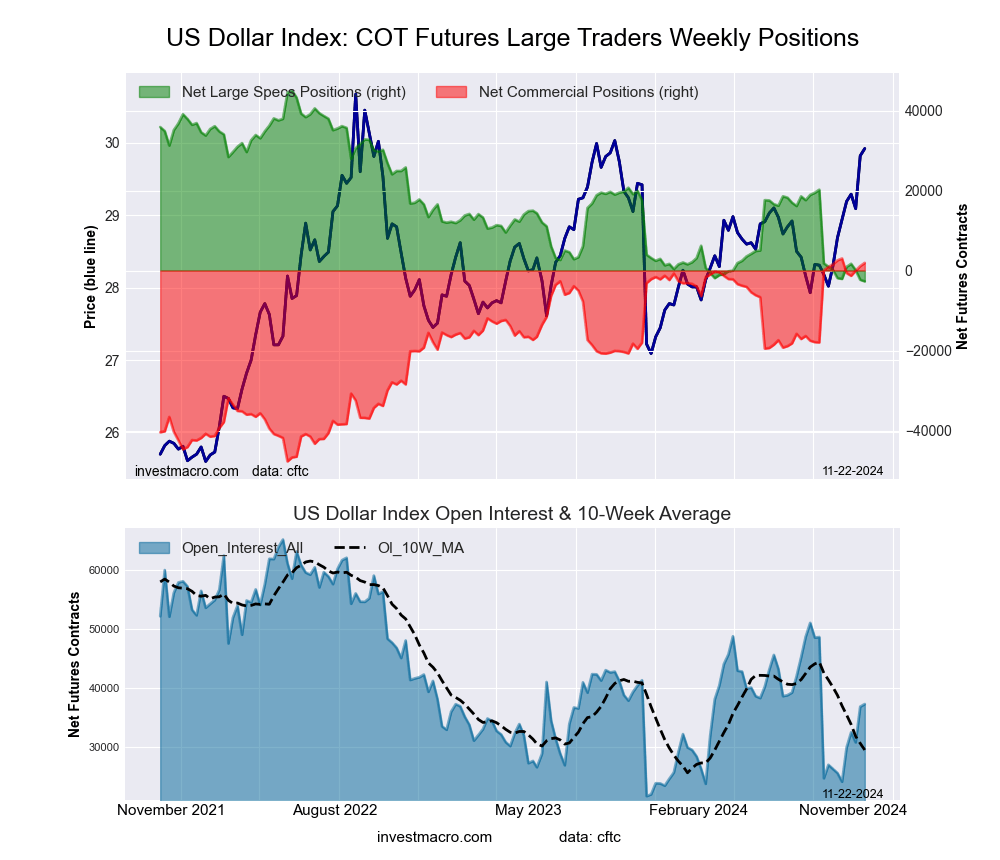 The US Dollar Index large speculator standing this week totaled a net position of -2,713 contracts in the data reported through Tuesday. This was a weekly lowering of -401 contracts from the previous week which had a total of -2,312 net contracts.
This week’s current strength score (the trader positioning range over the past three years, measured from 0 to 100) shows the speculators are currently Bearish-Extreme with a score of 0.0 percent. The commercials are Bullish-Extreme with a score of 97.9 percent and the small traders (not shown in chart) are Bearish with a score of 31.7 percent.
Price Trend-Following Model: Strong Uptrend
Our weekly trend-following model classifies the current market price position as: Strong Uptrend.
| US DOLLAR INDEX Statistics | SPECULATORS | COMMERCIALS | SMALL TRADERS |
| – Percent of Open Interest Longs: | 60.6 | 23.8 | 10.4 |
| – Percent of Open Interest Shorts: | 67.9 | 18.7 | 8.3 |
| – Net Position: | -2,713 | 1,921 | 792 |
| – Gross Longs: | 22,613 | 8,883 | 3,891 |
| – Gross Shorts: | 25,326 | 6,962 | 3,099 |
| – Long to Short Ratio: | 0.9 to 1 | 1.3 to 1 | 1.3 to 1 |
| NET POSITION TREND: | | | |
| – Strength Index Score (3 Year Range Pct): | 0.0 | 97.9 | 31.7 |
| – Strength Index Reading (3 Year Range): | Bearish-Extreme | Bullish-Extreme | Bearish |
| NET POSITION MOVEMENT INDEX: | | | |
| – 6-Week Change in Strength Index: | -1.7 | -1.2 | 15.1 |
Euro Currency Futures:
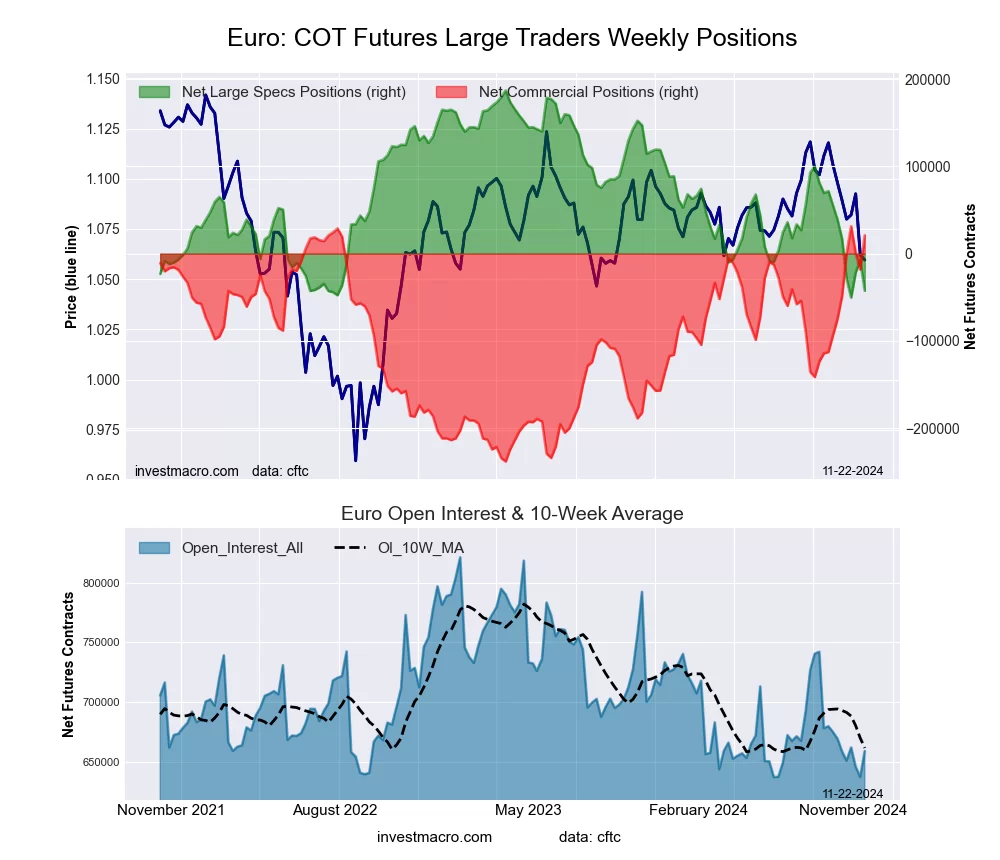 The Euro Currency large speculator standing this week totaled a net position of -42,557 contracts in the data reported through Tuesday. This was a weekly lowering of -35,120 contracts from the previous week which had a total of -7,437 net contracts.
This week’s current strength score (the trader positioning range over the past three years, measured from 0 to 100) shows the speculators are currently Bearish-Extreme with a score of 3.3 percent. The commercials are Bullish-Extreme with a score of 96.1 percent and the small traders (not shown in chart) are Bearish-Extreme with a score of 19.0 percent.
Price Trend-Following Model: Strong Downtrend
Our weekly trend-following model classifies the current market price position as: Strong Downtrend.
| EURO Currency Statistics | SPECULATORS | COMMERCIALS | SMALL TRADERS |
| – Percent of Open Interest Longs: | 23.4 | 60.6 | 11.6 |
| – Percent of Open Interest Shorts: | 29.9 | 57.4 | 8.3 |
| – Net Position: | -42,557 | 21,047 | 21,510 |
| – Gross Longs: | 154,305 | 399,002 | 76,465 |
| – Gross Shorts: | 196,862 | 377,955 | 54,955 |
| – Long to Short Ratio: | 0.8 to 1 | 1.1 to 1 | 1.4 to 1 |
| NET POSITION TREND: | | | |
| – Strength Index Score (3 Year Range Pct): | 3.3 | 96.1 | 19.0 |
| – Strength Index Reading (3 Year Range): | Bearish-Extreme | Bullish-Extreme | Bearish-Extreme |
| NET POSITION MOVEMENT INDEX: | | | |
| – 6-Week Change in Strength Index: | -34.4 | 35.6 | -32.6 |
British Pound Sterling Futures:
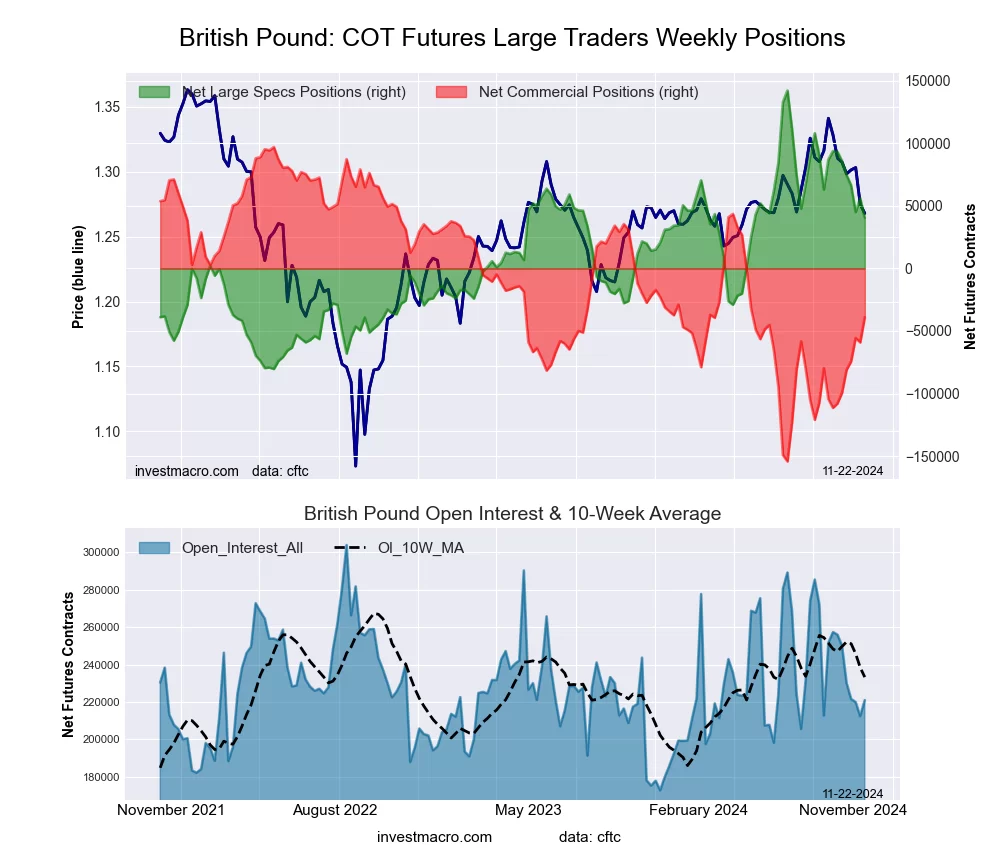 The British Pound Sterling large speculator standing this week totaled a net position of 40,315 contracts in the data reported through Tuesday. This was a weekly decrease of -15,735 contracts from the previous week which had a total of 56,050 net contracts.
This week’s current strength score (the trader positioning range over the past three years, measured from 0 to 100) shows the speculators are currently Bullish with a score of 54.2 percent. The commercials are Bearish with a score of 45.8 percent and the small traders (not shown in chart) are Bullish with a score of 59.6 percent.
Price Trend-Following Model: Strong Downtrend
Our weekly trend-following model classifies the current market price position as: Strong Downtrend.
| BRITISH POUND Statistics | SPECULATORS | COMMERCIALS | SMALL TRADERS |
| – Percent of Open Interest Longs: | 46.0 | 36.5 | 12.7 |
| – Percent of Open Interest Shorts: | 27.8 | 54.1 | 13.3 |
| – Net Position: | 40,315 | -39,066 | -1,249 |
| – Gross Longs: | 101,713 | 80,547 | 28,148 |
| – Gross Shorts: | 61,398 | 119,613 | 29,397 |
| – Long to Short Ratio: | 1.7 to 1 | 0.7 to 1 | 1.0 to 1 |
| NET POSITION TREND: | | | |
| – Strength Index Score (3 Year Range Pct): | 54.2 | 45.8 | 59.6 |
| – Strength Index Reading (3 Year Range): | Bullish | Bearish | Bullish |
| NET POSITION MOVEMENT INDEX: | | | |
| – 6-Week Change in Strength Index: | -23.7 | 27.4 | -33.9 |
Japanese Yen Futures:
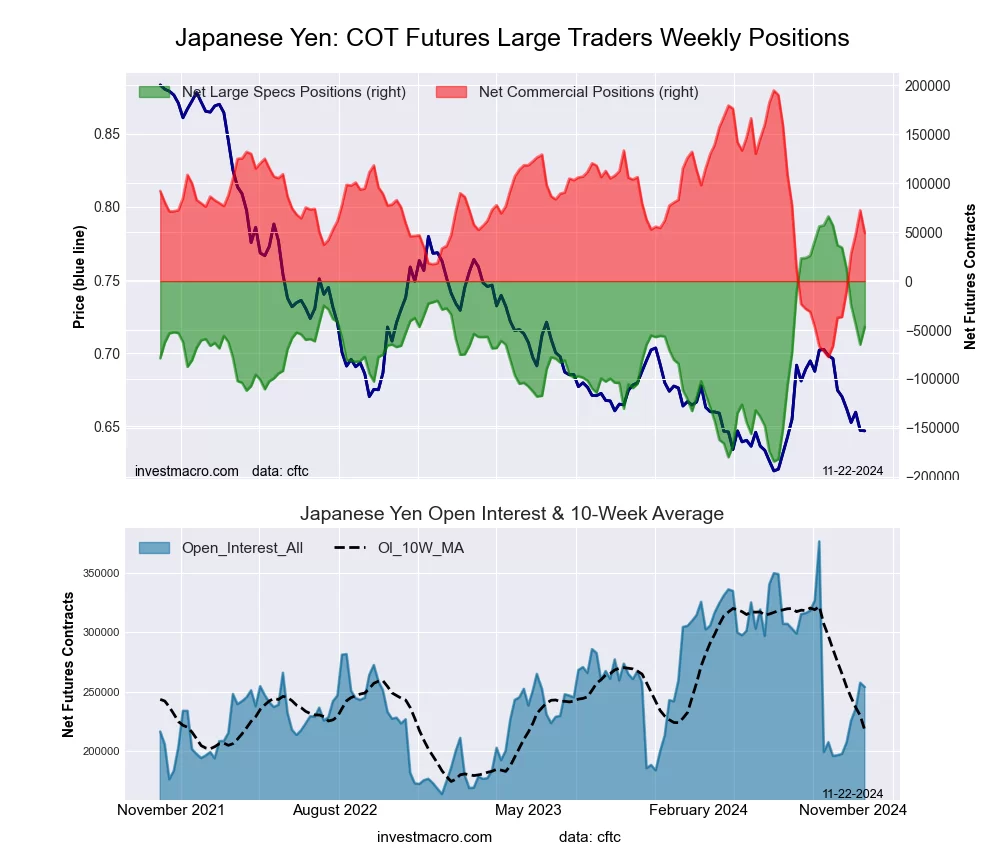 The Japanese Yen large speculator standing this week totaled a net position of -46,868 contracts in the data reported through Tuesday. This was a weekly advance of 18,034 contracts from the previous week which had a total of -64,902 net contracts.
This week’s current strength score (the trader positioning range over the past three years, measured from 0 to 100) shows the speculators are currently Bullish with a score of 54.9 percent. The commercials are Bearish with a score of 46.6 percent and the small traders (not shown in chart) are Bullish with a score of 58.0 percent.
Price Trend-Following Model: Weak Uptrend
Our weekly trend-following model classifies the current market price position as: Weak Uptrend.
| JAPANESE YEN Statistics | SPECULATORS | COMMERCIALS | SMALL TRADERS |
| – Percent of Open Interest Longs: | 31.1 | 52.8 | 14.7 |
| – Percent of Open Interest Shorts: | 49.5 | 33.4 | 15.7 |
| – Net Position: | -46,868 | 49,209 | -2,341 |
| – Gross Longs: | 78,973 | 134,065 | 37,427 |
| – Gross Shorts: | 125,841 | 84,856 | 39,768 |
| – Long to Short Ratio: | 0.6 to 1 | 1.6 to 1 | 0.9 to 1 |
| NET POSITION TREND: | | | |
| – Strength Index Score (3 Year Range Pct): | 54.9 | 46.6 | 58.0 |
| – Strength Index Reading (3 Year Range): | Bullish | Bearish | Bullish |
| NET POSITION MOVEMENT INDEX: | | | |
| – 6-Week Change in Strength Index: | -33.3 | 31.9 | -8.4 |
Swiss Franc Futures:
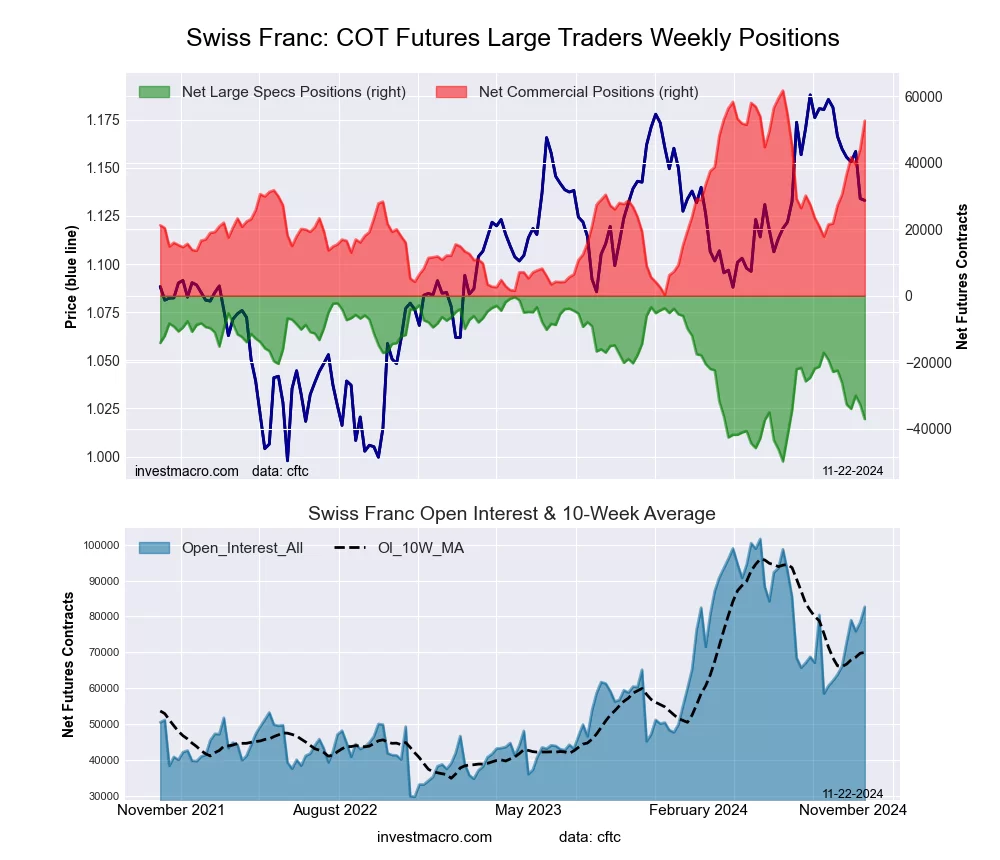 The Swiss Franc large speculator standing this week totaled a net position of -37,071 contracts in the data reported through Tuesday. This was a weekly reduction of -4,377 contracts from the previous week which had a total of -32,694 net contracts.
This week’s current strength score (the trader positioning range over the past three years, measured from 0 to 100) shows the speculators are currently Bearish with a score of 25.8 percent. The commercials are Bullish-Extreme with a score of 85.3 percent and the small traders (not shown in chart) are Bearish-Extreme with a score of 5.5 percent.
Price Trend-Following Model: Weak Uptrend
Our weekly trend-following model classifies the current market price position as: Weak Uptrend.
| SWISS FRANC Statistics | SPECULATORS | COMMERCIALS | SMALL TRADERS |
| – Percent of Open Interest Longs: | 4.9 | 84.0 | 10.9 |
| – Percent of Open Interest Shorts: | 49.7 | 20.4 | 29.7 |
| – Net Position: | -37,071 | 52,622 | -15,551 |
| – Gross Longs: | 4,036 | 69,499 | 9,009 |
| – Gross Shorts: | 41,107 | 16,877 | 24,560 |
| – Long to Short Ratio: | 0.1 to 1 | 4.1 to 1 | 0.4 to 1 |
| NET POSITION TREND: | | | |
| – Strength Index Score (3 Year Range Pct): | 25.8 | 85.3 | 5.5 |
| – Strength Index Reading (3 Year Range): | Bearish | Bullish-Extreme | Bearish-Extreme |
| NET POSITION MOVEMENT INDEX: | | | |
| – 6-Week Change in Strength Index: | -29.6 | 41.5 | -49.9 |
Canadian Dollar Futures:
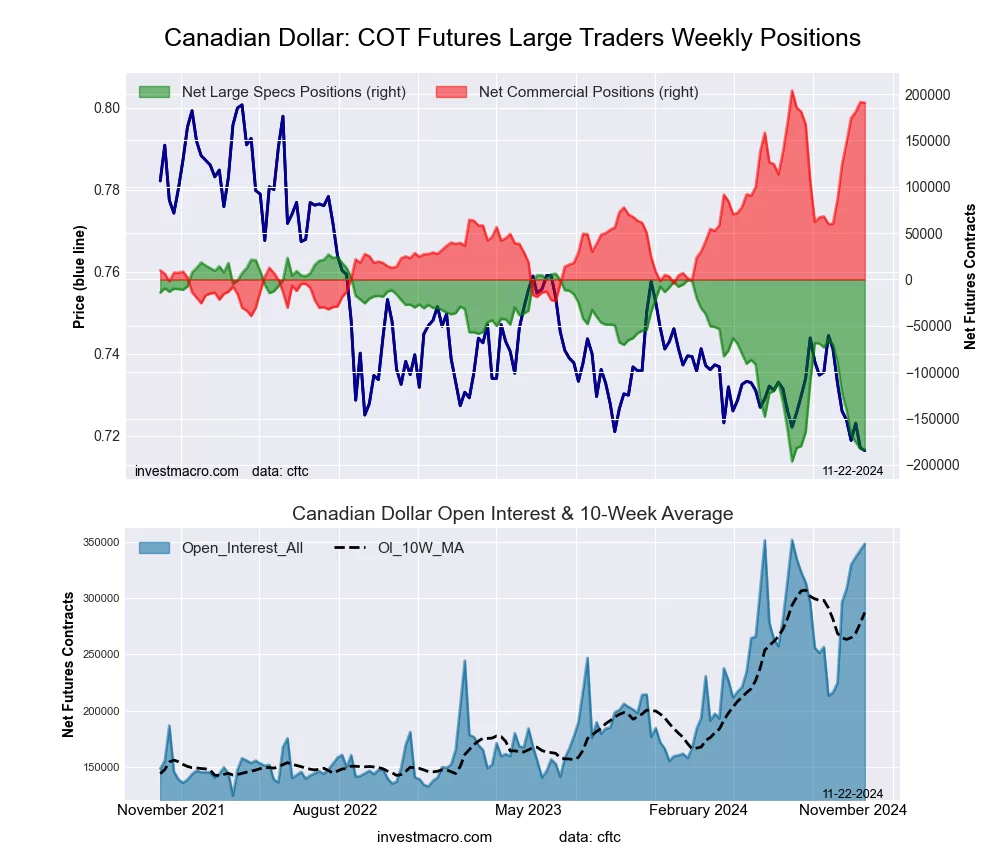 The Canadian Dollar large speculator standing this week totaled a net position of -183,566 contracts in the data reported through Tuesday. This was a weekly decrease of -1,177 contracts from the previous week which had a total of -182,389 net contracts.
This week’s current strength score (the trader positioning range over the past three years, measured from 0 to 100) shows the speculators are currently Bearish-Extreme with a score of 5.7 percent. The commercials are Bullish-Extreme with a score of 94.6 percent and the small traders (not shown in chart) are Bearish-Extreme with a score of 9.8 percent.
Price Trend-Following Model: Strong Downtrend
Our weekly trend-following model classifies the current market price position as: Strong Downtrend.
| CANADIAN DOLLAR Statistics | SPECULATORS | COMMERCIALS | SMALL TRADERS |
| – Percent of Open Interest Longs: | 6.9 | 82.0 | 8.6 |
| – Percent of Open Interest Shorts: | 59.6 | 27.3 | 10.7 |
| – Net Position: | -183,566 | 190,676 | -7,110 |
| – Gross Longs: | 23,904 | 285,755 | 30,046 |
| – Gross Shorts: | 207,470 | 95,079 | 37,156 |
| – Long to Short Ratio: | 0.1 to 1 | 3.0 to 1 | 0.8 to 1 |
| NET POSITION TREND: | | | |
| – Strength Index Score (3 Year Range Pct): | 5.7 | 94.6 | 9.8 |
| – Strength Index Reading (3 Year Range): | Bearish-Extreme | Bullish-Extreme | Bearish-Extreme |
| NET POSITION MOVEMENT INDEX: | | | |
| – 6-Week Change in Strength Index: | -42.3 | 43.0 | -29.6 |
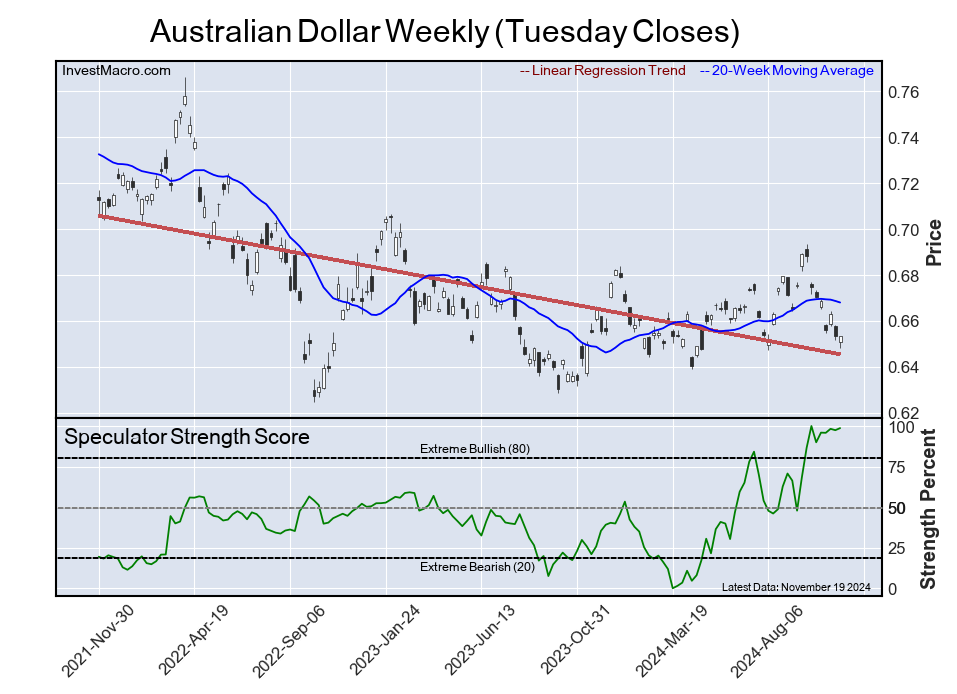
Australian Dollar Futures:
 The Australian Dollar large speculator standing this week totaled a net position of 31,598 contracts in the data reported through Tuesday. This was a weekly gain of 1,803 contracts from the previous week which had a total of 29,795 net contracts.
This week’s current strength score (the trader positioning range over the past three years, measured from 0 to 100) shows the speculators are currently Bullish-Extreme with a score of 98.7 percent. The commercials are Bearish-Extreme with a score of 13.8 percent and the small traders (not shown in chart) are Bearish with a score of 38.7 percent.
Price Trend-Following Model: Strong Downtrend
Our weekly trend-following model classifies the current market price position as: Strong Downtrend.
| AUSTRALIAN DOLLAR Statistics | SPECULATORS | COMMERCIALS | SMALL TRADERS |
| – Percent of Open Interest Longs: | 47.7 | 35.8 | 13.3 |
| – Percent of Open Interest Shorts: | 30.3 | 50.7 | 15.8 |
| – Net Position: | 31,598 | -27,106 | -4,492 |
| – Gross Longs: | 86,703 | 64,987 | 24,189 |
| – Gross Shorts: | 55,105 | 92,093 | 28,681 |
| – Long to Short Ratio: | 1.6 to 1 | 0.7 to 1 | 0.8 to 1 |
| NET POSITION TREND: | | | |
| – Strength Index Score (3 Year Range Pct): | 98.7 | 13.8 | 38.7 |
| – Strength Index Reading (3 Year Range): | Bullish-Extreme | Bearish-Extreme | Bearish |
| NET POSITION MOVEMENT INDEX: | | | |
| – 6-Week Change in Strength Index: | -1.3 | 13.8 | -54.9 |
New Zealand Dollar Futures:
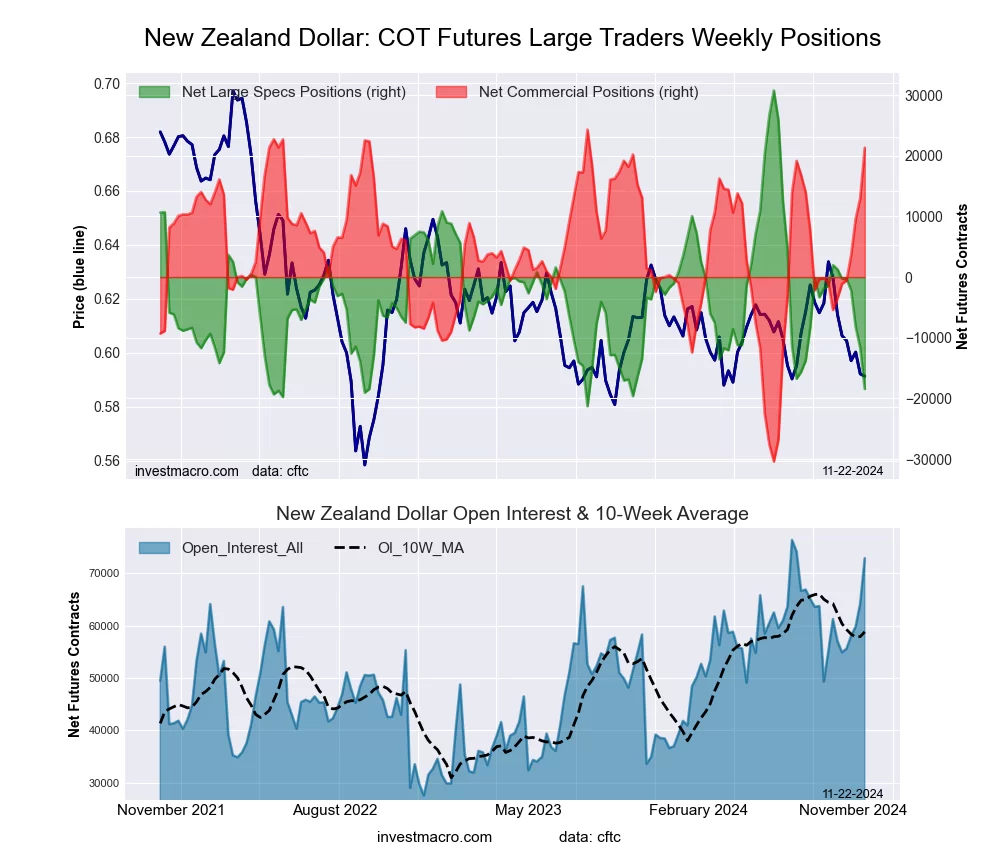 The New Zealand Dollar large speculator standing this week totaled a net position of -18,438 contracts in the data reported through Tuesday. This was a weekly fall of -6,778 contracts from the previous week which had a total of -11,660 net contracts.
This week’s current strength score (the trader positioning range over the past three years, measured from 0 to 100) shows the speculators are currently Bearish-Extreme with a score of 5.4 percent. The commercials are Bullish-Extreme with a score of 94.6 percent and the small traders (not shown in chart) are Bearish-Extreme with a score of 16.7 percent.
Price Trend-Following Model: Strong Downtrend
Our weekly trend-following model classifies the current market price position as: Strong Downtrend.
| NEW ZEALAND DOLLAR Statistics | SPECULATORS | COMMERCIALS | SMALL TRADERS |
| – Percent of Open Interest Longs: | 29.9 | 64.6 | 4.6 |
| – Percent of Open Interest Shorts: | 55.2 | 35.4 | 8.5 |
| – Net Position: | -18,438 | 21,323 | -2,885 |
| – Gross Longs: | 21,762 | 47,092 | 3,323 |
| – Gross Shorts: | 40,200 | 25,769 | 6,208 |
| – Long to Short Ratio: | 0.5 to 1 | 1.8 to 1 | 0.5 to 1 |
| NET POSITION TREND: | | | |
| – Strength Index Score (3 Year Range Pct): | 5.4 | 94.6 | 16.7 |
| – Strength Index Reading (3 Year Range): | Bearish-Extreme | Bullish-Extreme | Bearish-Extreme |
| NET POSITION MOVEMENT INDEX: | | | |
| – 6-Week Change in Strength Index: | -37.9 | 45.4 | -64.9 |
Mexican Peso Futures:
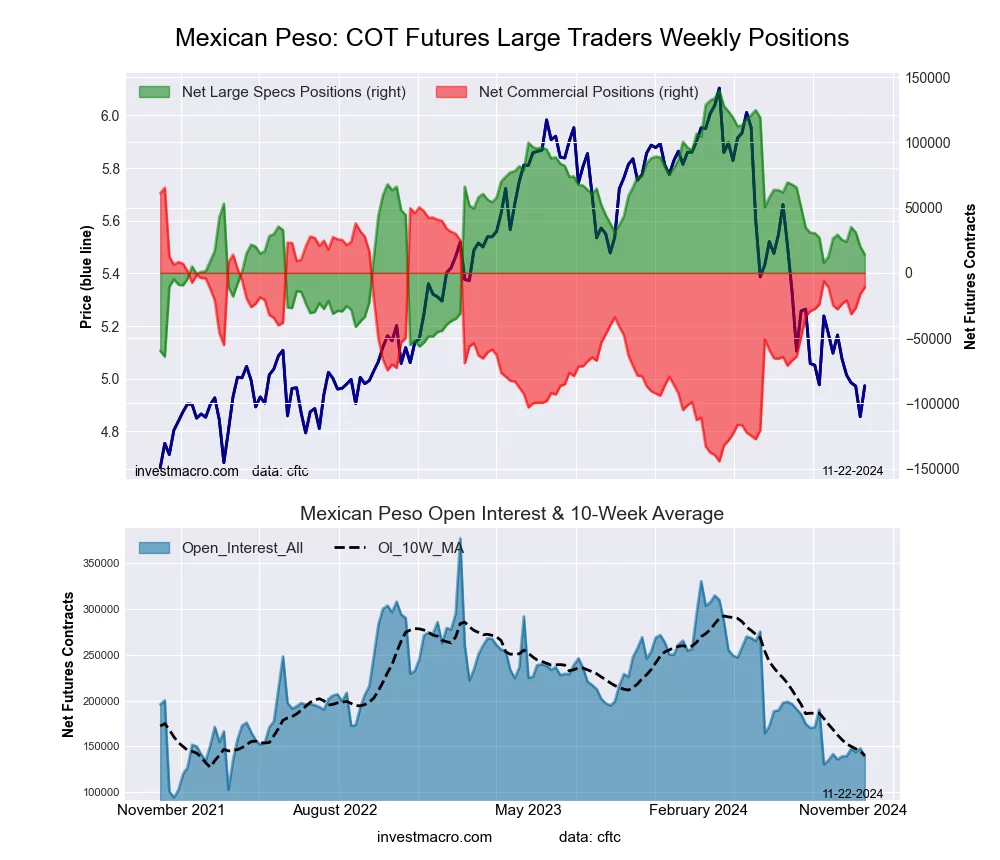 The Mexican Peso large speculator standing this week totaled a net position of 14,014 contracts in the data reported through Tuesday. This was a weekly fall of -6,179 contracts from the previous week which had a total of 20,193 net contracts.
This week’s current strength score (the trader positioning range over the past three years, measured from 0 to 100) shows the speculators are currently Bearish with a score of 38.3 percent. The commercials are Bullish with a score of 63.6 percent and the small traders (not shown in chart) are Bearish-Extreme with a score of 6.0 percent.
Price Trend-Following Model: Downtrend
Our weekly trend-following model classifies the current market price position as: Downtrend.
| MEXICAN PESO Statistics | SPECULATORS | COMMERCIALS | SMALL TRADERS |
| – Percent of Open Interest Longs: | 43.5 | 50.0 | 2.5 |
| – Percent of Open Interest Shorts: | 33.5 | 57.9 | 4.7 |
| – Net Position: | 14,014 | -11,007 | -3,007 |
| – Gross Longs: | 60,642 | 69,581 | 3,539 |
| – Gross Shorts: | 46,628 | 80,588 | 6,546 |
| – Long to Short Ratio: | 1.3 to 1 | 0.9 to 1 | 0.5 to 1 |
| NET POSITION TREND: | | | |
| – Strength Index Score (3 Year Range Pct): | 38.3 | 63.6 | 6.0 |
| – Strength Index Reading (3 Year Range): | Bearish | Bullish | Bearish-Extreme |
| NET POSITION MOVEMENT INDEX: | | | |
| – 6-Week Change in Strength Index: | -7.4 | 8.1 | -9.5 |
Brazilian Real Futures:
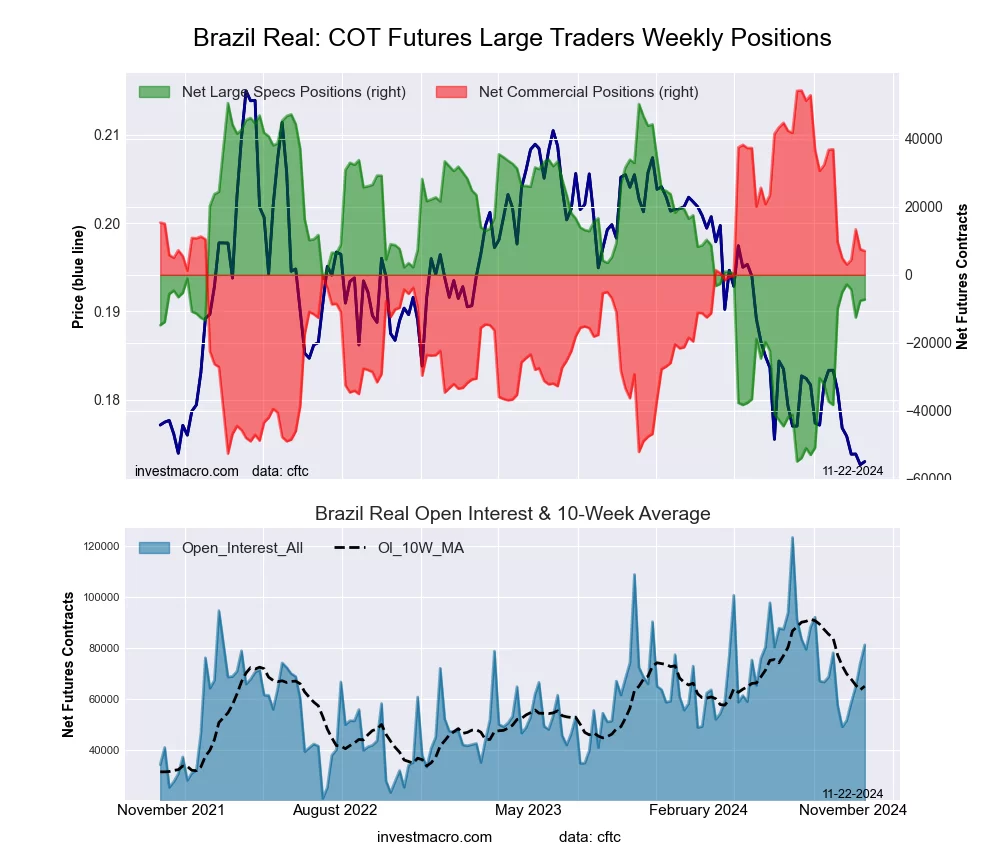 The Brazilian Real large speculator standing this week totaled a net position of -7,277 contracts in the data reported through Tuesday. This was a weekly advance of 300 contracts from the previous week which had a total of -7,577 net contracts.
This week’s current strength score (the trader positioning range over the past three years, measured from 0 to 100) shows the speculators are currently Bearish with a score of 45.2 percent. The commercials are Bullish with a score of 55.8 percent and the small traders (not shown in chart) are Bearish with a score of 22.4 percent.
Price Trend-Following Model: Strong Downtrend
Our weekly trend-following model classifies the current market price position as: Strong Downtrend.
| BRAZIL REAL Statistics | SPECULATORS | COMMERCIALS | SMALL TRADERS |
| – Percent of Open Interest Longs: | 54.0 | 32.7 | 3.3 |
| – Percent of Open Interest Shorts: | 63.0 | 24.1 | 3.0 |
| – Net Position: | -7,277 | 7,003 | 274 |
| – Gross Longs: | 43,898 | 26,555 | 2,703 |
| – Gross Shorts: | 51,175 | 19,552 | 2,429 |
| – Long to Short Ratio: | 0.9 to 1 | 1.4 to 1 | 1.1 to 1 |
| NET POSITION TREND: | | | |
| – Strength Index Score (3 Year Range Pct): | 45.2 | 55.8 | 22.4 |
| – Strength Index Reading (3 Year Range): | Bearish | Bullish | Bearish |
| NET POSITION MOVEMENT INDEX: | | | |
| – 6-Week Change in Strength Index: | 2.6 | -2.5 | -0.4 |
Bitcoin Futures:
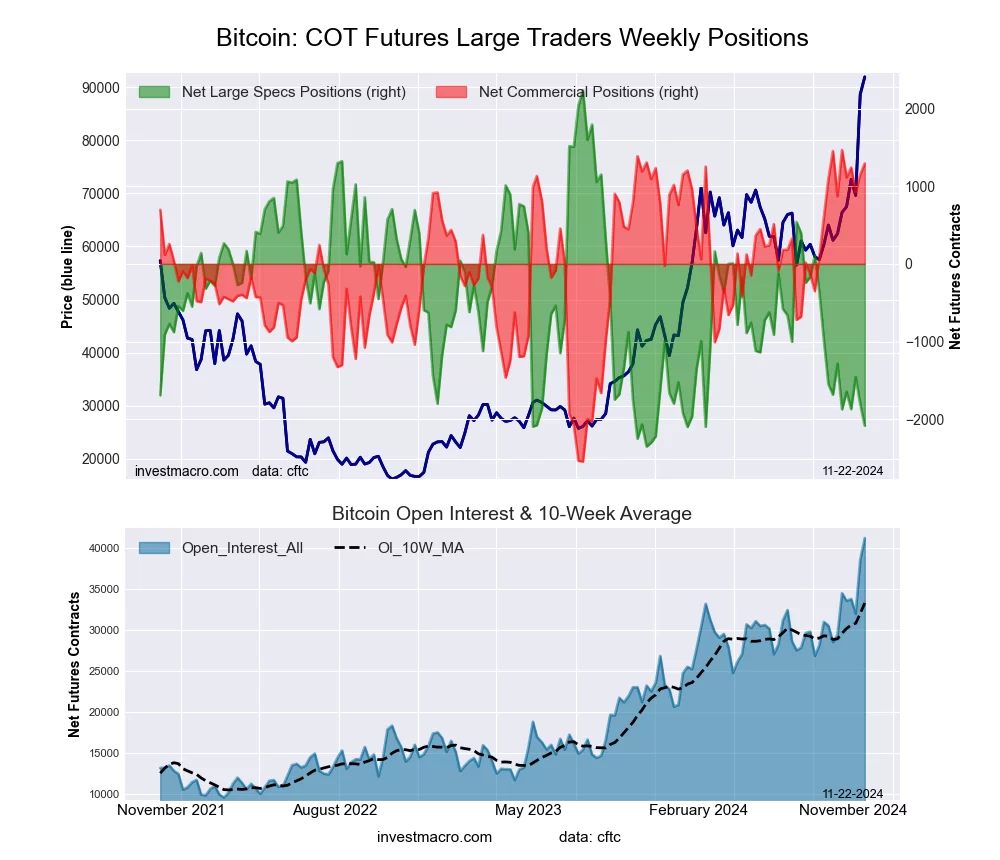 The Bitcoin large speculator standing this week totaled a net position of -2,084 contracts in the data reported through Tuesday. This was a weekly decrease of -286 contracts from the previous week which had a total of -1,798 net contracts.
This week’s current strength score (the trader positioning range over the past three years, measured from 0 to 100) shows the speculators are currently Bearish-Extreme with a score of 5.8 percent. The commercials are Bullish-Extreme with a score of 95.7 percent and the small traders (not shown in chart) are Bullish with a score of 68.8 percent.
Price Trend-Following Model: Strong Uptrend
Our weekly trend-following model classifies the current market price position as: Strong Uptrend.
| BITCOIN Statistics | SPECULATORS | COMMERCIALS | SMALL TRADERS |
| – Percent of Open Interest Longs: | 75.6 | 4.7 | 4.4 |
| – Percent of Open Interest Shorts: | 80.7 | 1.5 | 2.5 |
| – Net Position: | -2,084 | 1,294 | 790 |
| – Gross Longs: | 31,152 | 1,917 | 1,833 |
| – Gross Shorts: | 33,236 | 623 | 1,043 |
| – Long to Short Ratio: | 0.9 to 1 | 3.1 to 1 | 1.8 to 1 |
| NET POSITION TREND: | | | |
| – Strength Index Score (3 Year Range Pct): | 5.8 | 95.7 | 68.8 |
| – Strength Index Reading (3 Year Range): | Bearish-Extreme | Bullish-Extreme | Bullish |
| NET POSITION MOVEMENT INDEX: | | | |
| – 6-Week Change in Strength Index: | -17.5 | 10.5 | 28.2 |
Article By InvestMacro – Receive our weekly COT Newsletter
*COT Report: The COT data, released weekly to the public each Friday, is updated through the most recent Tuesday (data is 3 days old) and shows a quick view of how large speculators or non-commercials (for-profit traders) were positioned in the futures markets.
The CFTC categorizes trader positions according to commercial hedgers (traders who use futures contracts for hedging as part of the business), non-commercials (large traders who speculate to realize trading profits) and nonreportable traders (usually small traders/speculators) as well as their open interest (contracts open in the market at time of reporting). See CFTC criteria here.

 WISE, NEOWISE’s predecessor mission, imaged the entire sky in the mid-infrared range.


 Nuclear-powered rockets could one day enable faster space travel.