Archive for Opinions – Page 10

Coffee crops are dying from a fungus with species-jumping genes – researchers are ‘resurrecting’ their genomes to understand how and why

By Lily Peck, University of California, Los Angeles 

For anyone who relies on coffee to start their day, coffee wilt disease may be the most important disease you’ve never heard of. This fungal disease has repeatedly reshaped the global coffee supply over the past century, with consequences that reach from African farms to cafe counters worldwide.

Infection with the fungus Fusarium xylarioides results in a characteristic “wilt” in coffee plants by blocking and reducing the plant’s ability to transport water. This blockage eventually kills the plant.

Some of the most destructive plant pathogens in the world infect their hosts in this way. Since the 1990s, outbreaks of coffee wilt have cost over US$1 billion, forced countless farms to close and caused dramatic drops in national coffee production. In Uganda, one of Africa’s largest producers, coffee production did not recover to pre-outbreak levels until 2020, decades after coffee wilt was first detected there. And in 2023, researchers found evidence that coffee wilt disease had resurfaced across all coffee-producing regions of Ivory Coast.

Studying the genetics of plant pathogens is crucial to understanding why this disease continues to return and how to prevent another major outbreak.

Rise and fall of coffee wilt disease in Africa

While early outbreaks of coffee wilt disease affected a wide range of coffee types, later epidemics primarily affected the two coffee species dominating global markets today: arabica and robusta.

First identified in 1927, coffee wilt disease decimated several varieties of coffee grown in western and central Africa. Although farmers combated the fungus with a shift to supposedly resistant robusta crops in the 1950s, the reprieve was short-lived.

The disease reemerged in the 1970s on robusta coffee, spreading through eastern and central Africa. By the mid-1990s, yields had collapsed and coffee production could not recover in countries like the Democratic Republic of Congo.

Separately, researchers identified the disease on arabica coffee in Ethiopia in the 1950s and watched it become widespread by the 1970s

Two side-by-side maps of Africa with several regions highlighted to indicate coffee wilt disease outbreaks
Coffee wilt disease has spread widely in Africa. The first outbreak before the 1950s affected mainly central and western Africa (left map) while the second outbreak originated in central Africa and spread east (right map). Affected countries are colored by the decade the disease was first detected.
Peck et al 2023/Plant Pathology, CC BY-SA

Although coffee wilt disease is currently endemic at low and manageable levels across eastern and central Africa, any future resurgence of the disease could be catastrophic for African coffee production. Coffee wilt also poses a threat to producers in Asia and the Americas.

New types of disease emerge

Coffee wilt disease evolved alongside coffee itself. Over the past century, it has repeatedly reemerged, attacking different types of coffee each time. But did these shifts reflect the rapid evolution of new types of disease, or something else entirely?

Fungal disease has devastated plants for millennia, with the earliest records of outbreaks dating from the biblical plagues. Like humans, plants have an immune system that protects them against attacks from pathogens like fungi.

While most fungal attempts at infection fail, a small number do succeed thanks to the constant evolutionary pressure on pathogens to overcome host plant defenses. In this evolutionary arms race, pathogens and hosts continuously adapt to each other by genetically changing their DNA. Boom and bust cycles of disease occur as one gains advantage over the other.

The rise of modern agriculture has led to widespread monocultures of genetically uniform crops. While monocultures have significantly boosted food production, they have also contributed to environmental degradation and increased plant vulnerability to disease.

Crop breeders have attempted to protect monocultures by introducing disease resistance genes, with farms widely applying fungicides and other environmentally damaging products. But these relatively weak protections for hundreds of acres of identical plants have resulted in outbreaks decimating crops that people depend on.

It’s likely that modern agriculture’s reliance on monocultures has enabled and accelerated the evolution of new types of pathogen capable of overcoming resistance in plants. As a result, crops become more susceptible to disease outbreaks.

Resurrecting fungal strains

Understanding the lessons of the past is essential to avoiding future plant pandemics. But this can be challenging, because the specific pathogen strains that caused previous disease outbreaks may no longer exist in nature or may have changed substantially.

In my research on the evolutionary arms race between host and pathogen in coffee wilt disease, I sought to address these problems by “resurrecting” historical strains of the fungus that causes the disease, Fusarium xylarioides. Researchers know little about why the earlier and later outbreaks targeted different types of coffee, so I explored the genetic changes in F. xylarioides that underlie this narrowing of its hosts.

I reconstructed historical genetic changes in the major coffee wilt disease outbreaks over the past seven decades by using strains from a fungus library – culture collections that preserve living fungi. These libraries store long-term living data and reflect the fungal genetic diversity present at the time of collection.

Microscopy image of blue fuzzy sphere with long extensions
Gibberella (Fusarium) xylarioides, with arrow pointing to its spore-containing sac.
Julie Flood

Whether a pathogen takes the upper hand in the evolutionary arms race depends on its ability to generate new types of genes. It can do so either by changing and rearranging its DNA sequence or by moving DNA sequences between organisms in a process called horizontal gene transfer. These mechanisms can create new effector genes that enable pathogens to infect and colonize a host plant.

Initially, I sequenced six whole genomes of strains involved in outbreaks before the 1970s as well as later outbreaks that specifically targeted arabica or robusta coffee plants. I found that strains of F. xylarioides specific to arabica or robusta genetically differed from each other, with most of these differences inherited from parent to offspring. This process is called vertical inheritance.

Genes that jump between species

However, I also found that several regions of the F. xylarioides genome were potentially acquired horizontally from F. oxysporum, a global plant pathogen that infects over 120 crops, including bananas and tomatoes. These included different regions of the genome across strains specific to arabica and robusta coffee.

But did these changes introduce new effector genes in the F. xylarioides strains that infect arabica and robusta coffee plants specifically? To answer this question, I first sequenced and assembled the first F. xylarioides reference genome, stitching together long stretches of DNA. I then sequenced and compared this reference genome to the whole genomes of three more pre-1970s F. xylarioides strains and 10 additional historical Fusarium strains found on or around diseased coffee bushes, as well as F. xylarioides strains from infected arabica coffee seedlings.

I found substantial evidence for horizontal transfer of disease-causing genes between species of Fusarium. This includes the presence of giant genetic components called Starships in Fusarium. These so-called jumping genes carry their own molecular machinery, allowing them to move around or between genomes. Genes involved in adaptation, such as those linked to virulence, metabolism or host interaction, also move with them. Scientists think Starships may potentially enable fungi to adapt to changing environmental conditions.

I found that large and highly similar genetic regions, including Starships and active effector genes involved in disease, had moved from F. oxysporum to F. xylarioides. Importantly, different genetic regions were present across strains of F. xylarioides specific to arabica and robusta, but they were absent from other related Fusarium species. This suggests that these genes were gained from F. oxysporum.

Arming farmers with knowledge

Today, a third of all global crop yields are lost to pest and disease. Reconciling the tension between agricultural productivity and environmental protection is important to balance humanity’s needs for the future. Central to this challenge is reducing the spread of disease and new outbreaks.

On the flip side to monocultures, many plant species surrounding and within small and family-run coffee farms in sub-Saharan Africa may act as disease reservoirs, where fungi pathogens can lurk. These include banana trees and Solanum weeds in the tomato family that are susceptible to fungal infection.

Human farming practices may have inadvertently created an artificial niche for these fungi, with coffee bushes brought into widespread contact with banana plants and Solanum weeds. If fungi in the same genus can frequently exchange genetic material, it could accelerate the ability of plant pathogens to adapt to new hosts.

Testing noncoffee plants for F. xylarioides infection could reveal alternative plant species where different Fusarium fungi come into contact and exchange genetic material. This matters because across sub-Saharan Africa, coffee plants often share fields with banana trees and weeds. If these neighboring plants can harbor fungi that act as new sources of genetic variation, they may help fuel new disease strains.

Identifying the plants that can act as hosts to fungi could give farmers practical options to reduce coffee plants’ risk of disease, from targeted weed management to avoiding the planting of vulnerable crops side by side.The Conversation

About the Author:

Lily Peck, Postdoctoral Scholar in Evolutionary Biology, University of California, Los Angeles

This article is republished from The Conversation under a Creative Commons license. Read the original article.

Supreme Court rules against Trump’s emergency tariffs – but leaves key questions unanswered

By Kent Jones, Babson College 

President Donald Trump’s economic agenda took a major hit when the Supreme Court struck down many of his most sweeping tariffs. While Trump has options to restore some of the tariffs, he’s losing his most powerful tool to impose them almost at will as a bargaining chip with other countries.

In a 6-3 decision on Feb. 20, 2026, the court ruled that Trump’s use of the International Emergency Economic Powers Act of 1977 to unilaterally impose tariffs on other countries was unconstitutional. Since January 2025, Trump has used the act to impose tariffs on nearly every other country.

As a trade economist, I wasn’t particularly surprised by the ruling. In the oral arguments, several justices were openly skeptical about the president’s ability to claim virtually unlimited powers to set tariffs without specific congressional language to authorize them. While the ruling answers some questions about the legality of Trump’s tariffs, it leaves many others unanswered.

What are the tariffs the court ruled against?

The tariffs that the court ruled are illegal include the “reciprocal” tariffs Trump imposed to match the value of trade barriers set by other countries. They ranged from 34% on China to a baseline of 10% for the rest of the world.

They also include a 25% tariff on some goods from Canada, China and Mexico over those countries’ supposed failure to curb the flow of fentanyl into the U.S.

By striking down these tariffs, the Supreme Court will presumably force U.S. tariff schedules to revert to the status quo before they were imposed on April 2, 2025, or “liberation day,” as Trump called it.

Why did the Supreme Court rule against the tariffs?

Most of the tariffs Trump has imposed used the International Emergency Economic Powers Act to provide legal justification. While the law allows the president to respond to economic emergencies with measures such as embargoes and asset seizures, it does not specifically authorize the use of tariffs imposed unilaterally.

This was a major point made in the Supreme Court decision. In every other statute available to the president to use tariffs, there is specific language stating the way in which tariffs can be imposed, language that is absent in the International Emergency Economic Powers Act statute.

The majority decision, in which the court’s liberal justices were joined by three of its conservatives, determined that the president overreached his powers to set tariffs, based on Article 1, Section 8, of the U.S Constitution. Any delegation of tariff-making powers in an emergency to the president must be consistent with this provision.

It is also noteworthy that Trump openly declared that one of the benefits of the tariffs was how much revenue they bring in. But the majority decision noted that this represented an unauthorized presidential power to tax, which is also governed by the Article 1, Section 8, provision that assigns this power exclusively to Congress.

What does this mean for Trump’s trade policy?

Trump used the International Emergency Economic Powers Act tariffs as leverage to negotiate numerous bilateral deals with U.S. trading partners. Now that the tariffs have been declared unconstitutional, many countries may demand that the deals be renegotiated.

The decision does not cover all of the administration’s tariffs, including national security tariffs imposed under Section 232 for specific industries such as autos, steel and aluminum, and Section 301, a statute that allows the president to impose tariffs against individual countries if they have imposed unfair or discriminatory trade actions against the U.S. This covers some of the tariffs on imports from China.

What other options does Trump have to achieve similar results?

Trump has often used or threatened to use International Emergency Economic Powers Act tariffs for political reasons, including against Brazil over its prosecution of a former president, Mexico over immigration and Canada over its plans to sign a trade deal with China, and other reasons.

The Supreme Court decision will make it more difficult for Trump to use tariffs and tariff threats in that way. One outcome is that constitutional limits the justices set on presidential tariff-making powers should constrain the justification of tariffs for political reasons.

The main avenues for new tariffs in response to the Supreme Court decision are sections 232 and 301. The president could potentially try to get Congress to pass new legislation expanding his tariff powers, but that seems unlikely in an election year.

However, it is important to understand that he chose to use the International Emergency Economic Powers Act as the mainspring of his trade policy because he interpreted it as providing him with full discretion in the unlimited power to impose tariffs without further congressional constraints.

In order to impose similar tariffs under Section 232, for example, each tariff order must be focused on a single industry, and the Commerce Department must issue a report documenting the emergency as it applies to that industry. Presumably, Trump will be preparing to use Section 232 for a large numbers of industries in addition to those currently covered by that statute.

For at least some of the countries with which Trump has already negotiated bilateral trade deals, many of their exports would not be covered by Section 232 tariffs, hence the likelihood that those countries will demand a renegotiation.

Will US companies get refunds for the tariffs they’ve already paid?

The Supreme Court decision appears not to address the question of tariff rebates, but many companies have already indicated that they will demand them.

In principle, any U.S. company in possession of tariff receipts documenting their payment of tariffs would be eligible for a refund if the Supreme Court approves this remedy.

What are the political consequences of this decision?

Since public opinion about Trump’s tariffs is already negative, the president will have to deal with a likely backlash against any attempts to replace the rejected tariffs with new ones.

It will be interesting to see how Republicans in Congress react to Trump’s tariff strategy in view of the upcoming midterm elections. For example, Republicans from states that border Canada may push back against further efforts to curb trade with their northern neighbor.

This may impose a further constraint on Trump’s tariff policy.The Conversation

About the Author:

Kent Jones, Professor Emeritus, Economics, Babson College

This article is republished from The Conversation under a Creative Commons license. Read the original article.

Supreme Court delivers Trump a heavy tariff blow

By ForexTime 

  • Supreme Court strikes down Trump’s tariffs 6-3
  • Trump announces new global tariffs of up to 15%
  • USD set for big week due to high-risk events
  • Precious metals rally on risk-off mode

After the Supreme Court ruled against Trump’s tariffs on Friday, he fought back, announcing new global tariffs of 10% – which were hiked to 15% over the weekend.

This development has certainly opened a can of worms:

  • The $175 billion problem – The US government may have to refund ~$175 billion in duties already collected. *Note: Polymarket are forecasting a 20% chance*
  • Fiscal woes – Tariffs were projected to bring in trillions of dollars over the course of Trump’s term and beyond. With this gone, the fiscal outlook deteriorated further.
  •  Existing trade deals – Senior US officials have also urged that Trump’s defeat won’t unravel deals negotiated with trade partners…

Renewed global trade uncertainty could spell trouble for US equities while supporting safe-haven assets.

Markets kicked off Sunday evening with price gaps from Friday’s close as investors reacted to the weekend turmoil.

  • USDInd: -0.3%
  •  XAUUSD: +1%
  • XAGUSD: +3%


USDInd set for rollercoaster week?

DID YOU KNOW:

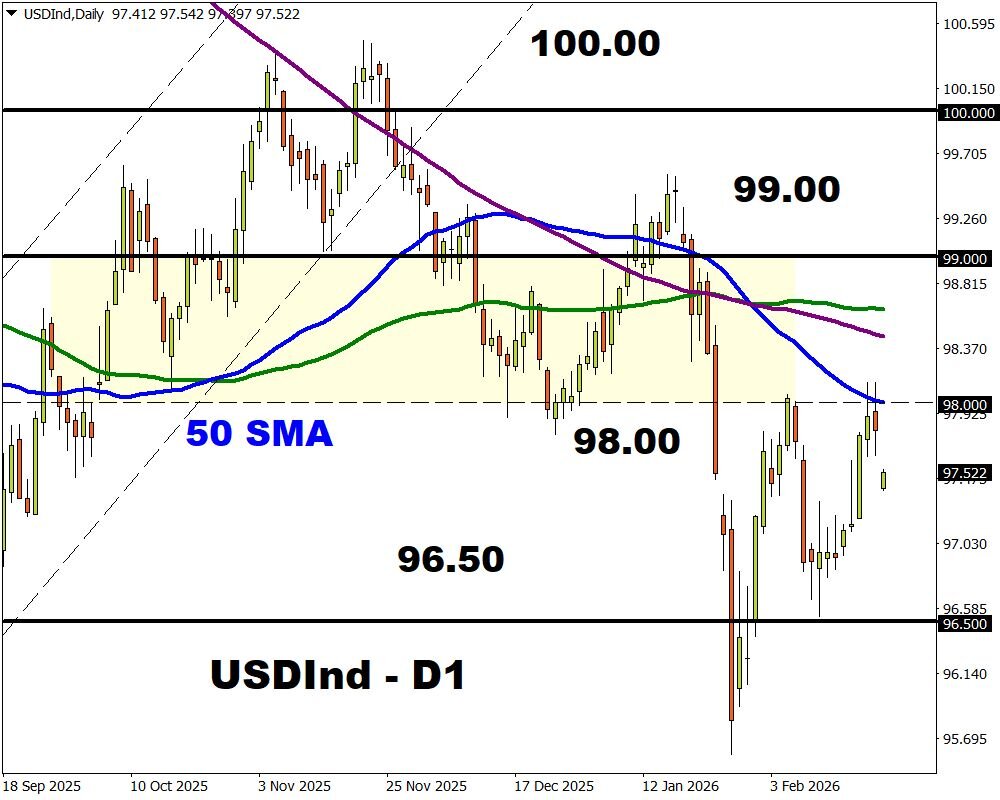
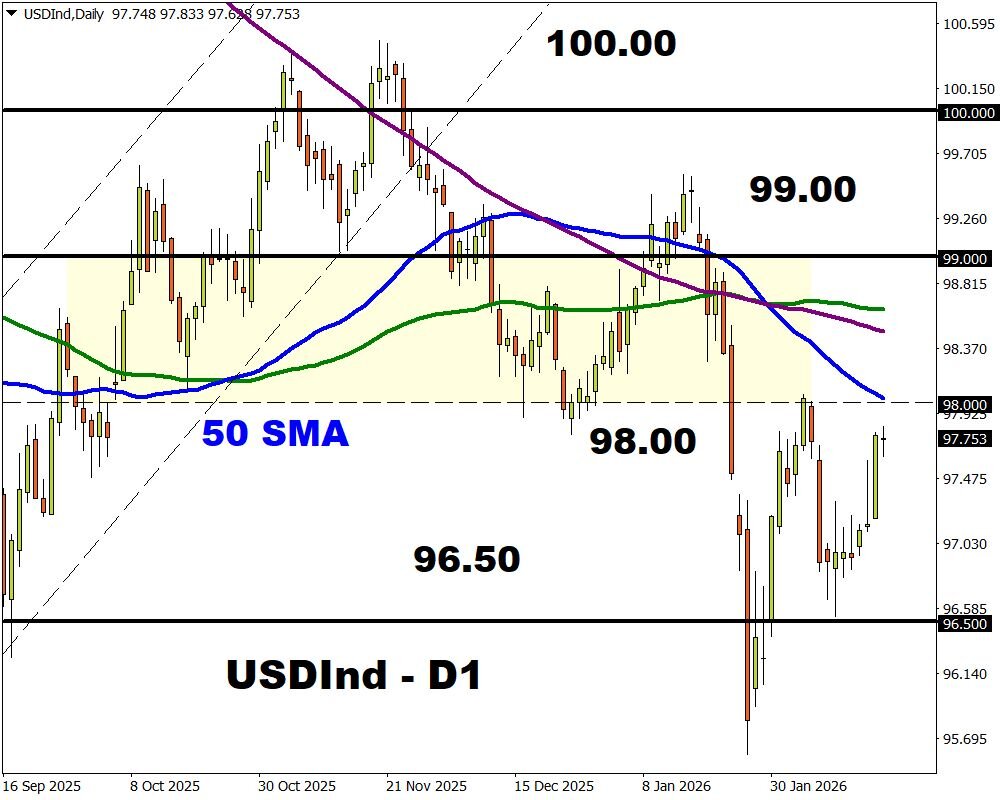
FXTM’s USDInd has gained roughly 1% month-to-date with prices lingering below 98.00.

WHAT COULD MOVE USDInd THIS WEEK:

It could be a pivotal week for the greenback thanks to a triple risk cocktail revolving around Trump.

  • Trump’s tariff chaos: A renewed sense of uncertainty over global trade following the Supreme Court’s decision and the ramifications it may have on the US economy could hit the dollar.
  • Trump’s State of the Union address: On Tuesday, President Trump will deliver the first State of the Union address of his second term. Any comments on the economy, immigration, and foreign policy may shake the greenback.
  • Trump’s threat to strike Iran: The United States and Iran are to hold the next round of nuclear talks in Geneva on Thursday after tensions escalated in recent days. Whatever the outcome of the talks may impact the US dollar.

Beyond these high-impact events, top US data and speeches by various Fed officials could add to the overall volatility.

POTENTIAL SCENARIOS:

  • BULLISH: A strong daily close above 98.00 may open a path toward the 200-day SMA, 100-day SMA and 99.00.
  • BEARISH: Weakness below 98.00 could signal a decline toward 97.00 and 96.50.


Forex-Time-LogoArticle by ForexTime


ForexTime Ltd (FXTM) is an award winning international online forex broker regulated by CySEC 185/12 www.forextime.com

OpenAI has deleted the word ‘safely’ from its mission – and its new structure is a test for whether AI serves society or shareholders

By Alnoor Ebrahim, Tufts University 

OpenAI, the maker of the most popular AI chatbot, used to say it aimed to build artificial intelligence that “safely benefits humanity, unconstrained by a need to generate financial return,” mission statement. But the ChatGPT maker seems to no longer have the same emphasis on doing so “safely.”

While reviewing its latest IRS disclosure form, which was released in November 2025 and covers 2024, I noticed OpenAI had removed “safely” from its mission statement, among other changes. That change in wording coincided with its transformation from a nonprofit organization into a business increasingly focused on profits.

OpenAI currently faces several lawsuits related to its products’ safety, making this change newsworthy. Many of the plaintiffs suing the AI company allege psychological manipulation, wrongful death and assisted suicide, while others have filed negligence claims.

As a scholar of nonprofit accountability and the governance of social enterprises, I see the deletion of the word “safely” from its mission statement as a significant shift that has largely gone unreported – outside highly specialized outlets.

And I believe OpenAI’s makeover is a test case for how we, as a society, oversee the work of organizations that have the potential to both provide enormous benefits and do catastrophic harm.

Tracing OpenAI’s origins

OpenAI, which also makes the Sora video artificial intelligence app, was founded as a nonprofit scientific research lab in 2015. Its original purpose was to benefit society by making its findings public and royalty-free rather than to make money.

To raise the money that developing its AI models would require, OpenAI, under the leadership of CEO Sam Altman, created a for-profit subsidiary in 2019. Microsoft initially invested US$1 billion in this venture; by 2024 that sum had topped $13 billion.

In exchange, Microsoft was promised a portion of future profits, capped at 100 times its initial investment. But the software giant didn’t get a seat on OpenAI’s nonprofit board – meaning it lacked the power to help steer the AI venture it was funding.

A subsequent round of funding in late 2024, which raised $6.6 billion from multiple investors, came with a catch: that the funding would become debt unless OpenAI converted to a more traditional for-profit business in which investors could own shares, without any caps on profits, and possibly occupy board seats.

Establishing a new structure

In October 2025, OpenAI reached an agreement with the attorneys general of California and Delaware to become a more traditional for-profit company.

Under the new arrangement, OpenAI was split into two entities: a nonprofit foundation and a for-profit business.

The restructured nonprofit, the OpenAI Foundation, owns about one-fourth of the stock in a new for-profit public benefit corporation, the OpenAI Group. Both are headquartered in California but incorporated in Delaware.

A public benefit corporation is a business that must consider interests beyond shareholders, such as those of society and the environment, and it must issue an annual benefit report to its shareholders and the public. However, it is up to the board to decide how to weigh those interests and what to report in terms of the benefits and harms caused by the company.

The new structure is described in a signed in October 2025 by OpenAI and the California attorney general, and endorsed by the Delaware attorney general.

Many business media outlets heralded the move, predicting that it would usher in more investment. Two months later, SoftBank, a Japanese conglomerate, finalized a $41 billion investment in OpenAI.

Changing its mission statement

Most charities must file forms annually with the Internal Revenue Service with details about their missions, activities and financial status to show that they qualify for tax-exempt status. Because the IRS makes the forms public, they have become a way for nonprofits to signal their missions to the world.

In its forms for 2022, , OpenAI said its mission was “to build general-purpose artificial intelligence (AI) that safely benefits humanity, unconstrained by a need to generate financial return.”

This is the top of the front page of the 2023 990 form for OpenAI, with its mission stated at the bottom of the screenshot.
OpenAI’s mission statement as of 2023 included the word ‘safely.’
IRS via Candid

That mission statement has changed, as of – which the company filed with the IRS in late 2025. It became “to ensure that artificial general intelligence benefits all of humanity.”

This is the top of the front page of the 2024 990 form for OpenAI, with its mission stated at the bottom of the screenshot.
OpenAI’s mission statement as of 2024 no longer included the word ‘safely.’
IRS via Candid

OpenAI had dropped its commitment to safety from its mission statement – along with a commitment to being “unconstrained” by a need to make money for investors. According to Platformer, a tech media outlet, it has also disbanded its “mission alignment” team.

In my view, these changes explicitly signal that OpenAI is making its profits a higher priority than the safety of its products.

To be sure, OpenAI continues to mention safety when it discusses its mission. “We view this mission as the most important challenge of our time,” it states on its website. “It requires simultaneously advancing AI’s capability, safety, and positive impact in the world.”

Revising its legal governance structure

Nonprofit boards are responsible for key decisions and upholding their organization’s mission.

Unlike private companies, board members of tax-exempt charitable nonprofits cannot personally enrich themselves by taking a share of earnings. In cases where a nonprofit owns a for-profit business, as OpenAI did with its previous structure, investors can take a cut of profits – but they typically do not get a seat on the board or have an opportunity to elect board members, because that would be seen as a conflict of interest.

The OpenAI Foundation now has a 26% stake in OpenAI Group. In effect, that means that the nonprofit board has given up nearly three-quarters of its control over the company. Software giant Microsoft owns a slightly larger stake – 27% of OpenAI’s stock – due to its $13.8 billion investment in the AI company to date. OpenAI’s employees and its other investors own the rest of the shares.

Seeking more investment

The main goal of OpenAI’s restructuring, which it called a “recapitalization,” was to attract more private investment in the race for AI dominance.

It has already succeeded on that front.

As of early February 2026, the company was in talks with SoftBank for an additional $30 billion and stands to get up to a total of $60 billion from Amazon, Nvidia and Microsoft combined.

OpenAI is now valued at over $500 billion, up from $300 billion in March 2025. The new structure also paves the way for an eventual initial public offering, which, if it happens, would not only help the company raise more capital through stock markets but would also increase the pressure to make money for its shareholders.

OpenAI says the foundation’s endowment is worth about $130 billion.

Those numbers are only estimates because OpenAI is a privately held company without publicly traded shares. That means these figures are based on market value estimates rather than any objective evidence, such as market capitalization.

When he announced the new structure, California Attorney General Rob Bonta said, “We secured concessions that ensure charitable assets are used for their intended purpose.” He also predicted that “safety will be prioritized” and said the “top priority is, and always will be, protecting our kids.”

Steps that might help keep people safe

At the same time, several conditions in the OpenAI restructuring memo are designed to promote safety, including:

  1. A safety and security committee on the OpenAI Foundation board has the authority to that could potentially include the halting of a release of new OpenAI products based on assessments of their risks.
  2. The for-profit OpenAI Group has its own board, which must consider only OpenAI’s mission – rather than financial issues – regarding safety and security issues.
  3. The OpenAI Foundation’s nonprofit board gets to appoint all members of the OpenAI Group’s for-profit board.

But given that neither the mission of the foundation nor of the OpenAI group explicitly alludes to safety, it will be hard to hold their boards accountable for it.

Furthermore, since all but one board member currently serve on both boards, it is hard to see how they might oversee themselves. And doesn’t indicate whether he was aware of the removal of any reference to safety from the mission statement.

Identifying other paths OpenAI could have taken

There are alternative models that I believe would serve the public interest better than this one.

When Health Net, a California nonprofit health maintenance organization, converted to a for-profit insurance company in 1992, regulators required that 80% of its equity be transferred to another nonprofit health foundation. Unlike with OpenAI, the foundation had majority control after the transformation.

A coalition of California nonprofits has argued that the attorney general should require OpenAI to transfer all of its assets to an independent nonprofit.

Another example is The Philadelphia Inquirer. The Pennsylvania newspaper became a for-profit public benefit corporation in 2016. It belongs to the Lenfest Institute, a nonprofit.

This structure allows Philadelphia’s biggest newspaper to attract investment without compromising its purpose – journalism serving the needs of its local communities. It’s become a model for potentially transforming the local news industry.

At this point, I believe that the public bears the burden of two governance failures. One is that OpenAI’s board has apparently abandoned its mission of safety. And the other is that the attorneys general of California and Delaware have let that happen.The Conversation

About the Author:

Alnoor Ebrahim, Professor of International Business, The Fletcher School & Tisch College of Civic Life, Tufts University

This article is republished from The Conversation under a Creative Commons license. Read the original article.


Currency Speculators push Japanese Yen, USD Index Bets into Bullish Positions

By InvestMacro

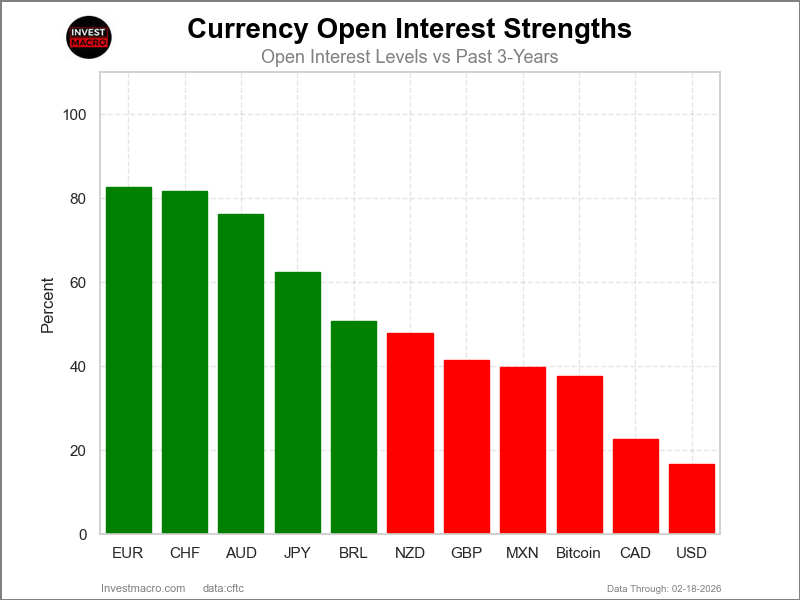
Speculators OI FX Futures COT Chart

Here are the latest charts and statistics for the Commitment of Traders (COT) data published by the Commodities Futures Trading Commission (CFTC).

The latest COT data is updated through Tuesday February 17th and shows a quick view of how large market participants (for-profit speculators and commercial traders) were positioned in the futures markets. All currency positions are in direct relation to the US dollar where, for example, a bet for the euro is a bet that the euro will rise versus the dollar while a bet against the euro will be a bet that the euro will decline versus the dollar.

Weekly Speculator Changes led by Japanese Yen, AUD & CAD
Speculators Nets FX Futures COT Chart
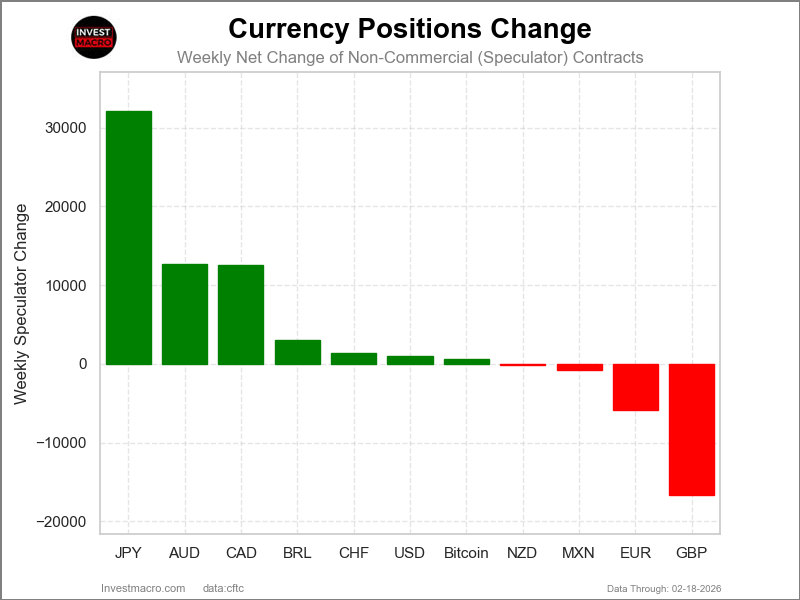
The COT currency market speculator bets were overall higher this week as seven out of the eleven currency markets we cover had higher positioning while the other four markets had lower speculator contracts.

Leading the gains for the currency markets was the Japanese Yen (32,061 contracts), the Australian Dollar (12,722 contracts), the Canadian Dollar (12,550 contracts), the Swiss Franc (1,378 contracts), the US Dollar Index (1,057 contracts), the Brazilian Real (681 contracts) and Bitcoin (621 contracts) also showing a positive week.

The currencies seeing declines in speculator bets on the week were the British Pound (-16,594 contracts), the EuroFX (-5,825 contracts), the Mexican Peso (-829 contracts) and the New Zealand Dollar (-94 contracts) registering lower bets on the week.

Currency Speculators push Japanese Yen, USD Index Bets into Bullish Positions

Highlighting the currency data this week, there were strong gains by the Japanese Yen, the Australian Dollar, and the Canadian Dollar while the US Dollar Index saw its first bullish position in quite a while.

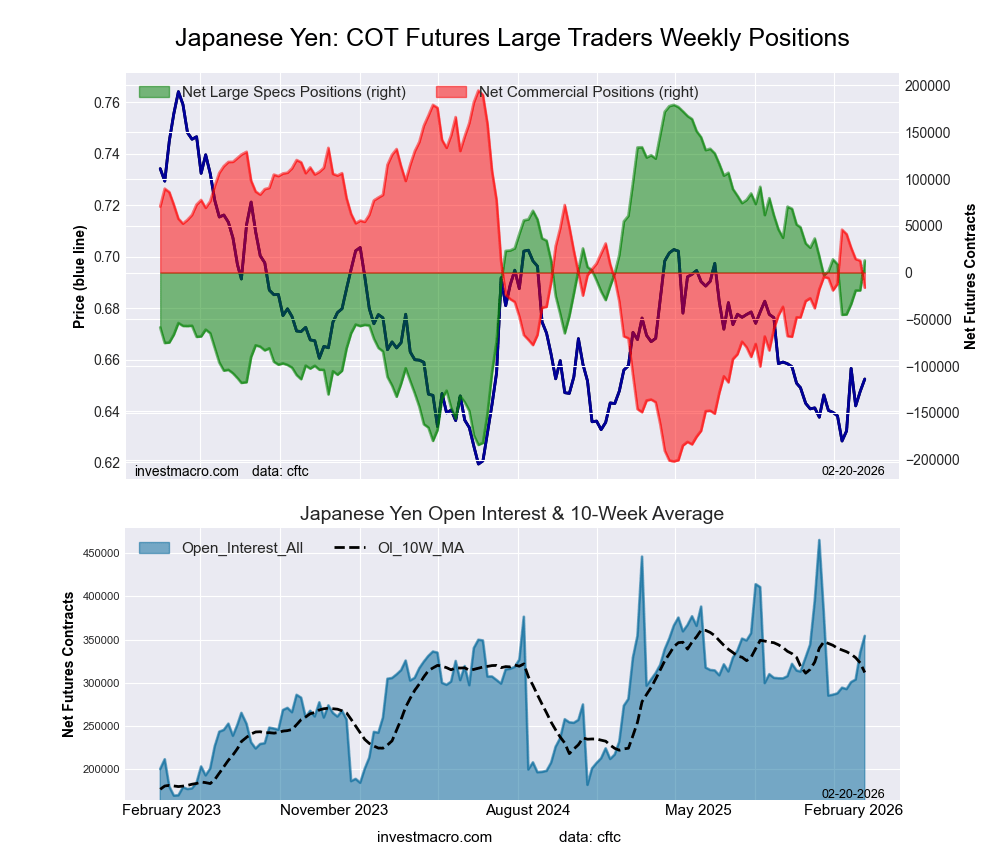
The Japanese yen speculator position this week rose by over +32,000 weekly contracts. This was the highest jump in one-week contracts since October. The Japanese weekly speculator contracts have now risen for five consecutive weeks and in seven out of the last nine weeks. This positive sentiment has brought the Japanese yen net speculator position back into a bullish level with a total net standing of 12,955 contracts this week. This is the first positive week out of the last six weeks for the Japanese yen position in the FOREX markets. The Japanese yen has continued to be a subdued currency against the US dollar and saw a shortfall this week. The USD/JPY currency pair this week closed above the 155.00 level, which remains near historic Japanese yen weakness. However, this currency pair has bounced off of resistance at the 160.00 level for the third time in the past year.

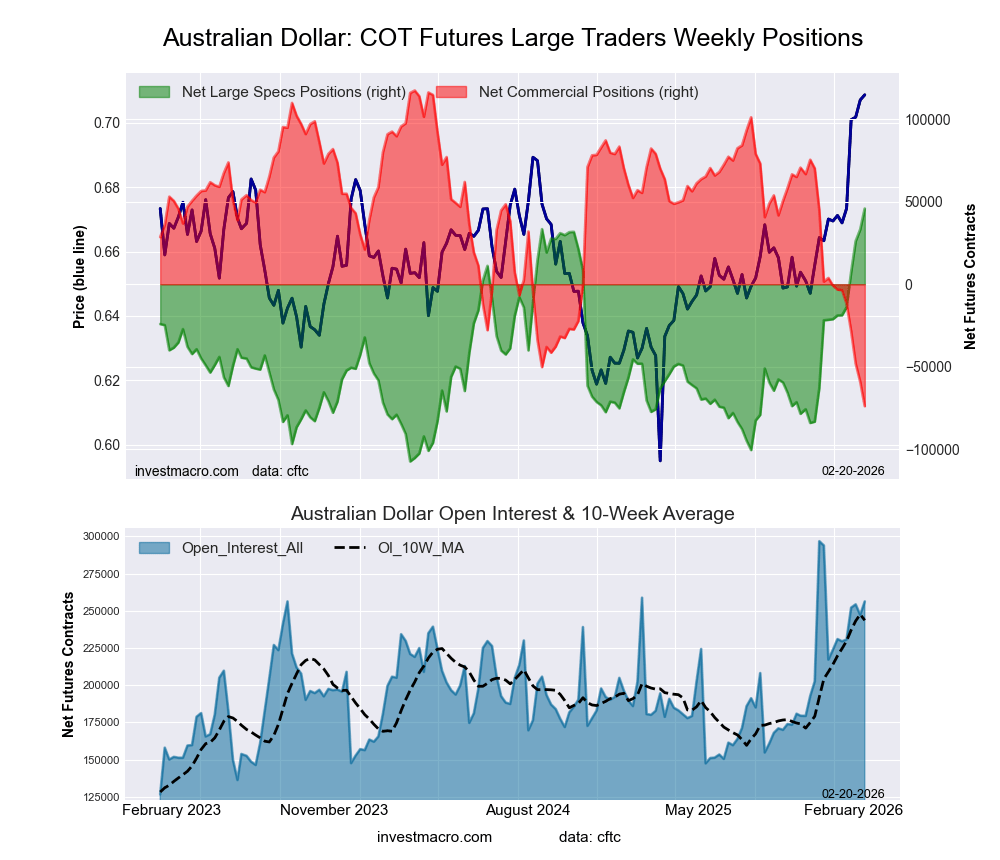
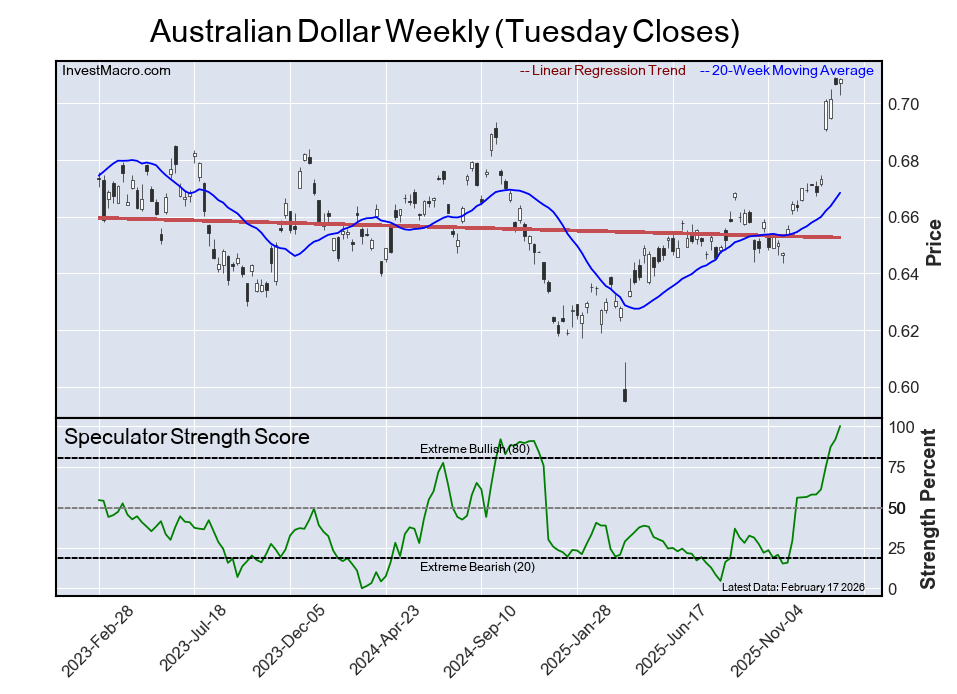
The Australian Dollar speculator position continues to improve week to week. This week’s gain was over +12,000 contracts, and the Australian Dollar speculator position has now risen for 12 consecutive weeks. The spec position has jumped by over +130,000 contracts in the past 12 weeks, which has brought the position from a -84,176 contracts on November 25th to this week’s total of 45,931 net contracts. The Australian Dollar speculator level had been so consistently bearish that we have not seen a net position above this week’s level since October of 2017. In the forex markets, the Australian Dollar keeps chugging along higher against the US Dollar and this week closed above the 0.7075 level, marking the highest close since 2023. The Australian Dollar is higher by approximately 6% since the beginning of 2026.

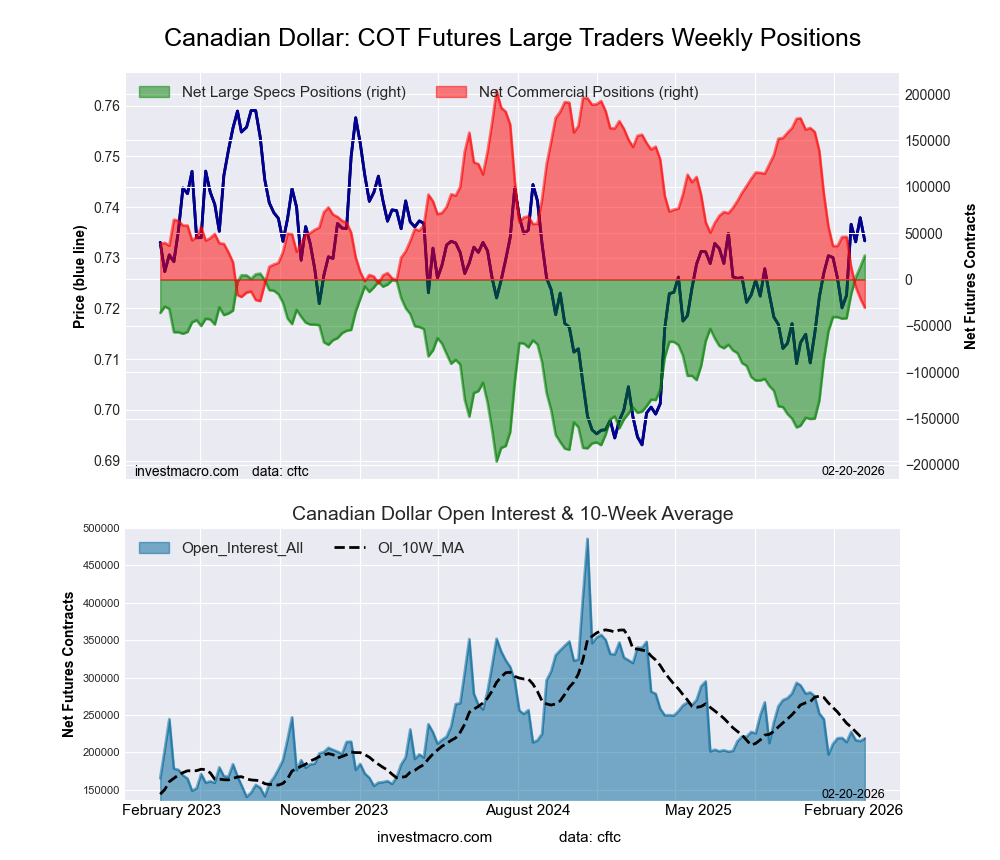
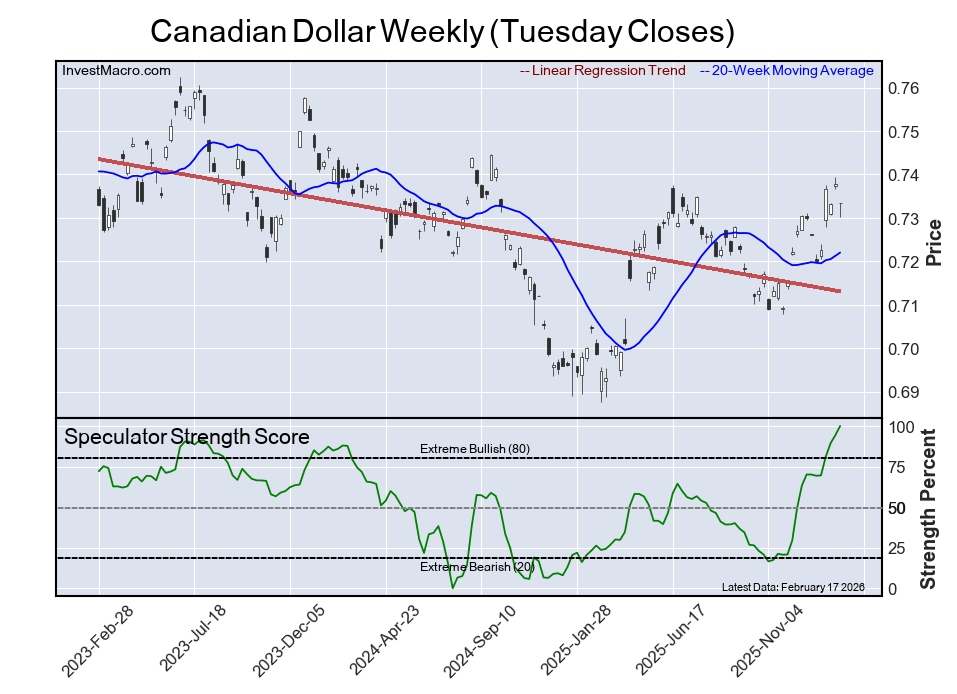
Next up, the Canadian Dollar has also been on a rise as the speculator position has now risen for five consecutive weeks and has been higher in 10 out of the last 12 weeks. In just these last 12 weeks alone, the speculator position has surged by +176,240 contracts, taking the overall net position from a super bearish total of -150,414 net contracts on November 25th to this week’s bullish position of 25,826 net contracts. The Canadian Dollar has also been modestly rising in the currency markets against the US Dollar. Since November, the CAD is up by approximately 3% and the CAD currently trades just below its 200-week moving average at the 0.7312 exchange rate.

Next up, the US Dollar Index (DXY) has seen four consecutive weekly gains in speculator positions and has now seen higher speculator bets on a weekly basis in 11 out of the past 12 weeks. This week’s gain brought the overall USD Index net positioning to a small bullish position of just +328 contracts. This is the first bullish position since June of 2025, a span of 36 weeks. In the foreign exchange markets this week, the USD Index was higher by almost 1% on the week, but price gains were rejected around the 98.00 resistance level. Since the start of 2025, the DXY is down by approximately 11% and currently, the DXY has overhead resistance at 98.00, while looking lower around the 96.50 level, there has been strong support found.

U.S. Dollar Index Leads Price Gains This Week

The U.S. Dollar Index was the highest riser over the past five days, with a 1.01% increase on the week. The Mexican Peso was marginally higher with a 0.22% increase, followed by the Australian Dollar, which rose by 0.12%.

On the downside, the biggest decline was seen by Bitcoin which fell by -1.58% followed by the Japanese Yen, which dipped by -1.49%. The British Pound Sterling was lower by -1.23% followed by the New Zealand Dollar, which declined by -1.10%, and the Swiss Franc, which fell by -0.94%. The Euro dipped by -0.74% while the Canadian Dollar was lower by -0.40%, and the Brazilian Real saw a modestly lower return by -0.24%.


Currencies Data:

Speculators FX Futures COT Data Table
Legend: Open Interest | Speculators Current Net Position | Weekly Specs Change | Specs Strength Score compared to last 3-Years (0-100 range)


Strength Scores led by Canadian Dollar & Australian Dollar
Speculators Strength Scores FX Futures COT Chart
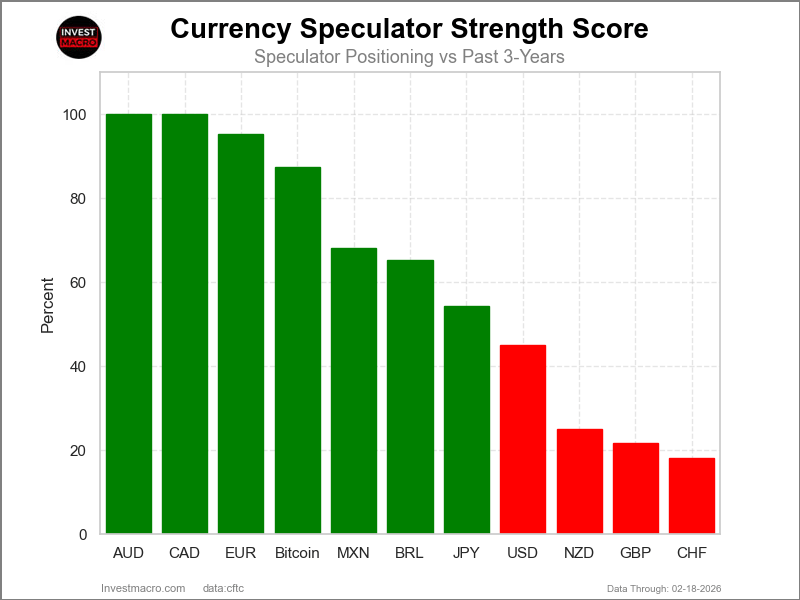
COT Strength Scores (a normalized measure of Speculator positions over a 3-Year range, from 0 to 100 where above 80 is Extreme-Bullish and below 20 is Extreme-Bearish) showed that the Canadian Dollar (100 percent) and the Australian Dollar (100 percent) lead the currency markets this week. The EuroFX (95 percent), Bitcoin (87 percent) and the Mexican Peso (68 percent) come in as the next highest in the weekly strength scores.

On the downside, the Swiss Franc (18 percent) comes in at the lowest strength levels currently and is the lone currency in Extreme-Bearish territory (below 20 percent). The next lowest strength scores are the British Pound (22 percent), the New Zealand Dollar (25 percent) and the US Dollar Index (45 percent).

3-Year Strength Statistics:
US Dollar Index (45.0 percent) vs US Dollar Index previous week (42.2 percent)
EuroFX (95.2 percent) vs EuroFX previous week (97.4 percent)
British Pound Sterling (21.6 percent) vs British Pound Sterling previous week (28.6 percent)
Japanese Yen (54.3 percent) vs Japanese Yen previous week (45.4 percent)
Swiss Franc (18.1 percent) vs Swiss Franc previous week (15.3 percent)
Canadian Dollar (100.0 percent) vs Canadian Dollar previous week (94.3 percent)
Australian Dollar (100.0 percent) vs Australian Dollar previous week (91.7 percent)
New Zealand Dollar (24.9 percent) vs New Zealand Dollar previous week (25.0 percent)
Mexican Peso (68.2 percent) vs Mexican Peso previous week (68.7 percent)
Brazilian Real (63.0 percent) vs Brazilian Real previous week (62.5 percent)
Bitcoin (87.4 percent) vs Bitcoin previous week (74.2 percent)


Bitcoin & Australian Dollar top the 6-Week Strength Trends
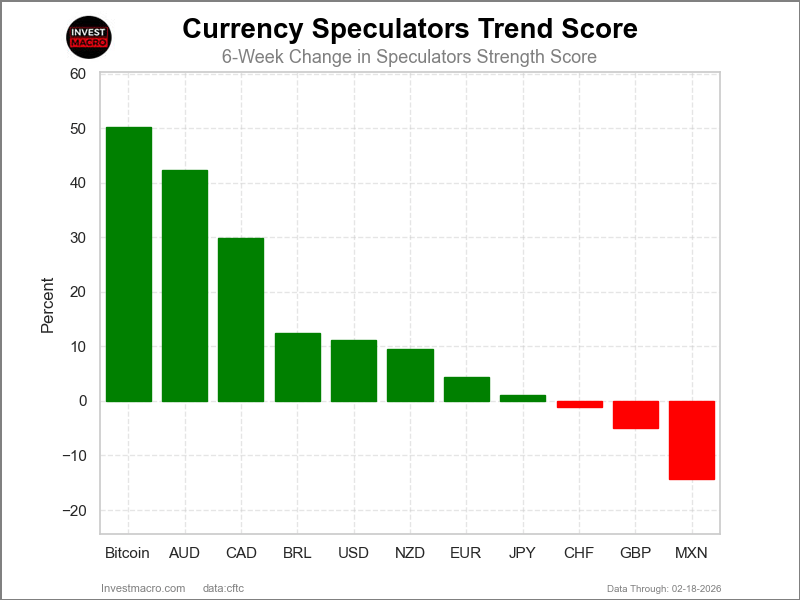
Speculators Trends FX Futures COT Chart
COT Strength Score Trends (or move index, calculates the 6-week changes in strength scores) showed that the Bitcoin (50 percent) and the Australian Dollar (42 percent) lead the past six weeks trends for the currencies. The Canadian Dollar (30 percent), the US Dollar Index (11 percent) and the New Zealand Dollar (10 percent) are the next highest positive movers in the 3-Year trends data.

The Mexican Peso (-14 percent) leads the downside trend scores currently with the British Pound (-5 percent) and the Swiss Franc (-1 percent) following next with lower trend scores.

3-Year Strength Trends:
US Dollar Index (11.2 percent) vs US Dollar Index previous week (8.7 percent)
EuroFX (4.4 percent) vs EuroFX previous week (8.7 percent)
British Pound Sterling (-5.0 percent) vs British Pound Sterling previous week (3.1 percent)
Japanese Yen (1.1 percent) vs Japanese Yen previous week (-9.1 percent)
Swiss Franc (-1.2 percent) vs Swiss Franc previous week (3.9 percent)
Canadian Dollar (29.9 percent) vs Canadian Dollar previous week (24.2 percent)
Australian Dollar (42.3 percent) vs Australian Dollar previous week (35.5 percent)
New Zealand Dollar (9.5 percent) vs New Zealand Dollar previous week (9.5 percent)
Mexican Peso (-14.4 percent) vs Mexican Peso previous week (-12.2 percent)
Brazilian Real (-7.6 percent) vs Brazilian Real previous week (-12.2 percent)
Bitcoin (50.3 percent) vs Bitcoin previous week (32.4 percent)


Individual COT Forex Markets:

US Dollar Index Futures:
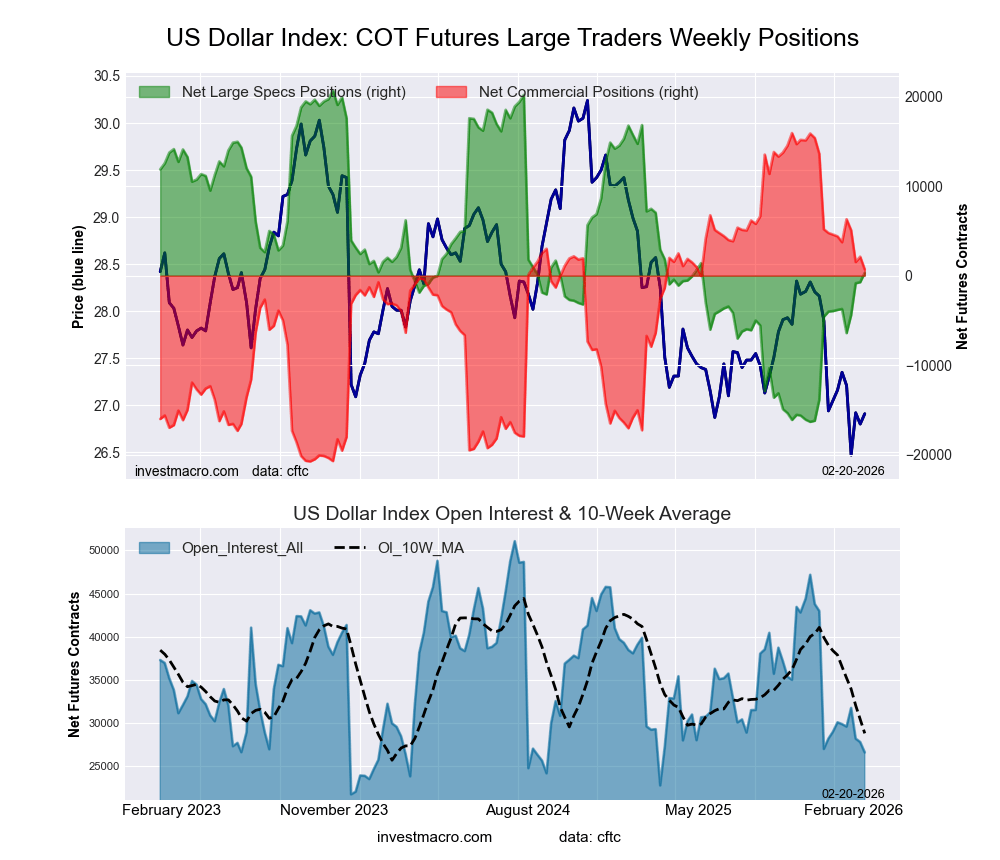
US Dollar Index Forex Futures COT ChartThe US Dollar Index large speculator standing this week reached a net position of 328 contracts in the data reported through Tuesday. This was a weekly boost of 1,057 contracts from the previous week which had a total of -729 net contracts.

This week’s current strength score (the trader positioning range over the past three years, measured from 0 to 100) shows the speculators are currently Bearish with a score of 45.0 percent. The commercials are Bullish with a score of 58.5 percent and the small traders (not shown in chart) are Bearish-Extreme with a score of 18.9 percent.

Price Trend-Following Model: Downtrend

Our weekly trend-following model classifies the current market price position as: Downtrend.

US DOLLAR INDEX StatisticsSPECULATORSCOMMERCIALSSMALL TRADERS
– Percent of Open Interest Longs:58.026.77.5
– Percent of Open Interest Shorts:56.724.111.3
– Net Position:328694-1,022
– Gross Longs:15,4167,0941,996
– Gross Shorts:15,0886,4003,018
– Long to Short Ratio:1.0 to 11.1 to 10.7 to 1
NET POSITION TREND:
– Strength Index Score (3 Year Range Pct):45.058.518.9
– Strength Index Reading (3 Year Range):BearishBullishBearish-Extreme
NET POSITION MOVEMENT INDEX:
– 6-Week Change in Strength Index:11.2-10.1-7.1


Euro Currency Futures:

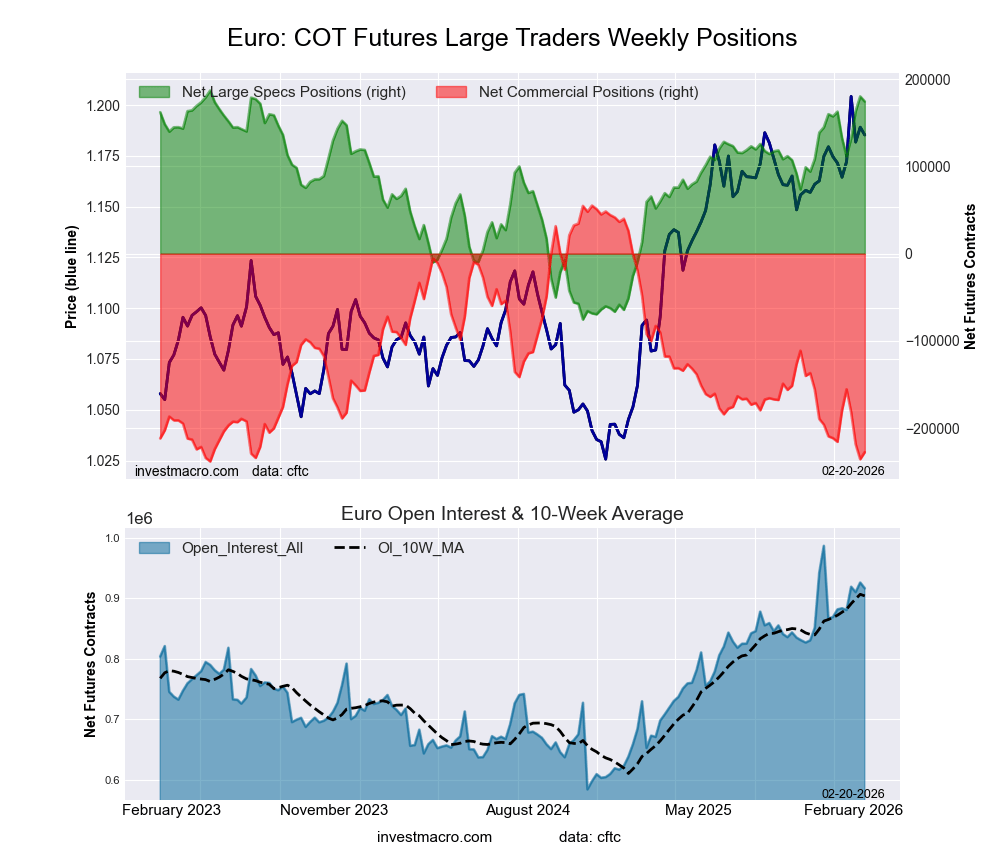
Euro Currency Futures COT ChartThe Euro Currency large speculator standing this week reached a net position of 174,480 contracts in the data reported through Tuesday. This was a weekly decline of -5,825 contracts from the previous week which had a total of 180,305 net contracts.

This week’s current strength score (the trader positioning range over the past three years, measured from 0 to 100) shows the speculators are currently Bullish-Extreme with a score of 95.2 percent. The commercials are Bearish-Extreme with a score of 3.6 percent and the small traders (not shown in chart) are Bullish-Extreme with a score of 86.8 percent.

Price Trend-Following Model: Uptrend

Our weekly trend-following model classifies the current market price position as: Uptrend.

EURO Currency StatisticsSPECULATORSCOMMERCIALSSMALL TRADERS
– Percent of Open Interest Longs:34.053.110.5
– Percent of Open Interest Shorts:15.078.04.7
– Net Position:174,480-227,67753,197
– Gross Longs:311,549487,21996,673
– Gross Shorts:137,069714,89643,476
– Long to Short Ratio:2.3 to 10.7 to 12.2 to 1
NET POSITION TREND:
– Strength Index Score (3 Year Range Pct):95.23.686.8
– Strength Index Reading (3 Year Range):Bullish-ExtremeBearish-ExtremeBullish-Extreme
NET POSITION MOVEMENT INDEX:
– 6-Week Change in Strength Index:4.4-4.00.4


British Pound Sterling Futures:

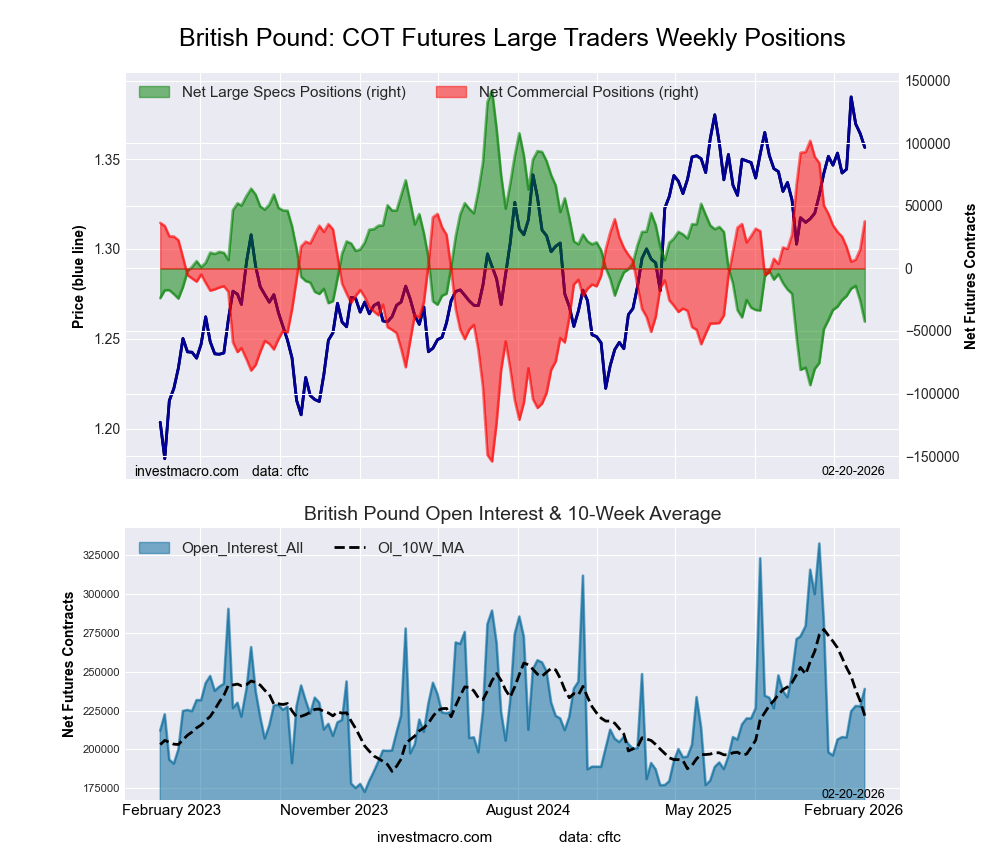
British Pound Sterling Futures COT ChartThe British Pound Sterling large speculator standing this week reached a net position of -42,404 contracts in the data reported through Tuesday. This was a weekly fall of -16,594 contracts from the previous week which had a total of -25,810 net contracts.

This week’s current strength score (the trader positioning range over the past three years, measured from 0 to 100) shows the speculators are currently Bearish with a score of 21.6 percent. The commercials are Bullish with a score of 74.9 percent and the small traders (not shown in chart) are Bullish with a score of 65.6 percent.

Price Trend-Following Model: Uptrend

Our weekly trend-following model classifies the current market price position as: Uptrend.

BRITISH POUND StatisticsSPECULATORSCOMMERCIALSSMALL TRADERS
– Percent of Open Interest Longs:34.348.213.8
– Percent of Open Interest Shorts:52.132.411.8
– Net Position:-42,40437,6544,750
– Gross Longs:82,015115,02232,847
– Gross Shorts:124,41977,36828,097
– Long to Short Ratio:0.7 to 11.5 to 11.2 to 1
NET POSITION TREND:
– Strength Index Score (3 Year Range Pct):21.674.965.6
– Strength Index Reading (3 Year Range):BearishBullishBullish
NET POSITION MOVEMENT INDEX:
– 6-Week Change in Strength Index:-5.03.39.0


Japanese Yen Futures:

Japanese Yen Forex Futures COT ChartThe Japanese Yen large speculator standing this week reached a net position of 12,955 contracts in the data reported through Tuesday. This was a weekly gain of 32,061 contracts from the previous week which had a total of -19,106 net contracts.

This week’s current strength score (the trader positioning range over the past three years, measured from 0 to 100) shows the speculators are currently Bullish with a score of 54.3 percent. The commercials are Bearish with a score of 46.8 percent and the small traders (not shown in chart) are Bearish with a score of 45.2 percent.

Price Trend-Following Model: Weak Downtrend

Our weekly trend-following model classifies the current market price position as: Weak Downtrend.

JAPANESE YEN StatisticsSPECULATORSCOMMERCIALSSMALL TRADERS
– Percent of Open Interest Longs:40.440.011.1
– Percent of Open Interest Shorts:36.844.610.1
– Net Position:12,955-16,1683,213
– Gross Longs:143,172141,76639,166
– Gross Shorts:130,217157,93435,953
– Long to Short Ratio:1.1 to 10.9 to 11.1 to 1
NET POSITION TREND:
– Strength Index Score (3 Year Range Pct):54.346.845.2
– Strength Index Reading (3 Year Range):BullishBearishBearish
NET POSITION MOVEMENT INDEX:
– 6-Week Change in Strength Index:1.1-1.0-0.4


Swiss Franc Futures:

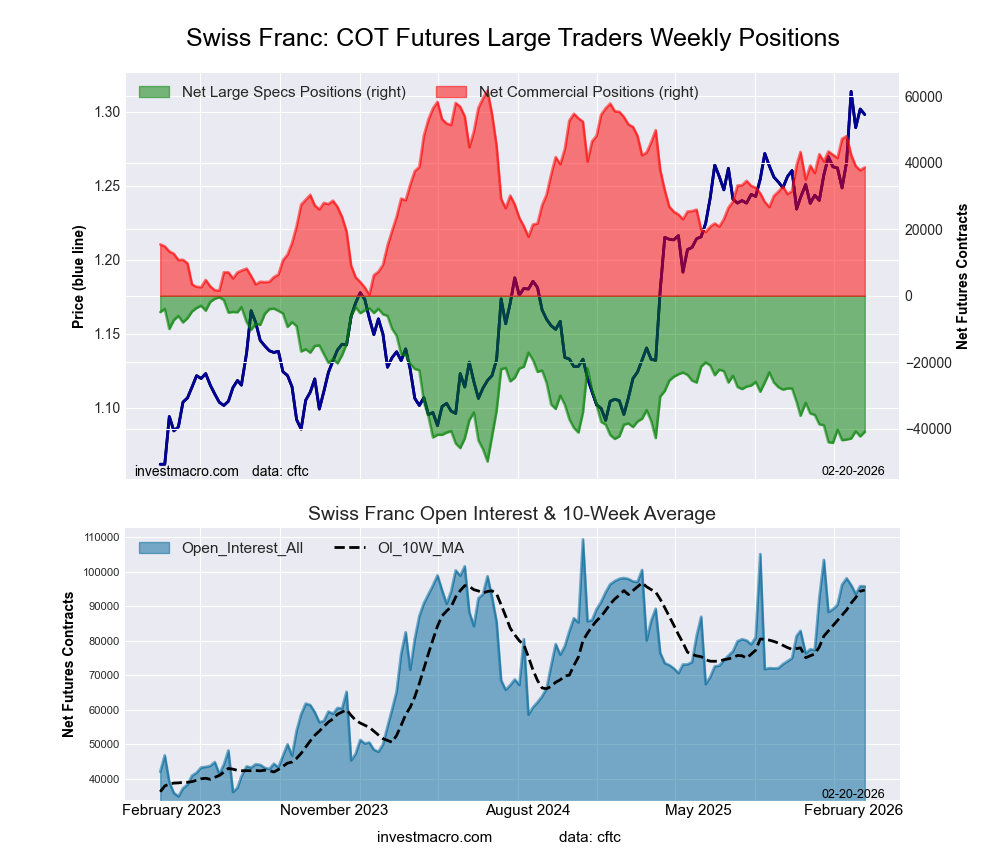
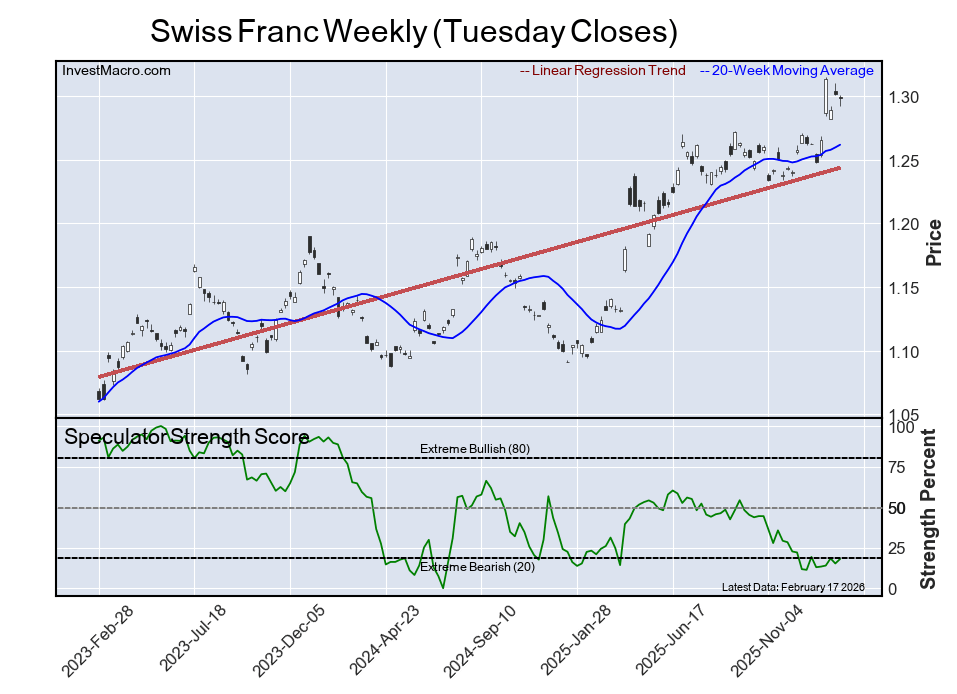
Swiss Franc Forex Futures COT ChartThe Swiss Franc large speculator standing this week reached a net position of -40,881 contracts in the data reported through Tuesday. This was a weekly increase of 1,378 contracts from the previous week which had a total of -42,259 net contracts.

This week’s current strength score (the trader positioning range over the past three years, measured from 0 to 100) shows the speculators are currently Bearish-Extreme with a score of 18.1 percent. The commercials are Bullish with a score of 62.4 percent and the small traders (not shown in chart) are Bullish-Extreme with a score of 88.4 percent.

Price Trend-Following Model: Strong Uptrend

Our weekly trend-following model classifies the current market price position as: Strong Uptrend.

SWISS FRANC StatisticsSPECULATORSCOMMERCIALSSMALL TRADERS
– Percent of Open Interest Longs:10.568.720.7
– Percent of Open Interest Shorts:53.228.418.3
– Net Position:-40,88138,5962,285
– Gross Longs:10,07265,77319,844
– Gross Shorts:50,95327,17717,559
– Long to Short Ratio:0.2 to 12.4 to 11.1 to 1
NET POSITION TREND:
– Strength Index Score (3 Year Range Pct):18.162.488.4
– Strength Index Reading (3 Year Range):Bearish-ExtremeBullishBullish-Extreme
NET POSITION MOVEMENT INDEX:
– 6-Week Change in Strength Index:-1.2-4.614.5


Canadian Dollar Futures:

Canadian Dollar Forex Futures COT ChartThe Canadian Dollar large speculator standing this week reached a net position of 25,826 contracts in the data reported through Tuesday. This was a weekly rise of 12,550 contracts from the previous week which had a total of 13,276 net contracts.

This week’s current strength score (the trader positioning range over the past three years, measured from 0 to 100) shows the speculators are currently Bullish-Extreme with a score of 100.0 percent. The commercials are Bearish-Extreme with a score of 0.0 percent and the small traders (not shown in chart) are Bullish with a score of 58.0 percent.

Price Trend-Following Model: Uptrend

Our weekly trend-following model classifies the current market price position as: Uptrend.

CANADIAN DOLLAR StatisticsSPECULATORSCOMMERCIALSSMALL TRADERS
– Percent of Open Interest Longs:41.042.914.0
– Percent of Open Interest Shorts:29.256.811.9
– Net Position:25,826-30,3744,548
– Gross Longs:89,60193,65330,479
– Gross Shorts:63,775124,02725,931
– Long to Short Ratio:1.4 to 10.8 to 11.2 to 1
NET POSITION TREND:
– Strength Index Score (3 Year Range Pct):100.00.058.0
– Strength Index Reading (3 Year Range):Bullish-ExtremeBearish-ExtremeBullish
NET POSITION MOVEMENT INDEX:
– 6-Week Change in Strength Index:29.9-28.40.1


Australian Dollar Futures:

Australian Dollar Forex Futures COT ChartThe Australian Dollar large speculator standing this week reached a net position of 45,931 contracts in the data reported through Tuesday. This was a weekly increase of 12,722 contracts from the previous week which had a total of 33,209 net contracts.

This week’s current strength score (the trader positioning range over the past three years, measured from 0 to 100) shows the speculators are currently Bullish-Extreme with a score of 100.0 percent. The commercials are Bearish-Extreme with a score of 0.0 percent and the small traders (not shown in chart) are Bullish-Extreme with a score of 100.0 percent.

Price Trend-Following Model: Strong Uptrend

Our weekly trend-following model classifies the current market price position as: Strong Uptrend.

AUSTRALIAN DOLLAR StatisticsSPECULATORSCOMMERCIALSSMALL TRADERS
– Percent of Open Interest Longs:46.032.317.8
– Percent of Open Interest Shorts:28.161.26.8
– Net Position:45,931-73,98928,058
– Gross Longs:117,82082,85445,601
– Gross Shorts:71,889156,84317,543
– Long to Short Ratio:1.6 to 10.5 to 12.6 to 1
NET POSITION TREND:
– Strength Index Score (3 Year Range Pct):100.00.0100.0
– Strength Index Reading (3 Year Range):Bullish-ExtremeBearish-ExtremeBullish-Extreme
NET POSITION MOVEMENT INDEX:
– 6-Week Change in Strength Index:42.3-36.912.5


New Zealand Dollar Futures:

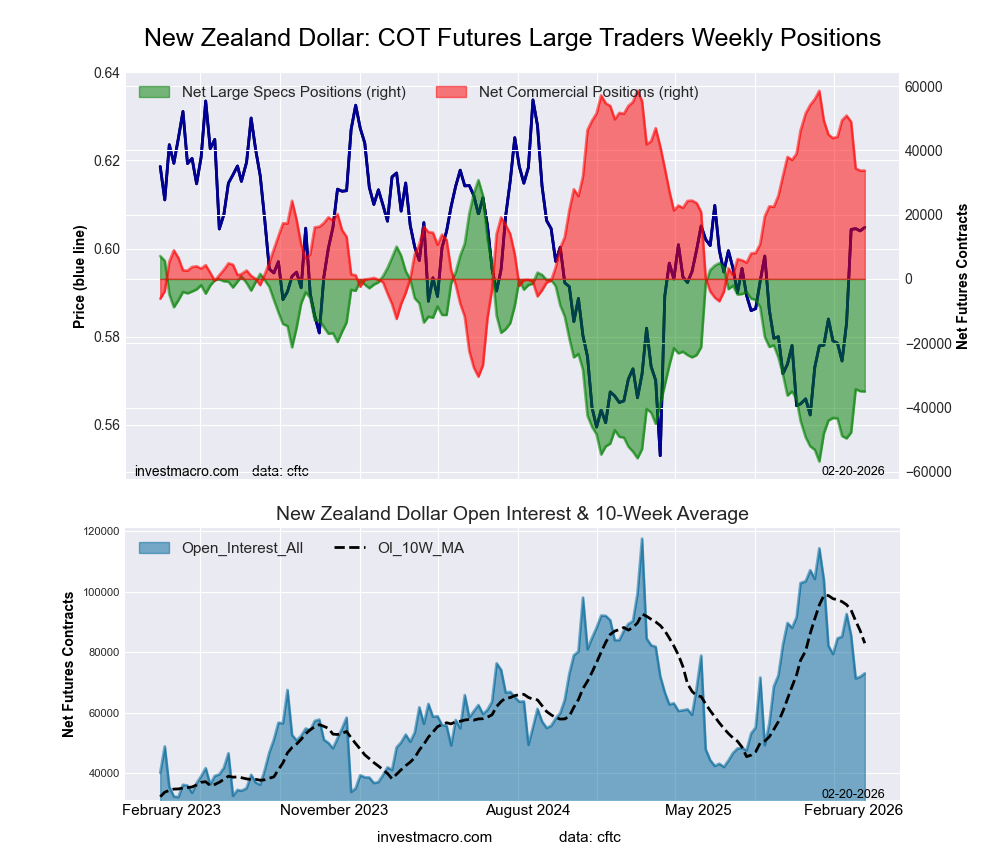
New Zealand Dollar Forex Futures COT ChartThe New Zealand Dollar large speculator standing this week reached a net position of -35,013 contracts in the data reported through Tuesday. This was a weekly lowering of -94 contracts from the previous week which had a total of -34,919 net contracts.

This week’s current strength score (the trader positioning range over the past three years, measured from 0 to 100) shows the speculators are currently Bearish with a score of 24.9 percent. The commercials are Bullish with a score of 72.0 percent and the small traders (not shown in chart) are Bullish with a score of 69.3 percent.

Price Trend-Following Model: Strong Uptrend

Our weekly trend-following model classifies the current market price position as: Strong Uptrend.

NEW ZEALAND DOLLAR StatisticsSPECULATORSCOMMERCIALSSMALL TRADERS
– Percent of Open Interest Longs:15.376.36.5
– Percent of Open Interest Shorts:63.330.14.7
– Net Position:-35,01333,7091,304
– Gross Longs:11,18355,7194,750
– Gross Shorts:46,19622,0103,446
– Long to Short Ratio:0.2 to 12.5 to 11.4 to 1
NET POSITION TREND:
– Strength Index Score (3 Year Range Pct):24.972.069.3
– Strength Index Reading (3 Year Range):BearishBullishBullish
NET POSITION MOVEMENT INDEX:
– 6-Week Change in Strength Index:9.5-11.828.1


Mexican Peso Futures:

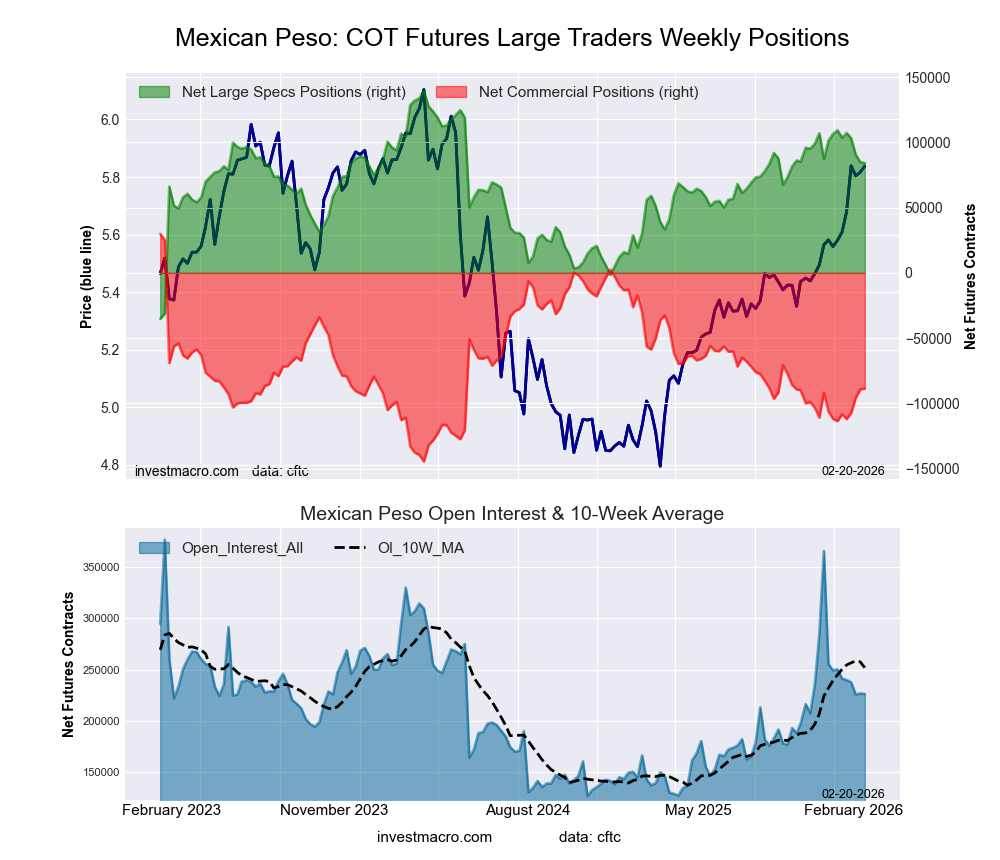
Mexican Peso Futures COT ChartThe Mexican Peso large speculator standing this week reached a net position of 84,122 contracts in the data reported through Tuesday. This was a weekly fall of -829 contracts from the previous week which had a total of 84,951 net contracts.

This week’s current strength score (the trader positioning range over the past three years, measured from 0 to 100) shows the speculators are currently Bullish with a score of 68.2 percent. The commercials are Bearish with a score of 32.0 percent and the small traders (not shown in chart) are Bearish with a score of 48.0 percent.

Price Trend-Following Model: Strong Uptrend

Our weekly trend-following model classifies the current market price position as: Strong Uptrend.

MEXICAN PESO StatisticsSPECULATORSCOMMERCIALSSMALL TRADERS
– Percent of Open Interest Longs:56.639.13.2
– Percent of Open Interest Shorts:19.578.21.2
– Net Position:84,122-88,6654,543
– Gross Longs:128,19788,4497,231
– Gross Shorts:44,075177,1142,688
– Long to Short Ratio:2.9 to 10.5 to 12.7 to 1
NET POSITION TREND:
– Strength Index Score (3 Year Range Pct):68.232.048.0
– Strength Index Reading (3 Year Range):BullishBearishBearish
NET POSITION MOVEMENT INDEX:
– 6-Week Change in Strength Index:-14.414.31.6


Brazilian Real Futures:

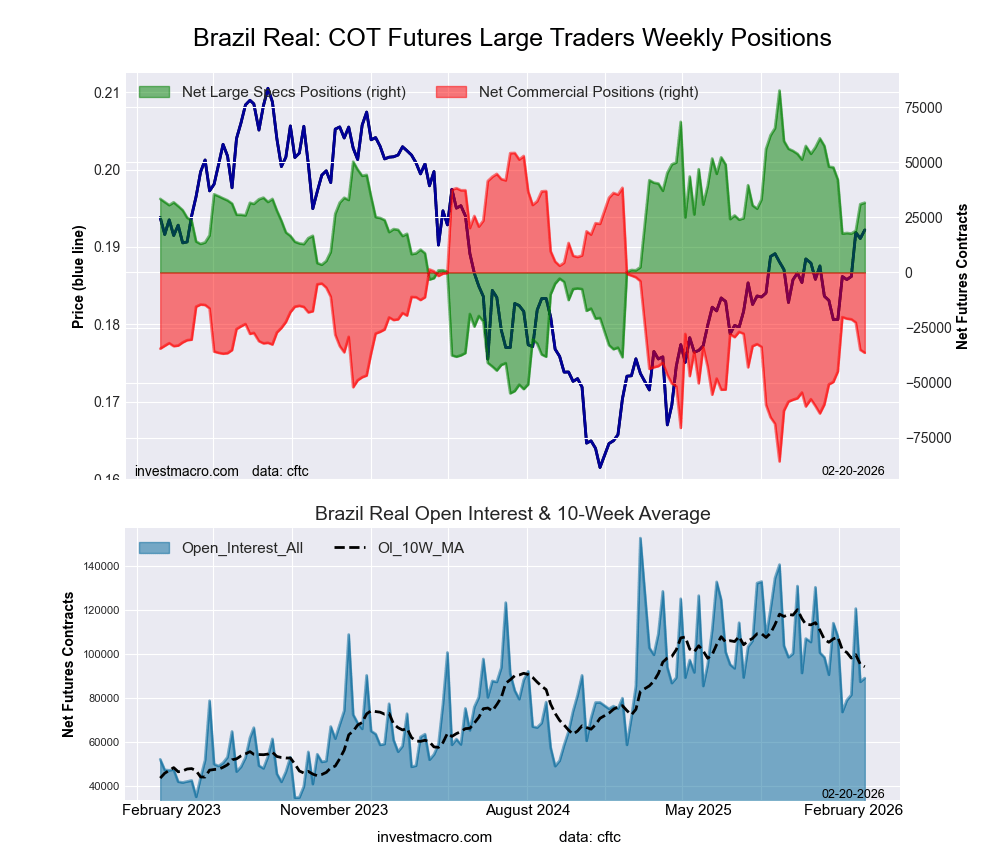
Brazil Real Futures COT ChartThe Brazilian Real large speculator standing this week reached a net position of 31,643 contracts in the data reported through Tuesday. This was a weekly gain of 681 contracts from the previous week which had a total of 30,962 net contracts.

This week’s current strength score (the trader positioning range over the past three years, measured from 0 to 100) shows the speculators are currently Bullish with a score of 63.0 percent. The commercials are Bearish with a score of 35.2 percent and the small traders (not shown in chart) are Bearish with a score of 48.1 percent.

Price Trend-Following Model: Strong Uptrend

Our weekly trend-following model classifies the current market price position as: Strong Uptrend.

BRAZIL REAL StatisticsSPECULATORSCOMMERCIALSSMALL TRADERS
– Percent of Open Interest Longs:65.627.36.1
– Percent of Open Interest Shorts:30.168.20.7
– Net Position:31,643-36,4744,831
– Gross Longs:58,39524,2715,456
– Gross Shorts:26,75260,745625
– Long to Short Ratio:2.2 to 10.4 to 18.7 to 1
NET POSITION TREND:
– Strength Index Score (3 Year Range Pct):63.035.248.1
– Strength Index Reading (3 Year Range):BullishBearishBearish
NET POSITION MOVEMENT INDEX:
– 6-Week Change in Strength Index:-7.66.111.2


Bitcoin Futures:

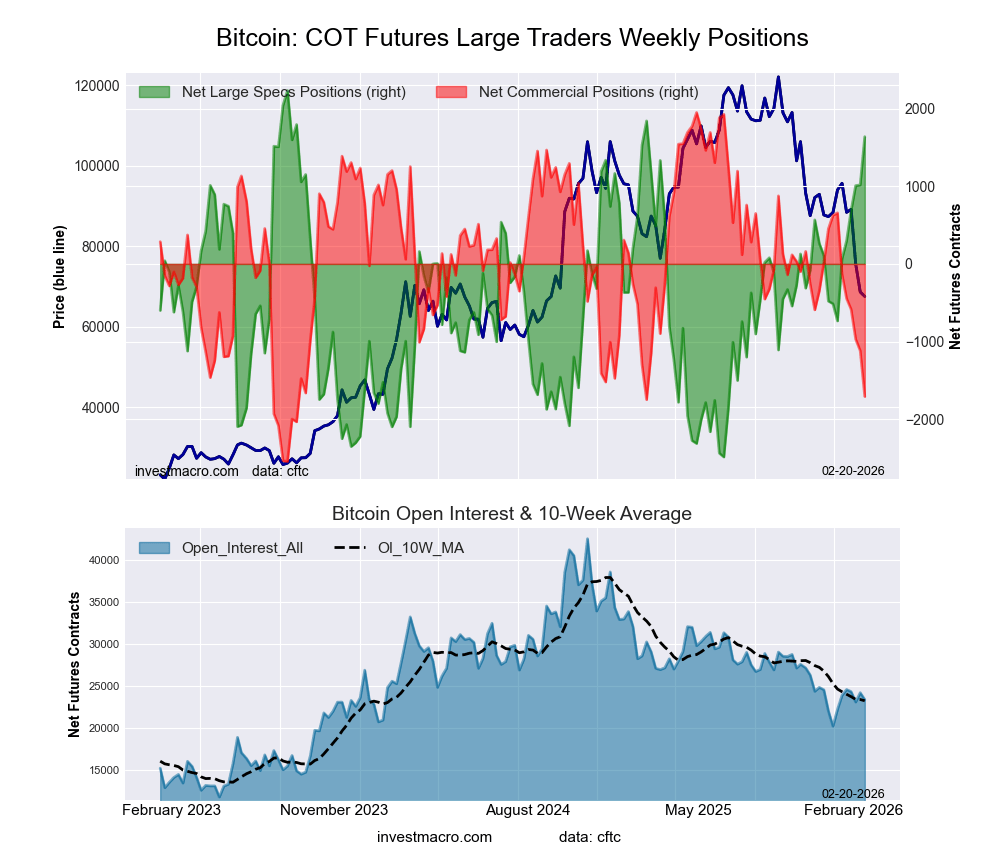
Bitcoin Crypto Futures COT ChartThe Bitcoin large speculator standing this week reached a net position of 1,638 contracts in the data reported through Tuesday. This was a weekly lift of 621 contracts from the previous week which had a total of 1,017 net contracts.

This week’s current strength score (the trader positioning range over the past three years, measured from 0 to 100) shows the speculators are currently Bullish-Extreme with a score of 87.4 percent. The commercials are Bearish-Extreme with a score of 18.6 percent and the small traders (not shown in chart) are Bearish with a score of 40.9 percent.

Price Trend-Following Model: Strong Downtrend

Our weekly trend-following model classifies the current market price position as: Strong Downtrend.

BITCOIN StatisticsSPECULATORSCOMMERCIALSSMALL TRADERS
– Percent of Open Interest Longs:71.12.05.0
– Percent of Open Interest Shorts:64.19.34.7
– Net Position:1,638-1,70769
– Gross Longs:16,5934631,163
– Gross Shorts:14,9552,1701,094
– Long to Short Ratio:1.1 to 10.2 to 11.1 to 1
NET POSITION TREND:
– Strength Index Score (3 Year Range Pct):87.418.640.9
– Strength Index Reading (3 Year Range):Bullish-ExtremeBearish-ExtremeBearish
NET POSITION MOVEMENT INDEX:
– 6-Week Change in Strength Index:50.3-52.6-0.4


Article By InvestMacroReceive our weekly COT Newsletter

*COT Report: The COT data, released weekly to the public each Friday, is updated through the most recent Tuesday (data is 3 days old) and shows a quick view of how large speculators or non-commercials (for-profit traders) were positioned in the futures markets.

The CFTC categorizes trader positions according to commercial hedgers (traders who use futures contracts for hedging as part of the business), non-commercials (large traders who speculate to realize trading profits) and nonreportable traders (usually small traders/speculators) as well as their open interest (contracts open in the market at time of reporting). See CFTC criteria here.

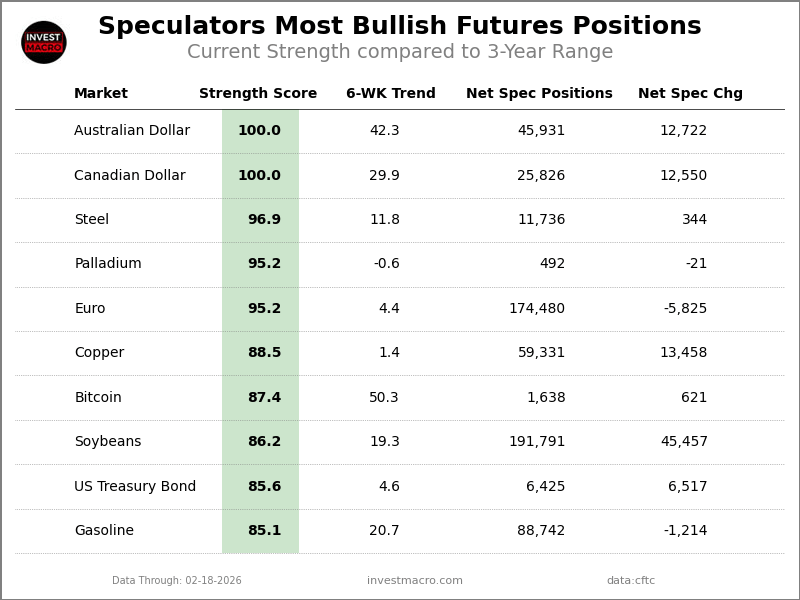
Speculator Extremes: AUD, CAD, Steel & Palladium lead weekly Bullish Positions

By InvestMacro

The latest update for the weekly Commitment of Traders (COT) report was released by the Commodity Futures Trading Commission (CFTC) on Friday for data ending on February 17th.

This weekly Extreme Positions report highlights the Most Bullish and Most Bearish Positions for the speculator category. Extreme positioning in these markets can foreshadow strong moves in the underlying market.

To signify an extreme position, we use the Strength Index (also known as the COT Index) of each instrument, a common method of measuring COT data. The Strength Index is simply a comparison of current trader positions against the range of positions over the previous 3 years. We use over 80 percent as extremely bullish and under 20 percent as extremely bearish. (Compare Strength Index scores across all markets in the data table or cot leaders table)


Extreme Bullish Speculator Table


Here Are This Week’s Most Bullish Speculator Positions:

Australian Dollar

Extreme Bullish Leader
The Australian Dollar speculator position comes in tied as the most bullish extreme standing this week as the AUD speculator level is currently at a maximum 100 percent score of its 3-year range.

The six-week trend for the speculator strength score totaled a gain of 42 percentage points this week while the overall net speculator position was a total of 45,931 net contracts this week with a boost of 12,722 contract in the weekly speculator bets.


Speculators or Non-Commercials Notes:

Speculators, classified as non-commercial traders by the CFTC, are made up of large commodity funds, hedge funds and other significant for-profit participants. The Specs are generally regarded as trend-followers in their behavior towards price action – net speculator bets and prices tend to go in the same directions. These traders often look to buy when prices are rising and sell when prices are falling. To illustrate this point, many times speculator contracts can be found at their most extremes (bullish or bearish) when prices are also close to their highest or lowest levels.

These extreme levels can be dangerous for the large speculators as the trade is most crowded, there is less trading ammunition still sitting on the sidelines to push the trend further and prices have moved a significant distance. When the trend becomes exhausted, some speculators take profits while others look to also exit positions when prices fail to continue in the same direction. This process usually plays out over many months to years and can ultimately create a reverse effect where prices start to fall and speculators start a process of selling when prices are falling.


Canadian Dollar

Extreme Bullish Leader
The Canadian Dollar speculator position comes in also tied in the extreme standings this week. The CAD speculator level is now at a maximum 100 percent score of its 3-year range.

The six-week trend for the strength score was a jump by 30 percentage points this week. The speculator position registered 25,826 net contracts this week with a weekly rise of 12,550 contracts in speculator bets.


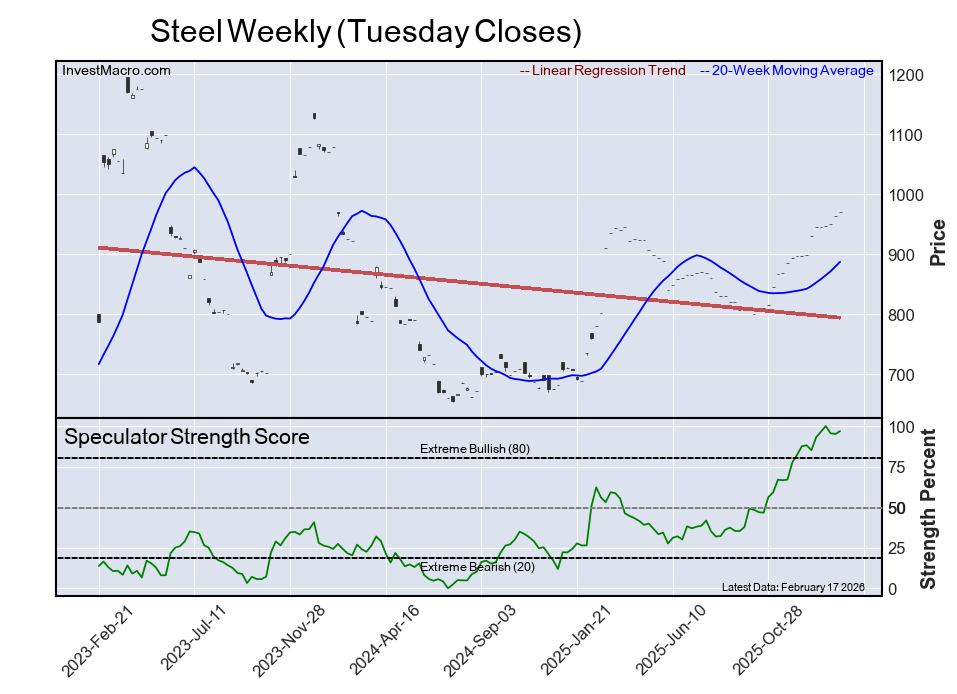
Steel

Extreme Bullish Leader
The Steel speculator position comes in third this week in the extreme standings. The Steel speculator level resides at a 97 percent score of its 3-year range.

The six-week trend for the speculator strength score came in at a gain of 12 percentage points this week. The overall speculator position was 11,736 net contracts this week with a small gain of 344 contracts in the weekly speculator bets.


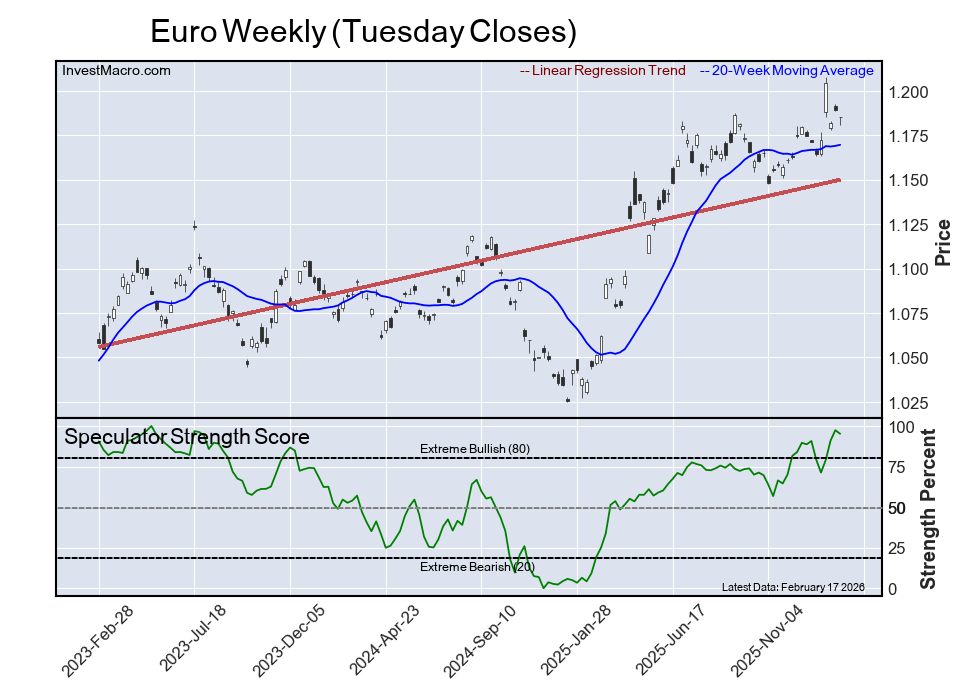
Euro

Extreme Bullish Leader
The Euro speculator position comes up number four in the extreme standings this week as the EUR speculator level resides at a 95 percent score of its 3-year range.

The six-week trend for the speculator strength score totaled a change of 4 percentage points this week with the overall speculator position sitting at 174,480 net contracts this week with a decline of -5,825 contracts in the speculator bets.


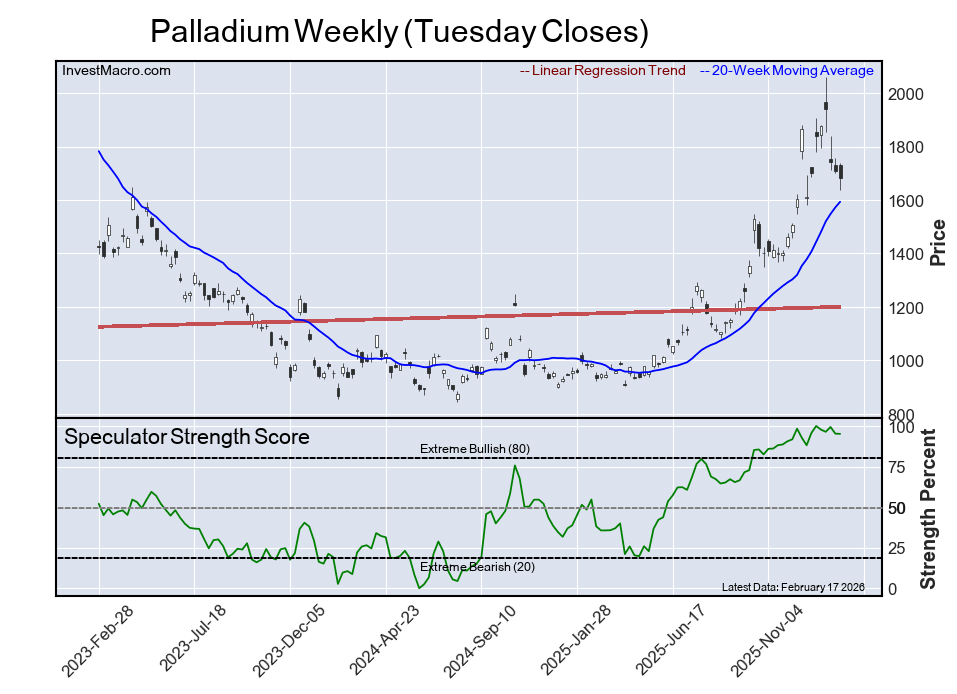
Palladium

Extreme Bullish Leader
The Palladium speculator position rounds out the top five in this week’s bullish extreme standings as the Palladium speculator level also sits at a 95 percent score of its 3-year range. The six-week trend for the speculator strength score was a dip by -1 percentage point this week.

The speculator position was 492 net contracts this week with a small edge lower by -21 contracts in the weekly speculator bets.


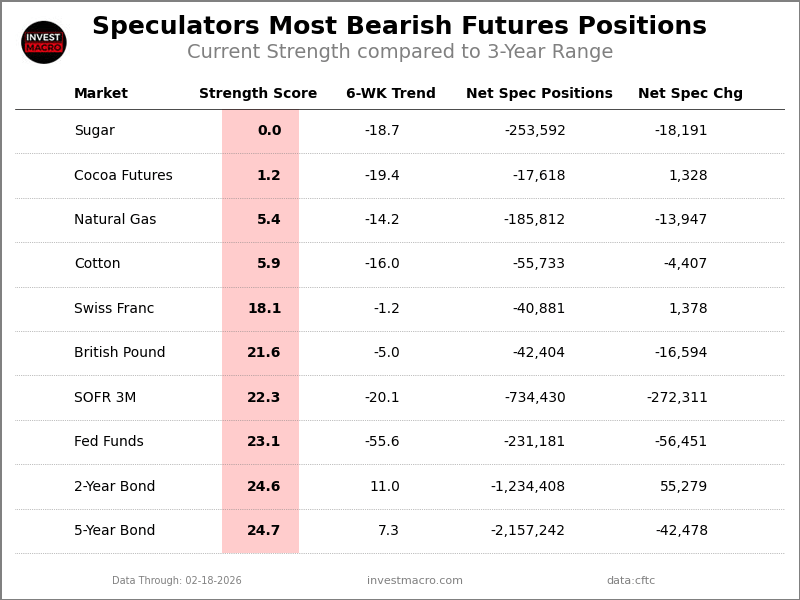
The Most Bearish Speculator Positions of the Week:

Extreme Bearish Speculator Table


Sugar

Extreme Bearish Leader
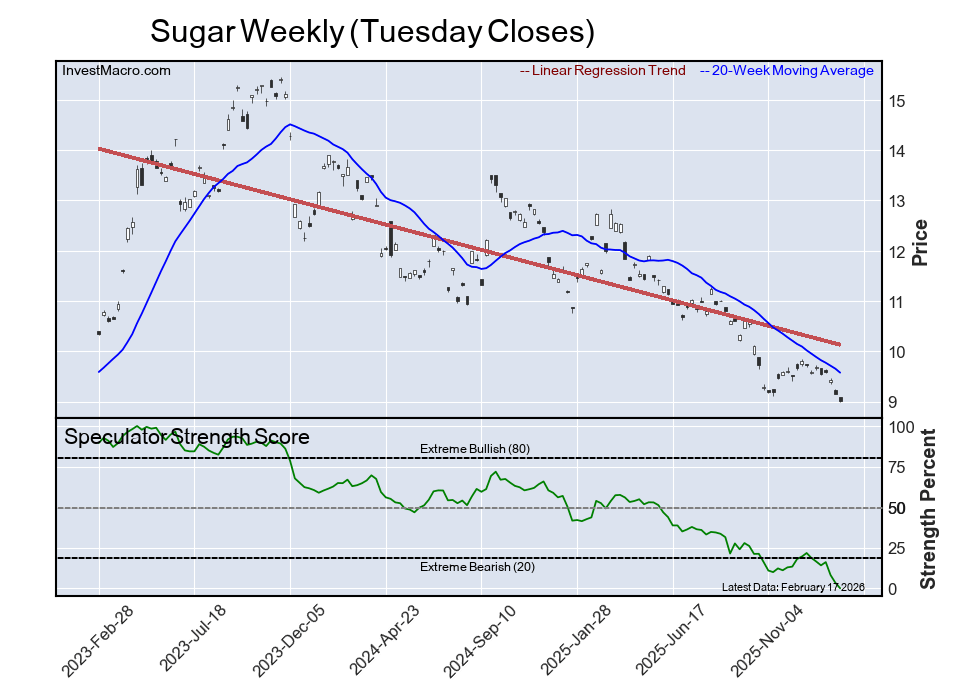
The Sugar speculator position comes in as the most bearish extreme standing this week as the Sugar speculator level is at a minimum 0 percent score of its 3-year range.

The six-week trend for the speculator strength score was a drop by -19 percentage points this week. The overall speculator position was -253,592 net contracts this week with a decline of -18,191 contracts in the speculator bets.


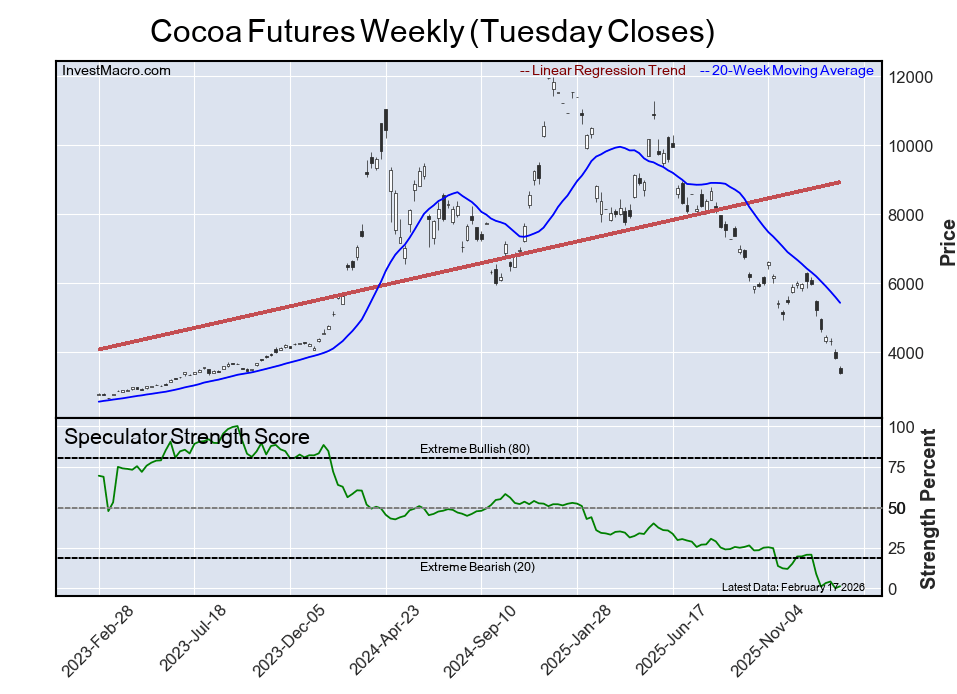
Cocoa Futures

Extreme Bearish Leader
The Cocoa Futures speculator position comes in next for the most bearish extreme standing on the week. The Cocoa speculator level is close to the bottom at a 1 percent score of its 3-year range.

The six-week trend for the speculator strength score was a slide by -19 percentage points this week while the speculator position totaled -17,618 net contracts this week following a small boost by 1,328 contracts in the weekly speculator bets.


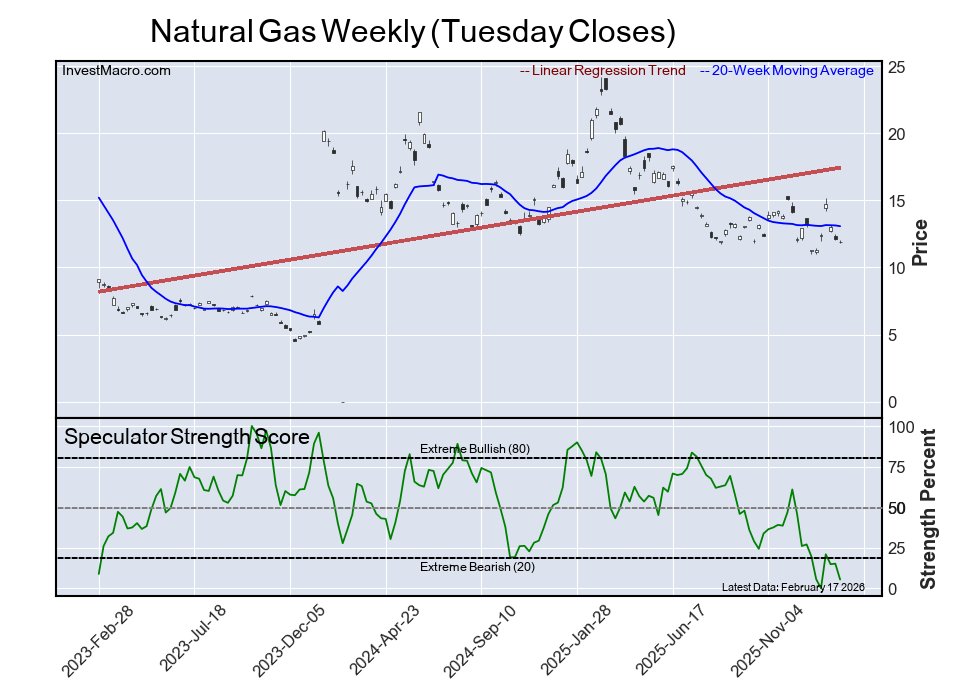
Natural Gas

Extreme Bearish Leader
The Natural Gas speculator position comes in as third most bearish extreme standing of the week as the Natural Gas speculator level resides at just a 5 percent score of its 3-year range.

The six-week trend for the speculator strength score was a reduction by -14 percentage points this week and the overall speculator position totaled -185,812 net contracts this week after a decrease of -13,947 contracts in the speculator bets.


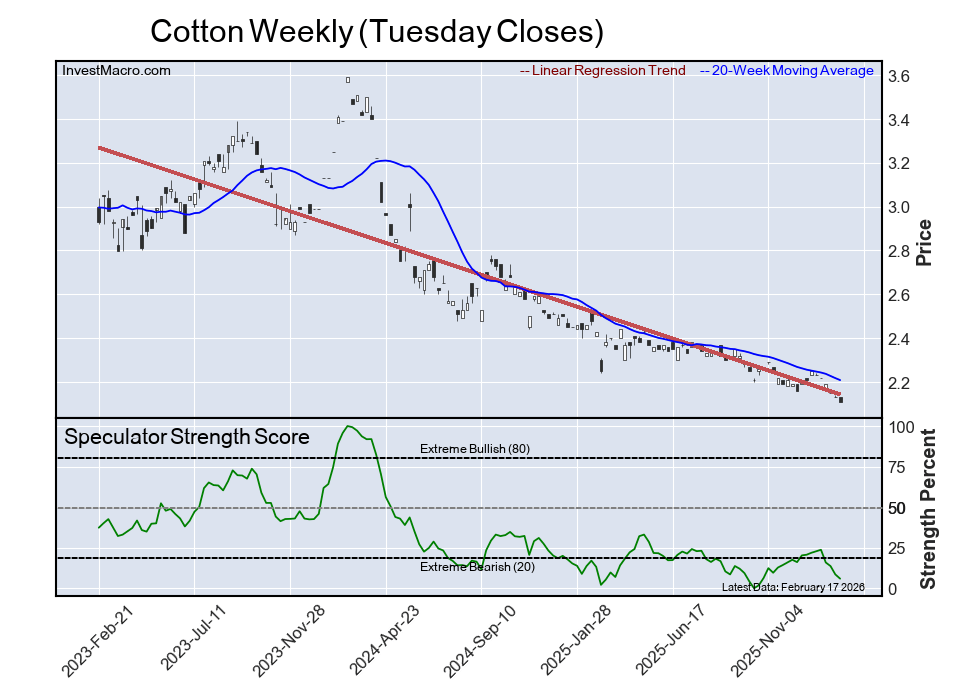
Cotton

Extreme Bearish Leader
The Cotton speculator position comes in as this week’s fourth most bearish extreme standing. The Cotton speculator level is at a 6 percent score of its 3-year range while the six-week trend for the speculator strength score was a decline by -16 percentage points this week.

The speculator position totaled -55,733 net contracts this week with a decrease by -4,407 contracts in the weekly speculator bets.


Swiss Franc

Extreme Bearish Leader
Next, the Swiss Franc speculator position comes in as the fifth most bearish extreme standing for this week with the CHF speculator level residing at a 18 percent score of its 3-year range.

The six-week trend for the speculator strength score was a small dip by -1 percentage points this week and the speculator position totaled -40,881 net contracts this week following an increase of 1,378 contracts in the weekly speculator bets.


Article By InvestMacroReceive our weekly COT Newsletter

*COT Report: The COT data, released weekly to the public each Friday, is updated through the most recent Tuesday (data is 3 days old) and shows a quick view of how large speculators or non-commercials (for-profit traders) were positioned in the futures markets.

The CFTC categorizes trader positions according to commercial hedgers (traders who use futures contracts for hedging as part of the business), non-commercials (large traders who speculate to realize trading profits) and nonreportable traders (usually small traders/speculators) as well as their open interest (contracts open in the market at time of reporting). See CFTC criteria here.

Probability underlies much of the modern world – an engineering professor explains how it actually works

By Zachary del Rosario, Olin College of Engineering 

Probability underpins AI, cryptography and statistics. However, as the philosopher Bertrand Russell said, “Probability is the most important concept in modern science, especially as nobody has the slightest notion what it means.”

I teach statistics to engineers, so I know that while probability is important, it is counterintuitive.

Probability is a branch of mathematics that describes randomness. When scientists describe randomness, they’re describing chance events – like a coin flip – not strange occurrences, like a person dressed as a zebra. While scientists do not have a way to predict strange occurrences, probability does predict long-run behavior – that is, the trends that emerge from many repeated events.

Left: A person in a zebra costume. Right: A coin in mid-air after being flipped. A hand is visible with thumb extended upward.
We may say ‘random’ to describe strange occurrences (person dressed as zebra), but probability describes chance events (a coin flip).
Zebras in La Paz, Bolivia by EEJCC, Own Work CC A-SA 4.0; https://commons.wikimedia.org/wiki/File:Zebra_La_Paz.jpg _ , CC BY-SA

Modeling with probability

Since probability is about events, a scientist must choose which events to study. This choice defines the sample space. When flipping a coin, for example, you might define your event as the way it lands.

Coins almost always land on heads or tails. However, it’s possible – if very unlikely – for a coin to land on its side. So to create a sample space, you’d have two choices: heads and tails, or heads, tails and side. For now, ignore the side landings and use heads and tails as our sample space.

Next, you would assign probabilities to the events. Probability describes the rate of occurrence of an event and takes values between 0% and 100%. For example, a fair flip will tend to land 50% heads up and 50% tails up.

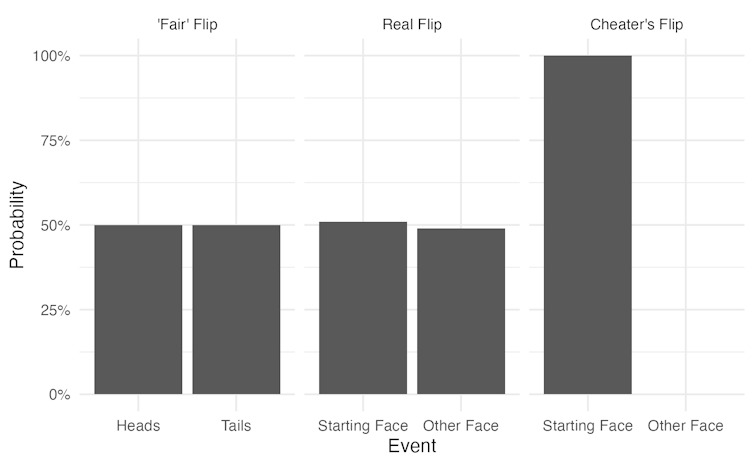
To assign probabilities, however, you need to think carefully about the scenario. What if the person flipping the coin is a cheater? There’s a sneaky technique to “wobble” the coin without flipping, controlling the outcome. Even if you can prevent cheating, real coin flips are slightly more probable to land on their starting face – so if you start the flip with the coin heads up, it’s very slightly more likely to land heads up.

In both the cheating and real flip cases, you need an appropriate sample space: starting face and other face. To have a fair flip in the real world, you’d need an additional step where you randomly – with equal probability – choose the starting face, then flip the coin.

Three bar graphs displaying probabilities for different outcomes. The 'Fair' Flip assigns equal probability (50%) to both heads and tails. The Real Flip assigns 51% to the Starting Face and 49% to the Other Face. The Cheater's Flip assigns 100% to the Starting Face.
The probabilities for different coin-flipping scenarios.
Zachary del Rosario, CC BY-SA

These assumptions add up quickly. To have a fair flip, you had to ignore side landings, assume no one is cheating, and assume the starting face is evenly random. Together, these assumptions constitute a model for the coin flip with random outcomes. Probability tells us about the long-run behavior of a random model. In the case of the coin model, probability describes how many coins land on heads out of many flips.

But instead of using a random model, why not just solve the coin toss using physics? Actually, scientists have done just that, and the physics shows that slight changes in the speed of the flip determine whether it comes up heads or tails. This sensitivity makes a coin flip unpredictable, so a random model is a good one.

Frequency vs. probability

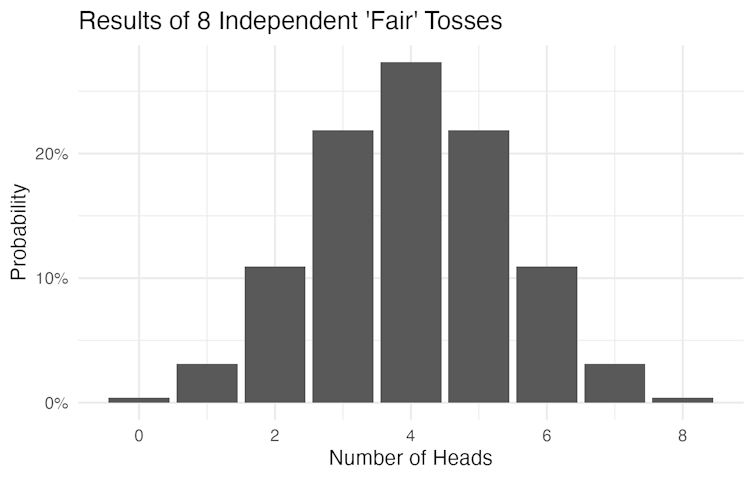
Probability differs from frequency, which is the rate of events in a sequence. For example, if you flip a coin eight times and get two heads, that’s a frequency of 25%. Even if the probability of flipping a coin and seeing heads is 50% over the long run, each short sequence of flips will come out different. Four heads and four tails is the most probable outcome from eight flips, but other events can – and will – happen.

Frequency and probability are the same in one special setting: when the number of data points goes to infinity. In this sense, probability tells us about long-run behavior.

A bar chart of probabilities for all possible outcomes of eight 'fair' coin flips. Four heads has the highest probability (~27%), and the distribution is symmetric around four heads.
Probabilities for all possible outcomes of eight ‘fair’ coin flips.
Zachary del Rosario, CC BY-SA

Applications to AI, cryptography and statistics

Probability isn’t just useful for predicting coin flips. It underlies many modern technological systems.

For example, AI systems such as large language models, or LLMs, are based on next-word prediction. Essentially, they compute a probability for the words that follow your prompt. For example, with the prompt “New York” you might get “City” or “State” as the predicted next word, because in the training data those are the words that most frequently follow.

But since probability describes randomness, the outputs of a LLM are random. Just like a sequence of coin flips is not guaranteed to come out the same way every time, if you ask an LLM the same question again, you will tend to get a different response. Effectively, each next word is treated like a new coin flip.

Randomness is also key to cryptography: the science of securing information. Cryptographic communication uses a shared secret, such as a password, to secure information. However, surprising randomness isn’t good enough for security, which is why picking a surprising word is a bad choice of password. A shared secret is only secure if it’s hard to guess. Even if a word is surprising, real words are easier to guess than flipping a “coin” for each letter.

You can make a much stronger password by using probability to choose characters at random on your keyboard – or better yet, use a password manager.

Finally, randomness is key in statistics. Statisticians are responsible for designing and analyzing studies to make use of limited data. This practice is especially important when studying medical treatments, because every data point represents a person’s life.

The gold standard is a randomized controlled trial. Participants are assigned to receive the new treatment or the current standard of care based on a fair coin flip. It may seem strange to do this assignment randomly – using coin flips to make decisions about lives. However, the unpredictability serves an important role, as it ensures that nothing about the person affects their chance to get the treatment: not age, gender, race, income or any other factor. The unpredictability helps scientists ensure that only the treatment causes the observed result and not any other factor.

So what does probability mean? Like any kind of math, it’s only a model, meaning it can’t perfectly describe the world. In the examples discussed, probability is useful for describing long-term behaviors and using unpredictability to solve practical problems.The Conversation

About the Author:

Zachary del Rosario, Assistant Professor of Engineering, Olin College of Engineering

This article is republished from The Conversation under a Creative Commons license. Read the original article.


The Arsenal Beneath Our Feet: Inside the US Defense Industrial Base Consortium

Source: Jason Williams (2/17/26) 

America is rebuilding its defense supply chain from the ground up, and a select group of mining companies now sits at the center of national security.

For decades, the U.S. defense conversation focused on jets, missiles, ships, and software — the visible hardware of military might.

What almost nobody talked about was the industrial engine underneath it all…

The Quiet Machine Behind American Power

The mines, processors, refiners, manufacturers, and logistics chains that turn rocks in the ground into weapons, infrastructure, and strategic leverage.

But that engine now has a name that’s finally entering the public conversation: the U.S. Defense Industrial Base Consortium.

At its core, the Consortium exists to strengthen, coordinate, and secure the Defense Industrial Base — often shortened to the DIB.

You can think of it as the full ecosystem of companies that supply materials, components, technology, and production capacity essential to U.S. national defense.

This includes not just traditional defense contractors, but the upstream producers that make everything else possible.

And in today’s geopolitical reality, upstream means minerals.

Why Washington Suddenly Cares About Where Materials Come From

For years, globalization made supply chains cheap, efficient, and fragile. Critical inputs were sourced wherever costs were lowest, often from geopolitical rivals.

That worked… until it didn’t.

Trade wars, sanctions, hot conflicts, cyber warfare, and industrial espionage exposed a dangerous truth…

The U.S. military cannot be stronger than its weakest supply chain link.

When rare earths, uranium, silver, or specialty metals come from hostile or unstable jurisdictions, national security becomes a hostage to foreign policy.

The Defense Industrial Base Consortium was built to fix that problem.

Its mission isn’t flashy, but it’s existential…

Identify vulnerabilities, coordinate domestic capacity, accelerate permitting and production, and align private companies with national defense priorities long before a crisis hits.

This isn’t about hypothetical future wars. It’s about readiness — today.

Why Membership Is a Strategic Asset, not a Press Release

For companies inside the Consortium’s orbit, participation is far more than symbolic…

It acts as a signal flare to Washington, the Pentagon, and capital markets that a company is strategically relevant.

Membership opens doors to federal coordination, long-term procurement visibility, and policy alignment that non-members simply don’t get.

It also places companies inside the conversation when rules are written around permitting reform, domestic sourcing mandates, stockpiling programs, and defense funding priorities.

In plain English, Consortium-aligned companies stop being “just another miner” or manufacturer. They become infrastructure.

That distinction matters when governments are deciding who gets funding, who gets fast-tracked, and who becomes indispensable.

And that brings us to a new and very important development: mining companies are now stepping into the defense spotlight.

Apollo Silver Corp: Silver as a Strategic Metal Again

One of the more interesting names to emerge in this shift is Apollo Silver Corp. (APGO:TSX.V; APGOF:OTCQB).

Silver rarely gets framed as a defense metal in popular discourse, but it absolutely should.

It is critical to advanced electronics, missile guidance systems, secure communications, solar-powered defense infrastructure, and a growing range of aerospace and energy applications.

Modern warfare is digital, electrified, and sensor-dense — and silver sits at the center of that reality.

Apollo Silver’s alignment with the Defense Industrial Base Consortium reflects a broader recognition that precious metals are no longer just financial hedges or industrial afterthoughts.

They’re strategic inputs.

Domestic silver supply, especially from stable U.S. jurisdictions, reduces exposure to foreign bottlenecks at a time when defense systems are becoming more metal-intensive, not less.

This is silver growing up. And investors who still think of it as a shiny relic are missing the plot.

MP Materials: Rare Earths, Real Power

If Apollo Silver represents the rediscovery of an old strategic metal, MP Materials Corp. (MP:NYSE) represents the hard lesson of losing an entire supply chain.

Rare earth elements are essential to fighter jets, precision-guided munitions, radar systems, drones, and electric propulsion.

For years, the U.S. outsourced this capability almost entirely. The result was a near-total dependence on China for materials that underpin modern warfare.

While it’s yet to become an official member, MP Materials and its government investment reflects a national effort to reverse that mistake.

By rebuilding domestic mining, processing, and magnet production capacity, MP isn’t just supplying materials — it’s restoring strategic autonomy.

This is what “onshoring” looks like when it actually matters. Not slogans. Capacity.

Energy Fuels: Nuclear Security Starts at the Mine

The third pillar in this emerging defense-miner alignment is Energy Fuels Inc. (EFR:TSX; UUUU:NYSE.American).

Nuclear energy sits at a strange intersection of civilian infrastructure and national defense.

Uranium fuels power grids, but it also underpins naval propulsion, deterrence credibility, and long-term strategic stability.

A nation that cannot secure its nuclear fuel cycle cannot fully secure its defense posture.

Energy Fuels’ participation in Defense Industrial Base initiatives reflects a recognition that uranium independence is not optional. It is foundational…

From fueling reactors to supporting advanced nuclear technologies, domestic uranium production is a national security imperative hiding in plain sight.

This is less about profits next quarter and more about sovereignty next decade.

The Bigger Picture Most Investors Are Missing

Here’s the part the market is still slow to price in…

The Defense Industrial Base Consortium represents a structural shift in how America thinks about industry.

Efficiency is no longer king. Resilience is. Redundancy is. Domestic capacity is.

That shift doesn’t happen overnight, but once it starts, it doesn’t reverse easily…

Defense supply chains are sticky. Relationships last decades. Contracts roll forward. Strategic suppliers become embedded.

For investors, that means something profound…

Companies aligned with national defense priorities often enjoy longer runways, stronger political tailwinds, and a margin of safety that purely commercial players don’t.

Apollo Silver, MP Materials, and Energy Fuels aren’t just operating in hot commodity markets. They’re operating in markets that Washington has decided it cannot afford to lose.

And historically, when that happens, capital follows policy.

This Isn’t a Trade—It’s a Theme

Let’s call this what it is…

The Defense Industrial Base is being rebuilt in real time, under pressure, with urgency. The Consortium is the connective tissue making that rebuild possible.

Mining companies inside this orbit are no longer background players. They are strategic assets.

The smartest investors won’t wait until everyone else starts calling these companies “defense stocks.”

By then, the easy money is gone.


Important Disclosures:

  1. As of the date of this article, officers, contractors, shareholders, and/or employees of Streetwise Reports LLC (including members of their household) own securities of Energy Fuels Inc.
  2. Jason Williams: I, or members of my immediate household or family, own securities of: Apollo Silver Corp. My company has a financial relationship with: None. My company has purchased stocks mentioned in this article for my management clients: None. I determined which companies would be included in this article based on my research and understanding of the sector.
  3. Statements and opinions expressed are the opinions of the author and not of Streetwise Reports, Street Smart, or their officers. The author is wholly responsible for the accuracy of the statements. Streetwise Reports was not paid by the author to publish or syndicate this article. Streetwise Reports requires contributing authors to disclose any shareholdings in, or economic relationships with, companies that they write about. Any disclosures from the author can be found  below. Streetwise Reports relies upon the authors to accurately provide this information and Streetwise Reports has no means of verifying its accuracy.
  4.  This article does not constitute investment advice and is not a solicitation for any investment. Streetwise Reports does not render general or specific investment advice and the information on Streetwise Reports should not be considered a recommendation to buy or sell any security. Each reader is encouraged to consult with his or her personal financial adviser and perform their own comprehensive investment research. By opening this page, each reader accepts and agrees to Streetwise Reports’ terms of use and full legal disclaimer. Streetwise Reports does not endorse or recommend the business, products, services or securities of any company.

For additional disclosures, please click here.

Week In Review: Brent rallies, hawkish Fed minutes, US PCE in focus

By ForexTime 

  • Mixed week for equities due to lack of catalyst
  • Brent hits $71 on geopolitical risk
  • Hawkish Fed minutes hit rate cut bets
  • Gold on standby ahead of US PCE

It has been a relatively quiet week for markets due to the absence of any significant fundamental drivers.

US equities got off to a slow start due to the public holiday on Monday, while Chinese markets were closed all week thanks to the Lunar New Year. Lingering worries over the outlook for artificial intelligence promoted some volatility, but this was nothing special compared to previous weeks.

Yesterday evening, the Fed minutes showed several officials suggesting the central bank may need to raise rates if inflation remains stubbornly high. With only two dissenters favoring a cut and no indications of further easing, this shaved Fed cut bets for 2026.

Before the meeting, traders were pricing a 50% chance of three Fed cuts this year; this figure had dipped to under 30%.

In response, the dollar gained with FXTM’s DXY punching above 97.70.

Prices are turning bullish on the daily charts with a solid breakout above 98.00, opening a path toward the 200-day and 10-day SMA.

Looking at commodities, oil extended its biggest daily jump since October amid mounting geopolitical risk. Growing concerns around the US and Iran sinking deeper into a fresh conflict sparked fears around supply.

Brent touched $71 a barrel on Wednesday after rallying over 4% on Wednesday. Oil benchmarks have gained over 15% year-to-date, with the risk of conflict pushing prices higher.

Indeed, a potential war in the region that pumps about a third of the world’s oil could result in major supply disruptions – boosting oil prices.

It’s been a flat week for gold with prices hovering around $5000. The precious metal seems to be waiting for the incoming US PCE/GDP combo which may shape Fed cut bets. A strong breakout above $5000 may open a path toward $5100. Weakness below $5000 could see prices test $4900.


Forex-Time-LogoArticle by ForexTime


ForexTime Ltd (FXTM) is an award winning international online forex broker regulated by CySEC 185/12 www.forextime.com

AI Agent Firm With Payments Technology Expands Into Texas, New Jersey

Source: Streetwise Reports (2/17/26)

The FUTR Corp. (FTRC:TSX; FTRCF:OTC) announces it has signed agreements with four new dealerships, expanding the reach of its FUTR Payments product into Houston, Texas, and further strengthening its presence in New Jersey. Find out why one analyst says the company is uniquely positioned to take advantage of this “pivotal moment” in the history of AI.

The FUTR Corp. (FTRC:TSX; FTRCF:OTC) announced that it has signed agreements with four new auto dealerships, expanding the reach of its FUTR Payments product into Houston, Texas, and further strengthening its presence in New Jersey, according to a February 17 release from the company.

FUTR is the creator of the FUTR Agent App, which allows users to store, manage, access, and monetize their personal information and make real-time payments.

AI agents were at the center of what “is shaping up to be one of the most audacious branding plays in the history of the internet,” a new US$70 million mega deal for the domain name AI.com announced during last weekend’s Super Bowl.

The signed agreements mark FUTR Payments’ first dealer relationship in Texas and are the initial results of the company’s newly deployed sales resources aimed at geographic expansion and reinforcing its presence in existing markets. With these agreements, FUTR Payments’ U.S. footprint now includes Texas, New York, New Jersey, Delaware, Florida, Iowa, and Connecticut.

These initial dealership partnerships are expected to serve as reference points as FUTR Payments continues to grow its presence in U.S. regional markets. The company said it plans to provide future updates as more dealerships, dealer groups, and regions join the platform.

“Expanding our footprint in New Jersey and entering the Texas market represent an important inflection point for FUTR Payments as we scale our platform across major U.S. markets,” said FUTR Payments Chief Business Officer Mindy Bruns. “These early dealership partnerships validate the demand we’re seeing for intelligent payment infrastructure that helps consumers build financial security while enabling dealers to engage customers in more durable, data-driven ways. We believe this expansion is an early indicator of the broader national opportunity ahead.”

Texas is one of the largest and most diverse automotive markets in the United States, with a significant concentration of independent and used-vehicle dealerships. Trailer Wheel & Frame Co., the company’s first Houston dealer, introduces a new asset category for FUTR Payments, expanding the applicability of its intelligent payment rails beyond traditional automotive inventory. The newly signed agreement with Speedway Motors LLC in Paterson, N.J., further expands the company’s presence in New Jersey by adding three more storefronts.

FUTR Payments is part of FUTR’s broader strategy, which combines intelligent payment infrastructure with consented consumer data and AI-enabled Agents.

Analyst: A ‘Pivotal Moment’ in AI Marketing

According to an updated research note by Research Capital Corp. Analyst Greg McLeish on February 11, “This year’s Super Bowl marked a pivotal moment in how artificial intelligence is being marketed to consumers.”

AI-related advertising has emerged as a key theme, illustrating how quickly AI has transitioned from an abstract concept to a mainstream consumer offering, Business Insider reported. The focus has shifted from chatbots to utility-driven AI systems that can perform tasks on behalf of users. In this context, Crypto.com’s launch of AI.com garnered significant attention and traffic, highlighting the growing interest in “AI agents that do things,” rather than systems that merely respond to prompts. Additionally, OpenClaw’s viral success in late January provided further validation, showing that autonomous, task-executing agents are gaining traction across both consumer platforms and developer communities. These developments indicate that AI agents are becoming mainstream as everyday utilities, rather than novelty tools.

“Crypto.com’s Super Bowl debut of AI.com reinforced that AI agents are moving decisively beyond experimental chat interfaces into mass-market, action-oriented tools,” McLeish wrote. “By committing roughly US$70 million for the AI.com domain and positioning its product as a ‘private AI agent,’ the company highlighted a shift toward autonomous digital assistants capable of managing schedules, automating workflows, and completing tasks on behalf of users. Post-game traffic reportedly overwhelmed early infrastructure, reinforcing strong initial engagement and signaling that consumer adoption is increasingly driven by execution rather than conversation.”

While recent agent launches validate the rising demand for autonomous AI, many early entrants lack the infrastructure needed for durable, real-world deployment, the analyst said.

“The FUTR Corp. is differentiated by anchoring its AI Agent in a SOC 2–compliant digital vault and embedding it directly into regulated financial workflows,” McLeish wrote. “FUTR’s platform combines compliance-grade data infrastructure, live banking and payment rails, and enterprise integrations that allow an agent not only to recommend actions, but to execute them securely across payments, credit, insurance, and home finance. Unlike consumer-facing agents that rely on generic cloud access, or open-source solutions that place security and operational burdens on the user, FUTR’s agent operates within institutional guardrails and is distributed through enterprise partnerships.”

McLeish continued, “In our view, this positions FUTR as an AI-native financial infrastructure layer, rather than a chatbot alternative, as agents move from novelty to necessity.”

Research Capital Corp. maintained its Speculative Buy rating on the stock with a CA$3 target price, a 991% return based on a sum-of-the-parts valuation taken at the time of writing.

“The result is a high-conviction opportunity at the intersection of consumer data, tokenized incentives, and privacy-first infrastructure,” McLeish said.

Most Expensive Domain Purchase in History

The US$70 million acquisition of AI.com by Crypto.com founder Kris Marszalek marks the most expensive domain purchase in history, paid entirely in cryptocurrency to an undisclosed seller, as reported by the Financial Times and covered by Connie Loizos for TechCrunch on February 8. This transaction sets a new standard in domain sales, surpassing previous record holders such as CarInsurance.com at US$49.7 million (2010), VacationRentals.com at US$35 million (2007), and Voice.com at US$30 million (2019).

In a letter to shareholders following the announcement, Alex McDougall, CEO of The FUTR Corp. (FTRC:TSX; FTRCF:OTC), stated that this acquisition “officially marks the beginning of functional AI Agents going mainstream.”

McDougall expressed the belief that this will become “the largest category the world has ever seen and as foundational as the advent of the internet.” He emphasized that FUTR is “ideally positioned to be at the front of the wave that is here.”

McDougall outlined the company’s progress: “We have set up the infrastructure in Q2, built the technology stack through Q3, signed the first wave of commercial partnerships through Q4, and now in Q1 it’s coming to market and the timing couldn’t be better” for FUTR’s agent. The company’s agent offers significant real-world utility, such as rewarding users for taking a picture of their property tax slip, knowing when those taxes are due, helping reserve cash flow in the budget to pay the tax, reminding users 15 days before the due date, comparing property taxes to other neighborhoods and home values, making the payment, and even reporting the payment to credit bureaus to maximize credit scores.

“That’s deep real-world utility,” McDougall said.

AI Agents Tailored to Your Data

According to FUTR, the AI agent within their app is not only easily accessible but also operates under your guidance, tailored specifically to your data. This AI is designed for individuals and works exclusively for you around the clock to accomplish your tasks. It integrates data from various sources and smoothly handles complex financial queries and services. “Chat GPT can find you information. It can order you food. It can do things in your browser,” McDougall told Streetwise Reports. But “FUTR can take your insurance policy, tell you where it’s good, where it’s bad, and find you a better one from our curated brand partners. If you put your mortgage into it, FUTR can read it, learn about it, tell you what clauses are suspect, find a better payment schedule for you, and then actually connect to payment rails and make those payments for you to take that intelligence and turn it into real action.”

For renters, FUTR could track when to renew your lease and report your rent payments to the credit bureau to help build your credit. “That’s really a key differentiator,” McDougall said. “There are a lot of AI agents that can tell you things. FUTR can go and do things for you.”

In a unique feature, FUTR tokens, created by the FUTR Foundation on the BASE Blockchain that powers the FUTR ecosystem, reward consumers and enterprises with tokens for sharing data, which they can use to purchase goods and services from FUTR brand partners. “Brands can purchase FUTR tokens or earn them from consumers and use those tokens to pay for leads from FUTR,” the company stated on its website.

According to the company, upcoming catalysts that could impact the stock price include the broad launch of the FUTR AI Agent App and FUTR Token sometime this quarter. The company also plans to introduce a FUTR Visa card.

The Catalyst: ‘Your Person For Everything’

According to the company, FUTR’s agent “can be your person for everything,” as McDougall explained. Unlike Chat GPT, which is designed for billions and processes data in a generalized way, the FUTR AI creates a personalized AI stack for each user, which the company refers to as “high fidelity AI.” A key advantage is that instead of your data being monetized without your knowledge, “every piece of data that goes into this agent and into this engine, you’re getting paid for it,” he said.

AI-powered shopping, with agents like FUTR’s acting on our behalf, signifies a major shift in the marketplace, according to a report by McKinsey & Co. This development points to a future where AI anticipates consumer needs, explores shopping options, negotiates deals, and completes transactions, all aligned with human intentions but operating independently through multistep processes enabled by reasoning models.

“This isn’t just an evolution of e-commerce,” the report stated. “It’s a rethinking of shopping itself in which the boundaries between platforms, services, and experiences give way to an integrated intent-driven flow, through highly personalized consumer journeys that deliver a fast, frictionless outcome.”

Streetwise Ownership Overview*

Insiders and Management: 23%
Share Structure as of 2/3/2026

By 2030, the U.S. B2C retail market alone could see up to US$1 trillion in orchestrated revenue from agentic commerce, with global estimates ranging from US$3 trillion to US$5 trillion, according to McKinsey research. This trend is expected to have an impact comparable to previous web and mobile-commerce revolutions, but it could progress even more rapidly since agents can navigate the same digital paths to purchase as humans, effectively “riding on the rails” established by these earlier transformations, researchers noted.

“This presents both benefits and risks for today’s commerce ecosystem,” McKinsey explained. “All kinds of businesses — brands, retailers, marketplaces, logistics and commerce services providers, and payments players — will need to adapt to the new paradigm and successfully navigate the challenges of trust, risk, and innovation.”

Ownership and Share Structure1

Approximately 23% of the company is owned by management and insiders. The remainder is held by retail investors.

Top shareholders include G. Scott Paterson with 8.38%, Melrose Ventures LLC with 2.08%, Michael Hillmer with 0.74%, Ashish Kapoor with 0.55%, and Jason G. Ewart with 0.52%.

The company’s market cap on February 12 was CA$35.1 million with 125.36 million shares outstanding. It trades within a 52-week range of CA$0.09 and CA$0.42.


Important Disclosures:

  1. The FUTR Corp. is a billboard sponsor of Streetwise Reports and pays SWR a monthly sponsorship fee between US$3,000 and US$6,000.
  2. As of the date of this article, officers, contractors, shareholders, and/or employees of Streetwise Reports LLC (including members of their household) own securities of The FUTR Corp.
  3. Steve Sobek wrote this article for Streetwise Reports LLC and provides services to Streetwise Reports as an employee.
  4. This article does not constitute investment advice and is not a solicitation for any investment. Streetwise Reports does not render general or specific investment advice and the information on Streetwise Reports should not be considered a recommendation to buy or sell any security. Each reader is encouraged to consult with his or her personal financial adviser and perform their own comprehensive investment research. By opening this page, each reader accepts and agrees to Streetwise Reports’ terms of use and full legal disclaimer. Streetwise Reports does not endorse or recommend the business, products, services or securities of any company.

For additional disclosures, please click here.

1. Ownership and Share Structure Information

The information listed above was updated on the date this article was published and was compiled from information from the company and various other data providers.