Archive for Metals – Page 7

XAGUSD: Hits fresh 11-year high above $32

By ForexTime 

  • Silver ↑ 33% year-to-date
  • One of the best-performing major commodities
  • Relatively “cheap” compared to gold
  • Bullish on D1 but RSI overbought

Gold is not the only metal delivering glittering returns this year…

Silver has also been on a tear, soaring to its highest level in more than a decade.

The precious metal punched above $32 this week, and is currently up 33% since the start of 2024. 

When compared with year-to-date gains of:

  • Tin: 35%

  • Copper: 31%

  • Nickel: 30%

  • Gold: 17%

  • Zinc: 17%

  • Platinum: 6%

Silver is the second-best performer in the metal space and one of the top gainers in the wider commodity arena.

Why is silver soaring?

Various forces have propelled the precious metal higher – ranging from growing investor interest to macroeconomic forces and supply-side factors, among other themes.

But gold’s bullish momentum has also provided silver ample support.

Gold hit fresh all-time highs this week due to geopolitical risks with central bank buying and prospects of lower US interest rates keeping bulls in power.

Silver often follows gold’s lead, with interest rate expectations impacting appetite for non-yielding assets like precious metals.

To put things into perspective, silver and gold have moved in tandem over 80% of the time in any given 10-day period over the past 20 years.

What other forces are in play?

Beyond the macroeconomic forces, silver is also influenced by industrial demand.

Given how it’s a key component for clean energy technologies, the usage of the metal is expected to reach records in 2024 amid robust growth in the industry.

Interestingly, copper which is also a crucial element in the creation of solar panels, wind turbines and hydro systems has also reached all-time highs.

It does not end here…

Silver markets are heading for their fourth consecutive year of shortages.

According to the Silver Institute, the precious metal is expected to experience its second-highest deficit on record in 2024. As demand continues to outpace supply of silver, the deficit is forecast to increase by 17% this year amid robust industrial consumption.

Can silver push higher?

When considering all the bullish fundamentals at play, further upside could be on the cards.

But most importantly, silver is still considered relatively cheap compared to gold.

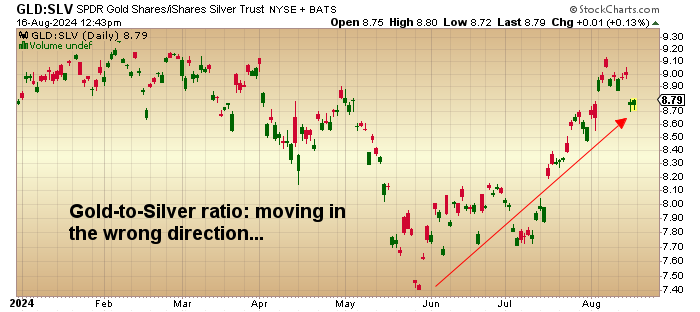
Looking at the gold-silver ratio, it takes around 76 ounces of silver to buy 1 ounce of gold.

Given how the 20-year average is 68, silver has scope to extend gains if the ratio rebalances down the road.

Technical outlook:

Silver is firmly bullish on the daily timeframe as there have been consistently higher highs and higher lows.

Prices are trading above the 50, 100 and 200-day SMA while the MACD above zero. However, the Relative Strength Index (RSI) is above 70 – indicating that prices are heavily overbought.

  • A solid breakout above $32.50 will open doors to fresh all-time highs with the next level of interest rate $33.00.
  • Sustained weakness below $32.50 may encourage a decline toward $29.33.
  • Should prices slip below $29.33 this could open the doors towards the 50-day SMA.


Forex-Time-LogoArticle by ForexTime

ForexTime Ltd (FXTM) is an award winning international online forex broker regulated by CySEC 185/12 www.forextime.com

Gold hits new record high

By RoboForex Analytical Department

On Monday, a troy ounce of gold set a new price peak of 3438.00 USD. This surge was fuelled by renewed speculation about potential interest rate cuts by the US Federal Reserve, vigorous gold purchases by banks globally, and strong investor demand for safe-haven assets.

Recent statistics indicating a slowdown in consumer inflation in the US and a decline in retail sales have given the Fed more flexibility for potential ease of monetary policy this year. Although the Fed’s official stance has not changed, investors are already speculating on a rate cut. A lower interest rate would enhance the appeal of non-interest-bearing assets such as gold.

Additionally, escalating geopolitical tensions in the Middle East contribute to the rise in gold prices. Furthermore, global central banks, including China, continue to buy gold to diversify their reserves and reduce dependency on the US dollar.

XAU/USD technical analysis

On the H4 chart of XAU/USD, a consolidation range has formed above the level of 2374.00, with the growth wave continuing towards 2550.00. The local target of 2450.00 has been achieved. Today, a corrective move to at least 2410.00 is expected. If this level breaks, the correction could extend to 2374.00. Following this correction, growth towards 2550.00 is anticipated. This bullish scenario is supported by the MACD indicator, with its signal line above zero and pointing upwards towards new highs.

On the H1 chart, a growth wave to 2450.00 was completed. Today, a correction to 2410.00 (testing from above) is anticipated. After this correction, another growth wave to 2450.00 is expected, potentially extending to 2550.00. This scenario is technically supported by the Stochastic oscillator, with its signal line currently above 80 and expected to decline to 20 before resuming its upward trend.

Summary

Gold hits a new record high, driven by speculation about potential US interest rate cuts by the US Federal Reserve, strong demand from central banks, and increased geopolitical tensions in the Middle East. Technical analysis indicates short-term correction before continuing the upward trend towards higher targets. Investors should monitor these developments closely, as the market remains highly responsive to economic and geopolitical signals.

Disclaimer

Any forecasts contained herein are based on the author’s particular opinion. This analysis may not be treated as trading advice. RoboForex bears no responsibility for trading results based on trading recommendations and reviews contained herein.

COT Metals Charts: Speculator bets led by Platinum & Silver

By InvestMacro

Here are the latest charts and statistics for the Commitment of Traders (COT) data published by the Commodities Futures Trading Commission (CFTC).

The latest COT data is updated through Tuesday May 14th and shows a quick view of how large traders (for-profit speculators and commercial entities) were positioned in the futures markets.

Weekly Speculator Changes led by Platinum & Silver

The COT metals markets speculator bets were higher this week as four out of the six metals markets we cover had higher positioning while the other two markets had lower speculator contracts.

Leading the gains for the metals was Platinum (10,787 contracts) with Silver (5,809 contracts), Gold (4,929 contracts) and Palladium (188 contracts) also showing positive weeks.

The markets with declines in speculator bets for the week were Copper (-868 contracts) with Steel (-865 contracts) also registering lower bets on the week.


Metals Net Speculators Leaderboard

Legend: Weekly Speculators Change | Speculators Current Net Position | Speculators Strength Score compared to last 3-Years (0-100 range)


Strength Scores led by Silver & Copper

COT Strength Scores (a normalized measure of Speculator positions over a 3-Year range, from 0 to 100 where above 80 is Extreme-Bullish and below 20 is Extreme-Bearish) showed that Silver (100 percent) and Copper (99 percent) lead the metals markets this week. Gold (69 percent) comes in as the next highest in the weekly strength scores.

On the downside, Palladium (16 percent) comes in at the lowest strength level currently and is in Extreme-Bearish territory (below 20 percent).

Strength Statistics:
Gold (68.6 percent) vs Gold previous week (66.3 percent)
Silver (100.0 percent) vs Silver previous week (92.0 percent)
Copper (99.1 percent) vs Copper previous week (100.0 percent)
Platinum (83.3 percent) vs Platinum previous week (54.5 percent)
Palladium (16.3 percent) vs Palladium previous week (15.2 percent)
Steel (80.1 percent) vs Palladium previous week (83.4 percent)


Copper & Platinum top the 6-Week Strength Trends

COT Strength Score Trends (or move index, calculates the 6-week changes in strength scores) showed that Copper (42 percent) and Platinum (42 percent) lead the past six weeks trends for metals.

Steel (-13 percent) and Palladium (-4 percent) lead the downside trend scores currently.

Move Statistics:
Gold (-1.2 percent) vs Gold previous week (0.1 percent)
Silver (8.7 percent) vs Silver previous week (3.9 percent)
Copper (42.2 percent) vs Copper previous week (40.2 percent)
Platinum (42.3 percent) vs Platinum previous week (17.3 percent)
Palladium (-4.4 percent) vs Palladium previous week (-7.4 percent)
Steel (-13.5 percent) vs Steel previous week (-6.1 percent)


Individual Markets:

Gold Comex Futures:

Gold Futures COT ChartThe Gold Comex Futures large speculator standing this week was a net position of 204,496 contracts in the data reported through Tuesday. This was a weekly rise of 4,929 contracts from the previous week which had a total of 199,567 net contracts.

This week’s current strength score (the trader positioning range over the past three years, measured from 0 to 100) shows the speculators are currently Bullish with a score of 68.6 percent. The commercials are Bearish with a score of 30.6 percent and the small traders (not shown in chart) are Bullish with a score of 62.8 percent.

Price Trend-Following Model: Strong Uptrend

Our weekly trend-following model classifies the current market price position as: Strong Uptrend. The current action for the model is considered to be: Hold – Maintain Long Position.

Gold Futures StatisticsSPECULATORSCOMMERCIALSSMALL TRADERS
– Percent of Open Interest Longs:53.125.510.1
– Percent of Open Interest Shorts:14.069.94.8
– Net Position:204,496-232,11027,614
– Gross Longs:277,642133,58352,633
– Gross Shorts:73,146365,69325,019
– Long to Short Ratio:3.8 to 10.4 to 12.1 to 1
NET POSITION TREND:
– Strength Index Score (3 Year Range Pct):68.630.662.8
– Strength Index Reading (3 Year Range):BullishBearishBullish
NET POSITION MOVEMENT INDEX:
– 6-Week Change in Strength Index:-1.2-2.629.4


Silver Comex Futures:

Silver Futures COT ChartThe Silver Comex Futures large speculator standing this week was a net position of 59,461 contracts in the data reported through Tuesday. This was a weekly boost of 5,809 contracts from the previous week which had a total of 53,652 net contracts.

This week’s current strength score (the trader positioning range over the past three years, measured from 0 to 100) shows the speculators are currently Bullish-Extreme with a score of 100.0 percent. The commercials are Bearish-Extreme with a score of 0.0 percent and the small traders (not shown in chart) are Bullish-Extreme with a score of 88.8 percent.

Price Trend-Following Model: Strong Uptrend

Our weekly trend-following model classifies the current market price position as: Strong Uptrend. The current action for the model is considered to be: Hold – Maintain Long Position.

Silver Futures StatisticsSPECULATORSCOMMERCIALSSMALL TRADERS
– Percent of Open Interest Longs:51.324.219.1
– Percent of Open Interest Shorts:16.671.76.3
– Net Position:59,461-81,42221,961
– Gross Longs:87,93641,53232,735
– Gross Shorts:28,475122,95410,774
– Long to Short Ratio:3.1 to 10.3 to 13.0 to 1
NET POSITION TREND:
– Strength Index Score (3 Year Range Pct):100.00.088.8
– Strength Index Reading (3 Year Range):Bullish-ExtremeBearish-ExtremeBullish-Extreme
NET POSITION MOVEMENT INDEX:
– 6-Week Change in Strength Index:8.7-15.941.4


Copper Grade #1 Futures:

Copper Futures COT ChartThe Copper Grade #1 Futures large speculator standing this week was a net position of 61,780 contracts in the data reported through Tuesday. This was a weekly decrease of -868 contracts from the previous week which had a total of 62,648 net contracts.

This week’s current strength score (the trader positioning range over the past three years, measured from 0 to 100) shows the speculators are currently Bullish-Extreme with a score of 99.1 percent. The commercials are Bearish-Extreme with a score of 0.3 percent and the small traders (not shown in chart) are Bullish with a score of 68.2 percent.

Price Trend-Following Model: Strong Uptrend

Our weekly trend-following model classifies the current market price position as: Strong Uptrend. The current action for the model is considered to be: Hold – Maintain Long Position.

Copper Futures StatisticsSPECULATORSCOMMERCIALSSMALL TRADERS
– Percent of Open Interest Longs:51.822.58.0
– Percent of Open Interest Shorts:32.244.55.5
– Net Position:61,780-69,6567,876
– Gross Longs:163,66271,02625,246
– Gross Shorts:101,882140,68217,370
– Long to Short Ratio:1.6 to 10.5 to 11.5 to 1
NET POSITION TREND:
– Strength Index Score (3 Year Range Pct):99.10.368.2
– Strength Index Reading (3 Year Range):Bullish-ExtremeBearish-ExtremeBullish
NET POSITION MOVEMENT INDEX:
– 6-Week Change in Strength Index:42.2-39.0-4.9


Platinum Futures:

Platinum Futures COT ChartThe Platinum Futures large speculator standing this week was a net position of 24,447 contracts in the data reported through Tuesday. This was a weekly advance of 10,787 contracts from the previous week which had a total of 13,660 net contracts.

This week’s current strength score (the trader positioning range over the past three years, measured from 0 to 100) shows the speculators are currently Bullish-Extreme with a score of 83.3 percent. The commercials are Bearish-Extreme with a score of 16.4 percent and the small traders (not shown in chart) are Bearish-Extreme with a score of 18.7 percent.

Price Trend-Following Model: Strong Uptrend

Our weekly trend-following model classifies the current market price position as: Strong Uptrend. The current action for the model is considered to be: Hold – Maintain Long Position.

Platinum Futures StatisticsSPECULATORSCOMMERCIALSSMALL TRADERS
– Percent of Open Interest Longs:61.219.710.5
– Percent of Open Interest Shorts:33.152.16.2
– Net Position:24,447-28,1943,747
– Gross Longs:53,31417,1819,115
– Gross Shorts:28,86745,3755,368
– Long to Short Ratio:1.8 to 10.4 to 11.7 to 1
NET POSITION TREND:
– Strength Index Score (3 Year Range Pct):83.316.418.7
– Strength Index Reading (3 Year Range):Bullish-ExtremeBearish-ExtremeBearish-Extreme
NET POSITION MOVEMENT INDEX:
– 6-Week Change in Strength Index:42.3-37.9-22.2


Palladium Futures:

Palladium Futures COT ChartThe Palladium Futures large speculator standing this week was a net position of -10,900 contracts in the data reported through Tuesday. This was a weekly gain of 188 contracts from the previous week which had a total of -11,088 net contracts.

This week’s current strength score (the trader positioning range over the past three years, measured from 0 to 100) shows the speculators are currently Bearish-Extreme with a score of 16.3 percent. The commercials are Bullish-Extreme with a score of 83.1 percent and the small traders (not shown in chart) are Bullish with a score of 79.2 percent.

Price Trend-Following Model: Uptrend

Our weekly trend-following model classifies the current market price position as: Uptrend. The current action for the model is considered to be: New Buy – Long Position.

Palladium Futures StatisticsSPECULATORSCOMMERCIALSSMALL TRADERS
– Percent of Open Interest Longs:22.347.68.3
– Percent of Open Interest Shorts:62.110.16.0
– Net Position:-10,90010,276624
– Gross Longs:6,11013,0342,271
– Gross Shorts:17,0102,7581,647
– Long to Short Ratio:0.4 to 14.7 to 11.4 to 1
NET POSITION TREND:
– Strength Index Score (3 Year Range Pct):16.383.179.2
– Strength Index Reading (3 Year Range):Bearish-ExtremeBullish-ExtremeBullish
NET POSITION MOVEMENT INDEX:
– 6-Week Change in Strength Index:-4.40.636.4


Steel Futures Futures:

Steel Futures COT ChartThe Steel Futures large speculator standing this week was a net position of -4,248 contracts in the data reported through Tuesday. This was a weekly reduction of -865 contracts from the previous week which had a total of -3,383 net contracts.

This week’s current strength score (the trader positioning range over the past three years, measured from 0 to 100) shows the speculators are currently Bullish-Extreme with a score of 80.1 percent. The commercials are Bearish with a score of 20.2 percent and the small traders (not shown in chart) are Bearish with a score of 49.6 percent.

Price Trend-Following Model: Downtrend

Our weekly trend-following model classifies the current market price position as: Downtrend. The current action for the model is considered to be: Hold – Maintain Short Position.

Steel Futures StatisticsSPECULATORSCOMMERCIALSSMALL TRADERS
– Percent of Open Interest Longs:13.380.41.6
– Percent of Open Interest Shorts:29.265.11.0
– Net Position:-4,2484,091157
– Gross Longs:3,57321,523437
– Gross Shorts:7,82117,432280
– Long to Short Ratio:0.5 to 11.2 to 11.6 to 1
NET POSITION TREND:
– Strength Index Score (3 Year Range Pct):80.120.249.6
– Strength Index Reading (3 Year Range):Bullish-ExtremeBearishBearish
NET POSITION MOVEMENT INDEX:
– 6-Week Change in Strength Index:-13.513.8-8.4


Article By InvestMacroReceive our weekly COT Newsletter

*COT Report: The COT data, released weekly to the public each Friday, is updated through the most recent Tuesday (data is 3 days old) and shows a quick view of how large speculators or non-commercials (for-profit traders) were positioned in the futures markets.

The CFTC categorizes trader positions according to commercial hedgers (traders who use futures contracts for hedging as part of the business), non-commercials (large traders who speculate to realize trading profits) and nonreportable traders (usually small traders/speculators) as well as their open interest (contracts open in the market at time of reporting). See CFTC criteria here.

COT Metals Charts: Speculator bets led by Platinum & Copper

By InvestMacro

Here are the latest charts and statistics for the Commitment of Traders (COT) data published by the Commodities Futures Trading Commission (CFTC).

The latest COT data is updated through Tuesday May 7th and shows a quick view of how large traders (for-profit speculators and commercial entities) were positioned in the futures markets.

Weekly Speculator Changes led by Platinum & Copper

The COT metals markets speculator bets were lower this week as just two out of the six metals markets we cover had higher positioning while the other four markets had lower speculator contracts.

Leading the gains for the metals was Platinum (6,863 contracts) with Copper (4,584 contracts) also showing a positive week.

The markets with declines in speculator bets for the week were Gold (-4,643 contracts), Silver (-842 contracts), Steel (-720 contracts) and with Palladium (-18 contracts) also registering lower bets on the week.


Metals Net Speculators Leaderboard

Legend: Weekly Speculators Change | Speculators Current Net Position | Speculators Strength Score compared to last 3-Years (0-100 range)


Strength Scores led by Copper & Silver

COT Strength Scores (a normalized measure of Speculator positions over a 3-Year range, from 0 to 100 where above 80 is Extreme-Bullish and below 20 is Extreme-Bearish) showed that Copper (100 percent) and Silver (92 percent) lead the metals markets this week.

On the downside, Palladium (15 percent) comes in at the lowest strength level currently and is in Extreme-Bearish territory (below 20 percent).

Strength Statistics:
Gold (66.3 percent) vs Gold previous week (68.4 percent)
Silver (92.1 percent) vs Silver previous week (93.3 percent)
Copper (100.0 percent) vs Copper previous week (95.3 percent)
Platinum (54.5 percent) vs Platinum previous week (36.2 percent)
Palladium (15.1 percent) vs Palladium previous week (15.2 percent)
Steel (83.4 percent) vs Palladium previous week (86.2 percent)


Copper & Platinum top the 6-Week Strength Trends

COT Strength Score Trends (or move index, calculates the 6-week changes in strength scores) showed that Copper (40 percent) and Platinum (17 percent) lead the past six weeks trends for metals.

Palladium (-7 percent) leads the downside trend scores currently with Steel (-6 percent) as the next market with lower trend scores.

Move Statistics:
Gold (0.1 percent) vs Gold previous week (1.2 percent)
Silver (3.9 percent) vs Silver previous week (2.9 percent)
Copper (40.2 percent) vs Copper previous week (26.6 percent)
Platinum (17.3 percent) vs Platinum previous week (1.4 percent)
Palladium (-7.4 percent) vs Palladium previous week (-6.5 percent)
Steel (-6.1 percent) vs Steel previous week (-0.5 percent)


Individual Markets:

Gold Comex Futures:

Gold Futures COT ChartThe Gold Comex Futures large speculator standing this week came in at a net position of 199,567 contracts in the data reported through Tuesday. This was a weekly fall of -4,643 contracts from the previous week which had a total of 204,210 net contracts.

This week’s current strength score (the trader positioning range over the past three years, measured from 0 to 100) shows the speculators are currently Bullish with a score of 66.3 percent. The commercials are Bearish with a score of 32.5 percent and the small traders (not shown in chart) are Bullish with a score of 63.1 percent.

Price Trend-Following Model: Strong Uptrend

Our weekly trend-following model classifies the current market price position as: Strong Uptrend. The current action for the model is considered to be: Hold – Maintain Long Position.

Gold Futures StatisticsSPECULATORSCOMMERCIALSSMALL TRADERS
– Percent of Open Interest Longs:51.423.610.3
– Percent of Open Interest Shorts:13.766.55.1
– Net Position:199,567-227,26627,699
– Gross Longs:272,144124,89954,701
– Gross Shorts:72,577352,16527,002
– Long to Short Ratio:3.7 to 10.4 to 12.0 to 1
NET POSITION TREND:
– Strength Index Score (3 Year Range Pct):66.332.563.1
– Strength Index Reading (3 Year Range):BullishBearishBullish
NET POSITION MOVEMENT INDEX:
– 6-Week Change in Strength Index:0.1-3.627.8


Silver Comex Futures:

Silver Futures COT ChartThe Silver Comex Futures large speculator standing this week came in at a net position of 53,652 contracts in the data reported through Tuesday. This was a weekly lowering of -842 contracts from the previous week which had a total of 54,494 net contracts.

This week’s current strength score (the trader positioning range over the past three years, measured from 0 to 100) shows the speculators are currently Bullish-Extreme with a score of 92.1 percent. The commercials are Bearish-Extreme with a score of 3.6 percent and the small traders (not shown in chart) are Bullish-Extreme with a score of 82.1 percent.

Price Trend-Following Model: Strong Uptrend

Our weekly trend-following model classifies the current market price position as: Strong Uptrend. The current action for the model is considered to be: Hold – Maintain Long Position.

Silver Futures StatisticsSPECULATORSCOMMERCIALSSMALL TRADERS
– Percent of Open Interest Longs:50.424.220.0
– Percent of Open Interest Shorts:17.370.27.2
– Net Position:53,652-74,41520,763
– Gross Longs:81,65039,22532,441
– Gross Shorts:27,998113,64011,678
– Long to Short Ratio:2.9 to 10.3 to 12.8 to 1
NET POSITION TREND:
– Strength Index Score (3 Year Range Pct):92.13.682.1
– Strength Index Reading (3 Year Range):Bullish-ExtremeBearish-ExtremeBullish-Extreme
NET POSITION MOVEMENT INDEX:
– 6-Week Change in Strength Index:3.9-11.336.5


Copper Grade #1 Futures:

Copper Futures COT ChartThe Copper Grade #1 Futures large speculator standing this week came in at a net position of 62,648 contracts in the data reported through Tuesday. This was a weekly lift of 4,584 contracts from the previous week which had a total of 58,064 net contracts.

This week’s current strength score (the trader positioning range over the past three years, measured from 0 to 100) shows the speculators are currently Bullish-Extreme with a score of 100.0 percent. The commercials are Bearish-Extreme with a score of 0.0 percent and the small traders (not shown in chart) are Bullish with a score of 64.9 percent.

Price Trend-Following Model: Strong Uptrend

Our weekly trend-following model classifies the current market price position as: Strong Uptrend. The current action for the model is considered to be: Hold – Maintain Long Position.

Copper Futures StatisticsSPECULATORSCOMMERCIALSSMALL TRADERS
– Percent of Open Interest Longs:53.321.47.5
– Percent of Open Interest Shorts:32.544.75.1
– Net Position:62,648-70,0127,364
– Gross Longs:160,14764,28022,549
– Gross Shorts:97,499134,29215,185
– Long to Short Ratio:1.6 to 10.5 to 11.5 to 1
NET POSITION TREND:
– Strength Index Score (3 Year Range Pct):100.00.064.9
– Strength Index Reading (3 Year Range):Bullish-ExtremeBearish-ExtremeBullish
NET POSITION MOVEMENT INDEX:
– 6-Week Change in Strength Index:40.2-37.6-2.5


Platinum Futures:

Platinum Futures COT ChartThe Platinum Futures large speculator standing this week came in at a net position of 13,660 contracts in the data reported through Tuesday. This was a weekly advance of 6,863 contracts from the previous week which had a total of 6,797 net contracts.

This week’s current strength score (the trader positioning range over the past three years, measured from 0 to 100) shows the speculators are currently Bullish with a score of 54.5 percent. The commercials are Bearish with a score of 44.7 percent and the small traders (not shown in chart) are Bearish with a score of 30.9 percent.

Price Trend-Following Model: Strong Uptrend

Our weekly trend-following model classifies the current market price position as: Strong Uptrend. The current action for the model is considered to be: New Buy – Long Position.

Platinum Futures StatisticsSPECULATORSCOMMERCIALSSMALL TRADERS
– Percent of Open Interest Longs:56.124.510.7
– Percent of Open Interest Shorts:39.147.24.9
– Net Position:13,660-18,3484,688
– Gross Longs:45,23219,7328,620
– Gross Shorts:31,57238,0803,932
– Long to Short Ratio:1.4 to 10.5 to 12.2 to 1
NET POSITION TREND:
– Strength Index Score (3 Year Range Pct):54.544.730.9
– Strength Index Reading (3 Year Range):BullishBearishBearish
NET POSITION MOVEMENT INDEX:
– 6-Week Change in Strength Index:17.3-15.1-7.9


Palladium Futures:

Palladium Futures COT ChartThe Palladium Futures large speculator standing this week came in at a net position of -11,088 contracts in the data reported through Tuesday. This was a weekly decrease of -18 contracts from the previous week which had a total of -11,070 net contracts.

This week’s current strength score (the trader positioning range over the past three years, measured from 0 to 100) shows the speculators are currently Bearish-Extreme with a score of 15.1 percent. The commercials are Bullish-Extreme with a score of 85.1 percent and the small traders (not shown in chart) are Bullish with a score of 71.0 percent.

Price Trend-Following Model: Downtrend

Our weekly trend-following model classifies the current market price position as: Downtrend. The current action for the model is considered to be: Hold – Maintain Short Position.

Palladium Futures StatisticsSPECULATORSCOMMERCIALSSMALL TRADERS
– Percent of Open Interest Longs:22.651.38.7
– Percent of Open Interest Shorts:65.710.26.8
– Net Position:-11,08810,600488
– Gross Longs:5,82313,2202,230
– Gross Shorts:16,9112,6201,742
– Long to Short Ratio:0.3 to 15.0 to 11.3 to 1
NET POSITION TREND:
– Strength Index Score (3 Year Range Pct):15.185.171.0
– Strength Index Reading (3 Year Range):Bearish-ExtremeBullish-ExtremeBullish
NET POSITION MOVEMENT INDEX:
– 6-Week Change in Strength Index:-7.43.636.1


Steel Futures Futures:

Steel Futures COT ChartThe Steel Futures large speculator standing this week came in at a net position of -3,383 contracts in the data reported through Tuesday. This was a weekly lowering of -720 contracts from the previous week which had a total of -2,663 net contracts.

This week’s current strength score (the trader positioning range over the past three years, measured from 0 to 100) shows the speculators are currently Bullish-Extreme with a score of 83.4 percent. The commercials are Bearish-Extreme with a score of 17.3 percent and the small traders (not shown in chart) are Bearish with a score of 37.6 percent.

Price Trend-Following Model: Downtrend

Our weekly trend-following model classifies the current market price position as: Downtrend. The current action for the model is considered to be: Hold – Maintain Short Position.

Steel Futures StatisticsSPECULATORSCOMMERCIALSSMALL TRADERS
– Percent of Open Interest Longs:14.080.41.4
– Percent of Open Interest Shorts:27.267.41.2
– Net Position:-3,3833,33548
– Gross Longs:3,60620,678362
– Gross Shorts:6,98917,343314
– Long to Short Ratio:0.5 to 11.2 to 11.2 to 1
NET POSITION TREND:
– Strength Index Score (3 Year Range Pct):83.417.337.6
– Strength Index Reading (3 Year Range):Bullish-ExtremeBearish-ExtremeBearish
NET POSITION MOVEMENT INDEX:
– 6-Week Change in Strength Index:-6.15.88.9


Article By InvestMacroReceive our weekly COT Newsletter

*COT Report: The COT data, released weekly to the public each Friday, is updated through the most recent Tuesday (data is 3 days old) and shows a quick view of how large speculators or non-commercials (for-profit traders) were positioned in the futures markets.

The CFTC categorizes trader positions according to commercial hedgers (traders who use futures contracts for hedging as part of the business), non-commercials (large traders who speculate to realize trading profits) and nonreportable traders (usually small traders/speculators) as well as their open interest (contracts open in the market at time of reporting). See CFTC criteria here.

COT Metals Charts: Speculator bets led by Gold & Steel

By InvestMacro

Here are the latest charts and statistics for the Commitment of Traders (COT) data published by the Commodities Futures Trading Commission (CFTC).

The latest COT data is updated through Tuesday April 30th and shows a quick view of how large traders (for-profit speculators and commercial entities) were positioned in the futures markets.

Weekly Speculator Changes led by Gold & Steel

The COT metals markets speculator bets were lower this week as two out of the six metals markets we cover had higher positioning while the other four markets had lower speculator contracts.

Leading the gains for the metals was Gold (1,319 contracts) with Steel (1,136 contracts) also recording a positive contract week.

The markets with declines in speculator bets for the week were Silver (-4,846 contracts), Palladium (-1,912 contracts), Platinum (-667 contracts) and with Copper (-330 contracts) also registering lower bets on the week.


Metals Net Speculators Leaderboard

Legend: Weekly Speculators Change | Speculators Current Net Position | Speculators Strength Score compared to last 3-Years (0-100 range)


Strength Scores led by Copper & Silver

COT Strength Scores (a normalized measure of Speculator positions over a 3-Year range, from 0 to 100 where above 80 is Extreme-Bullish and below 20 is Extreme-Bearish) showed that Copper (100 percent), Silver (93 percent) and Steel (86 percent) lead the metals markets this week. Gold (68 percent) comes in as the next highest in the weekly strength scores.

On the downside, Palladium (15 percent) comes in at the lowest strength level currently and is in Extreme-Bearish territory (below 20 percent). The next lowest strength score was Platinum (36 percent).

Strength Statistics:
Gold (68.4 percent) vs Gold previous week (67.8 percent)
Silver (93.3 percent) vs Silver previous week (100.0 percent)
Copper (99.6 percent) vs Copper previous week (100.0 percent)
Platinum (36.2 percent) vs Platinum previous week (38.0 percent)
Palladium (15.0 percent) vs Palladium previous week (26.7 percent)
Steel (86.2 percent) vs Palladium previous week (81.8 percent)


Copper tops the 6-Week Strength Trends

COT Strength Score Trends (or move index, calculates the 6-week changes in strength scores) showed that Copper (28 percent) leads the past six weeks trends for metals. Silver (3 percent) is the next highest positive mover in the latest trends data.

Palladium (-6 percent) leads the downside trend scores currently with Steel (-1 percent) as the next market with lower trend scores.

Move Statistics:
Gold (1.2 percent) vs Gold previous week (0.6 percent)
Silver (2.9 percent) vs Silver previous week (25.5 percent)
Copper (27.8 percent) vs Copper previous week (56.3 percent)
Platinum (1.4 percent) vs Platinum previous week (0.1 percent)
Palladium (-6.5 percent) vs Palladium previous week (8.7 percent)
Steel (-0.5 percent) vs Steel previous week (-6.0 percent)


Individual Markets:

Gold Comex Futures:

Gold Futures COT ChartThe Gold Comex Futures large speculator standing this week was a net position of 204,210 contracts in the data reported through Tuesday. This was a weekly lift of 1,319 contracts from the previous week which had a total of 202,891 net contracts.

This week’s current strength score (the trader positioning range over the past three years, measured from 0 to 100) shows the speculators are currently Bullish with a score of 68.4 percent. The commercials are Bearish with a score of 32.5 percent and the small traders (not shown in chart) are Bearish with a score of 49.0 percent.

Price Trend-Following Model: Uptrend

Our weekly trend-following model classifies the current market price position as: Uptrend. The current action for the model is considered to be: Hold – Maintain Long Position.

Gold Futures StatisticsSPECULATORSCOMMERCIALSSMALL TRADERS
– Percent of Open Interest Longs:53.624.49.7
– Percent of Open Interest Shorts:14.468.25.2
– Net Position:204,210-227,49823,288
– Gross Longs:278,850126,92550,274
– Gross Shorts:74,640354,42326,986
– Long to Short Ratio:3.7 to 10.4 to 11.9 to 1
NET POSITION TREND:
– Strength Index Score (3 Year Range Pct):68.432.549.0
– Strength Index Reading (3 Year Range):BullishBearishBearish
NET POSITION MOVEMENT INDEX:
– 6-Week Change in Strength Index:1.2-4.123.6


Silver Comex Futures:

Silver Futures COT ChartThe Silver Comex Futures large speculator standing this week was a net position of 54,494 contracts in the data reported through Tuesday. This was a weekly decline of -4,846 contracts from the previous week which had a total of 59,340 net contracts.

This week’s current strength score (the trader positioning range over the past three years, measured from 0 to 100) shows the speculators are currently Bullish-Extreme with a score of 93.3 percent. The commercials are Bearish-Extreme with a score of 2.7 percent and the small traders (not shown in chart) are Bullish-Extreme with a score of 81.7 percent.

Price Trend-Following Model: Uptrend

Our weekly trend-following model classifies the current market price position as: Uptrend. The current action for the model is considered to be: Hold – Maintain Long Position.

Silver Futures StatisticsSPECULATORSCOMMERCIALSSMALL TRADERS
– Percent of Open Interest Longs:50.024.519.4
– Percent of Open Interest Shorts:17.269.77.0
– Net Position:54,494-75,19620,702
– Gross Longs:83,09440,74532,309
– Gross Shorts:28,600115,94111,607
– Long to Short Ratio:2.9 to 10.4 to 12.8 to 1
NET POSITION TREND:
– Strength Index Score (3 Year Range Pct):93.32.781.7
– Strength Index Reading (3 Year Range):Bullish-ExtremeBearish-ExtremeBullish-Extreme
NET POSITION MOVEMENT INDEX:
– 6-Week Change in Strength Index:2.9-13.651.1


Copper Grade #1 Futures:

Copper Futures COT ChartThe Copper Grade #1 Futures large speculator standing this week was a net position of 58,064 contracts in the data reported through Tuesday. This was a weekly decline of -330 contracts from the previous week which had a total of 58,394 net contracts.

This week’s current strength score (the trader positioning range over the past three years, measured from 0 to 100) shows the speculators are currently Bullish-Extreme with a score of 99.6 percent. The commercials are Bearish-Extreme with a score of 0.0 percent and the small traders (not shown in chart) are Bullish with a score of 72.6 percent.

Price Trend-Following Model: Strong Uptrend

Our weekly trend-following model classifies the current market price position as: Strong Uptrend. The current action for the model is considered to be: Hold – Maintain Long Position.

Copper Futures StatisticsSPECULATORSCOMMERCIALSSMALL TRADERS
– Percent of Open Interest Longs:52.122.57.9
– Percent of Open Interest Shorts:32.345.25.0
– Net Position:58,064-66,6428,578
– Gross Longs:152,80766,10523,247
– Gross Shorts:94,743132,74714,669
– Long to Short Ratio:1.6 to 10.5 to 11.6 to 1
NET POSITION TREND:
– Strength Index Score (3 Year Range Pct):99.60.072.6
– Strength Index Reading (3 Year Range):Bullish-ExtremeBearish-ExtremeBullish
NET POSITION MOVEMENT INDEX:
– 6-Week Change in Strength Index:27.8-26.96.3


Platinum Futures:

Platinum Futures COT ChartThe Platinum Futures large speculator standing this week was a net position of 6,797 contracts in the data reported through Tuesday. This was a weekly lowering of -667 contracts from the previous week which had a total of 7,464 net contracts.

This week’s current strength score (the trader positioning range over the past three years, measured from 0 to 100) shows the speculators are currently Bearish with a score of 36.2 percent. The commercials are Bullish with a score of 60.6 percent and the small traders (not shown in chart) are Bearish with a score of 45.3 percent.

Price Trend-Following Model: Weak Downtrend

Our weekly trend-following model classifies the current market price position as: Weak Downtrend. The current action for the model is considered to be: Hold – Maintain Short Position.

Platinum Futures StatisticsSPECULATORSCOMMERCIALSSMALL TRADERS
– Percent of Open Interest Longs:53.125.611.4
– Percent of Open Interest Shorts:44.641.34.2
– Net Position:6,797-12,5705,773
– Gross Longs:42,53220,5529,143
– Gross Shorts:35,73533,1223,370
– Long to Short Ratio:1.2 to 10.6 to 12.7 to 1
NET POSITION TREND:
– Strength Index Score (3 Year Range Pct):36.260.645.3
– Strength Index Reading (3 Year Range):BearishBullishBearish
NET POSITION MOVEMENT INDEX:
– 6-Week Change in Strength Index:1.41.3-13.6


Palladium Futures:

Palladium Futures COT ChartThe Palladium Futures large speculator standing this week was a net position of -11,070 contracts in the data reported through Tuesday. This was a weekly decline of -1,912 contracts from the previous week which had a total of -9,158 net contracts.

This week’s current strength score (the trader positioning range over the past three years, measured from 0 to 100) shows the speculators are currently Bearish-Extreme with a score of 15.0 percent. The commercials are Bullish-Extreme with a score of 86.5 percent and the small traders (not shown in chart) are Bullish with a score of 59.1 percent.

Price Trend-Following Model: Strong Downtrend

Our weekly trend-following model classifies the current market price position as: Strong Downtrend. The current action for the model is considered to be: Hold – Maintain Short Position.

Palladium Futures StatisticsSPECULATORSCOMMERCIALSSMALL TRADERS
– Percent of Open Interest Longs:23.056.28.5
– Percent of Open Interest Shorts:69.810.67.3
– Net Position:-11,07010,780290
– Gross Longs:5,43313,2942,011
– Gross Shorts:16,5032,5141,721
– Long to Short Ratio:0.3 to 15.3 to 11.2 to 1
NET POSITION TREND:
– Strength Index Score (3 Year Range Pct):15.086.559.1
– Strength Index Reading (3 Year Range):Bearish-ExtremeBullish-ExtremeBullish
NET POSITION MOVEMENT INDEX:
– 6-Week Change in Strength Index:-6.53.330.3


Steel Futures Futures:

Steel Futures COT ChartThe Steel Futures large speculator standing this week was a net position of -2,663 contracts in the data reported through Tuesday. This was a weekly increase of 1,136 contracts from the previous week which had a total of -3,799 net contracts.

This week’s current strength score (the trader positioning range over the past three years, measured from 0 to 100) shows the speculators are currently Bullish-Extreme with a score of 86.2 percent. The commercials are Bearish-Extreme with a score of 14.4 percent and the small traders (not shown in chart) are Bearish with a score of 42.5 percent.

Price Trend-Following Model: Downtrend

Our weekly trend-following model classifies the current market price position as: Downtrend. The current action for the model is considered to be: Hold – Maintain Short Position.

Steel Futures StatisticsSPECULATORSCOMMERCIALSSMALL TRADERS
– Percent of Open Interest Longs:15.080.31.5
– Percent of Open Interest Shorts:25.969.71.1
– Net Position:-2,6632,57192
– Gross Longs:3,62919,477357
– Gross Shorts:6,29216,906265
– Long to Short Ratio:0.6 to 11.2 to 11.3 to 1
NET POSITION TREND:
– Strength Index Score (3 Year Range Pct):86.214.442.5
– Strength Index Reading (3 Year Range):Bullish-ExtremeBearish-ExtremeBearish
NET POSITION MOVEMENT INDEX:
– 6-Week Change in Strength Index:-0.50.6-1.9


Article By InvestMacroReceive our weekly COT Newsletter

*COT Report: The COT data, released weekly to the public each Friday, is updated through the most recent Tuesday (data is 3 days old) and shows a quick view of how large speculators or non-commercials (for-profit traders) were positioned in the futures markets.

The CFTC categorizes trader positions according to commercial hedgers (traders who use futures contracts for hedging as part of the business), non-commercials (large traders who speculate to realize trading profits) and nonreportable traders (usually small traders/speculators) as well as their open interest (contracts open in the market at time of reporting). See CFTC criteria here.

Heavenly Metals

Source: Michael Ballanger (4/29/24) 

Michael Ballanger of GGM Advisory Inc. takes a look at the current state of the markets, and shares some stocks he believes are worth taking a look at. 

As the Friday trading session came to a close this week, I had an epiphany of sorts in that instead of standing back and admiring the results while reaching around and patting myself several times on the back, I took the septuagenarian skin on the underside of my left bicep and gave it a rather robust pinch.

Rather than standing there reveling at copper and gold prices trading at or near multi-year highs, I instead decided to look “beneath the hood” at “conditions” that have quickly emerged as the standard bearer for the “Reflation Trade” that is quickly morphing into the new narrative for a large number of gargantuan traders.

Electrification

It was around the beginning of 2023, with the dominant narrative being that electrification metals like lithium and uranium are doing God’s work in alleviating the world’s sorry dependence on fossil fuels to provide heat and power to a growing global populace. Being a firm believer in the inevitability of electrification, I gravitated to the space not because I felt a moral or social obligation to avoid those necessary evils like oil and gas and coal. I did so because every time I looked into the mirror and saw a predominance of grey follicles in my beard, I came to the realization that my baby-booming generation of investors has little, if any, sway in influencing either market or social trends.

We are a dying breed of old, embittered gold bugs in constant search of that adrenalin rush that sent Foofoo Mines Ltd. in 1985 from $.10 to $2.00 on the release of drill core assays “too good to be true.” The reality in most cases was that a cabal of well-heeled traders with cavernous pockets full of excess margin could create junior market mania with three or four well-placed “Buy” orders designed to rip all resistance from any chart brave enough to be shown. As the volume alerts and price screeners kicked into gear, novice investors would clamor to buy any and all offerings that showed up while spreading the newly-found gospel called “King Foofoo” to any and all that might listen.

However, I digress.

The point I make is that the “old ways” of doing business in the junior resource sector have been replaced with the “new ways” by a socially responsible group of faux-liberal (with a small “L”) capitalists that will fight the carbon footprint as long as they have a $100,000 Tesla, a new model iPhone, and a pair of stovepipe dress pants too tight and too short for anyone other than a starving Biafran to wear.

The popularity of electrification in the investment narrative brought in huge moves in lithium, nickel, and uranium and I played all of those metals that seemed to explode right after the global central planners decided in March 2020 to shut down world trade and shutter its citizens in a desperate attempt to maintain the status quo of ever-rising equity markets and buoyant real estate. However, because young people these days have been fed a never-ending supply of behavior modification “medicines” (like Ritalin) to keep them “on task,” it appeared as though the vast majority of Millennial and Gen-X traders left their meds at home since 2020 lacking both the focus and resolve to stay invested much longer than the time it took for the ink to dry on their month-end statements.

On the topic of Attention Deficit Hyperactivity Disorder or “ADHD” as it has become known, when I was a young lad, as my mother recalled, I was known as an “active child.” Teachers referred to me as “fidgety” and “prone to distraction,” but it never affected either my behavior or my grades because of the use of a non-pharmaceutical method of attention control.

It was called a “yardstick,” and every teacher patrolled the classroom armed with this incredibly high-tech instrument. Just the sight of it protruding from the folded arms of a 110-lb., five-foot-tall, middle-aged lady teaching us geography would immediately imbed the entire list of world capitals into one’s memory banks, never, ever to be forgotten lest the wrath of “Old Yardie” come crashing down.

Yardsticks notwithstanding, I made a choice in early 2023 to refrain from falling in love (or lust) with any narrative deemed topical by the new generation of traders that run these markets.

Uranium

I turned to uranium and added Cameco Corp. (CCO:TSX; CCJ:NYSE) to my other holding, Western Uranium & Vanadium Corp. (WUC:CSE; WSTRF:OTCQX) in Q3 2023 and road it from $38 to $52 before exiting the uranium trade when it became apparent that the entire Twitterverse was long uranium juniors in every nook, cranny, and crevice of their investing superstructure.

Since my exit, the two “electrification darlings” of 2020-2023 have lagged badly. However, I remain a uranium “bull” and am seeking a re-entry level, hopefully soon.

Copper

While I was dabbling in the Li and U3O8 trades, I was quietly but steadily accumulating a basket of juniors that were not considered to be seen as “trades” but rather long-term positions with either excellent projects or discoveries and all of them are now fully funded and awaiting the commencement of drill programs in the hunt for or development of the one metal that is used universally the world over — copper.

I told subscribers in late 2022 that the two metals for the decade were copper and gold, with copper being the comprehensive answer to the electrification movement as whatever else happens with the establishment of new energy sources (like nuclear’s revival), the current global transmission grid would need to be expanded to accommodate all this new electricity being pumped out of all these new modular nuclear reactors.

Then, along comes another Millennial narrative called “artificial intelligence,” and as the mania of the decade fixes its grip on the investment world, they suddenly realize that all of this new computing power brought about by “AI” will require a boatload of additional electricity to power all of those new computers that will allow kindergarten kiddies to compose operatic symphonies with their iPhones driven by the magic of “AI”!

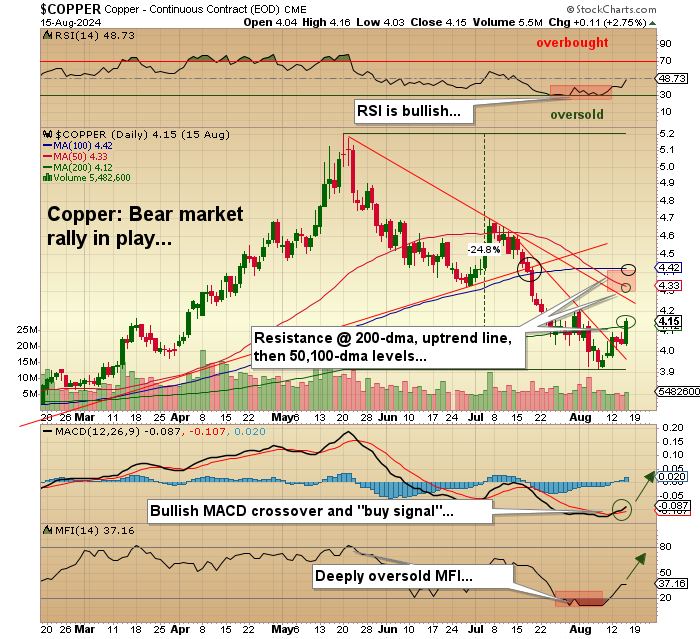
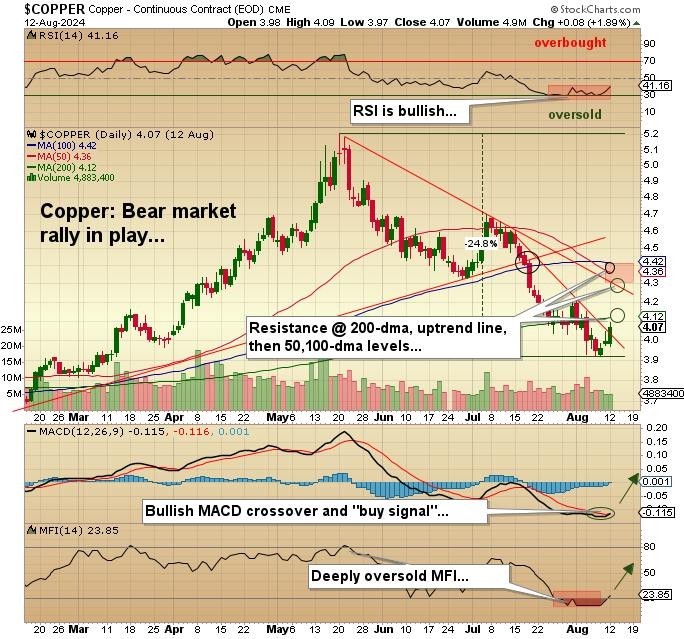
At this point in the weekly missive, I draw your attention to the earlier part where I spoke of an “epiphany of sorts” and that I was forced to “pinch myself” rather than revel in the glory of the 2024 performances of my two favorite metals. I would draw your attention firstly to copper, which just took out the June 2022 high at $4.57 while sporting a near-vertical ascent during the past month. It is now sporting an RSI at around 75, and while there is still a MACD “buy signal” in place, a couple of corrective days could trigger a reversal.

Up until mid-February, the ascent in copper had been gradual, but since then, the rise has moved to vertical. As I have written countless times, “any market whose trend moves from gradual to vertical is approaching a reversal of the prior trend”. So, copper is now overbought and in full vertical regalia, which means it may be like a bug in search of a windshield strictly from a technical perspective.

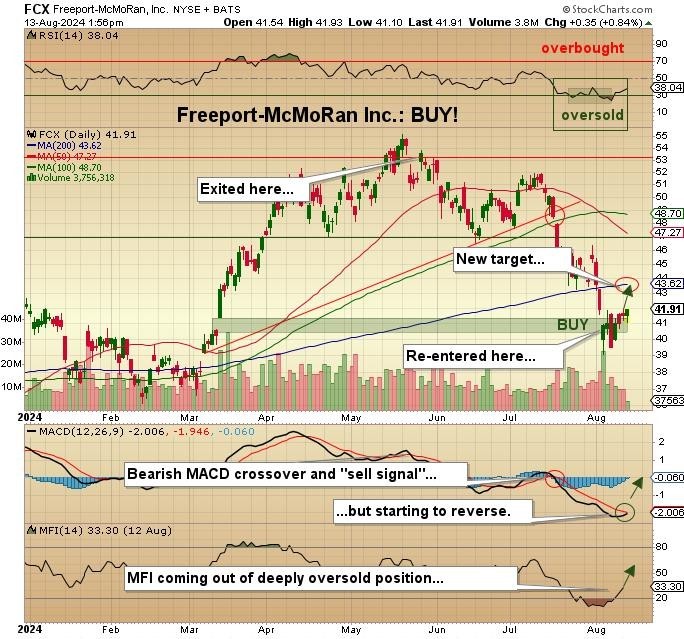
Now, when I make remarks such as these on a metal that is surely going to enter into a “structural deficit” within the next several quarters, the market appears to be discounting any likelihood of a global slowdown. I will exercise caution in chasing the big copper names. I have owned Freeport-McMoRan Inc. (FCX:NYSE) since $38 and will continue to hold it (at $50.50).

Despite the possibility of a correction, I see $75-100 by the end of 2025. A copper-gold leviathan, it is a core holding in any growth portfolio looking for the leadership of the cyclical names to replace technology as the next mania.

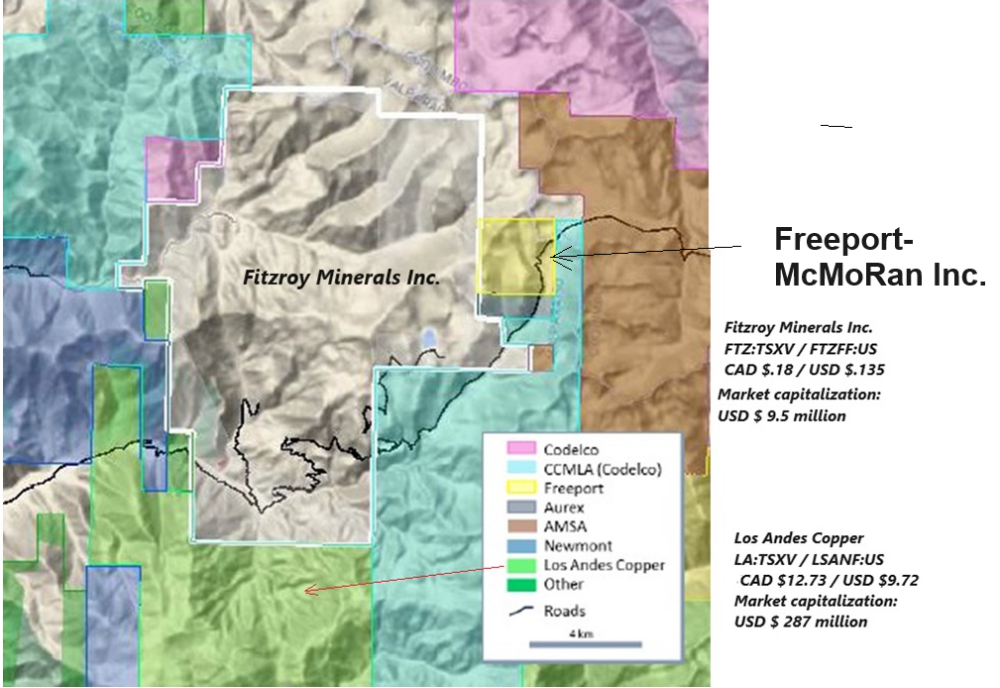
As for the juniors, I hold Fitzroy Minerals Inc. (FTZ:TSX.V; FTZFF:OTCQB) on the strength and promise of good things happening in their Chilean copper and Argentinian gold endeavors. I hear that field results are yielding some very interesting new revelations, and while they will be constrained by the South American winter, aggressive marketing of the new drill targets should set up an interesting drill program in the fall.

I also own American Eagle Gold Corp. (AE:TSXV), a very interesting little junior with a new copper-gold porphyry discovery in B.C. and an eager partner in Teck Resources Ltd. (TECK:TSX; TECK:NYSE) who at last glance own 19.9% of the company.

Their NAK discovery reported last January took the stock from under a dime to a high of CA$0.74 and is a solid “Buy” at around CA$0.60. I also added a brand new junior — Vortex Metals Inc. (VMSSF:OTCMKTS;VMS:TSX;DM8:FSE) by way of the recently announced (and upsized) placement at CA$0.09 (last at CA$0.13).

They are about to receive regulatory approval on a project located near the town of Illapel in north-central Chile, where a very interesting copper prospect exists. I listened to VMS director and ex-BHP country manager John Larson describe in minute detail the prospective nature of the multiple targets that exist. Also of extreme interest to me are the two Oaxaca (Mexico) prospects believed to be volcanogenic massive sulfide targets that were actually described to me by the late, great mine finder David Jones the year before he passed away.

A world-renowned expert in the exploration and exploitation of collapsed calderas (volcanos), he discovered Fortuna’s San Jose Gold Mine using techniques similar to what attracted him to the two Vortex targets. Chairman Michael Williams has brought investors a great deal of success with Underworld Resources (sold for $139 million to Kinross in 2009) and, more recently, Aftermath Silver, which subscribers know all too well from 2020. I am told that with the good graces of regulators and drill availability, Larson could be drilling Illapel by the end of next month.

With AE and VMS about to drill in May and with FTZ busy preparing for a fall start-up, 2024 is proving to be an interesting year with lots of irons in the fire hunting for the hottest metal on the planet.

Gold

The second component of the metals story for 2024 (and beyond) is none other than my sentimental favorite since 1976 — gold. Let it be known that while I was a card-carrying gold bug for nigh on thirty-five years, the events since the 2008 Great Financial Bailout Crisis forced me to turn in my card. I spent years collecting gold and silver coins for their numismatic value while keeping a horde of non-perishable foodstuffs in basement compartments along with fresh

water and medical supplies. I even kept large vessels of iodine rumored to be a repellent for radioactive poisoning. Then, in and around April of 2013, I watched the global trading community, under express orders from the Wall Street and Washington elites, absolutely crush any and all bullish sentiment for gold and silver in the wee hours of the western trading morning with the infamous “Sunday Night Massacre” that vaulted the precious metals into a four-year bear market whose debilitating effects are still being felt in the junior gold mining world a full eleven years later.

At that moment, I went from being a gold “advocate” to a gold “cynic,” and in order to maintain both sanity and net worth, I had to diversify away from a “gold only” allocation mixture to one that included gold but along with other metals as well. As abhorrent to me as it was, the decision to revert control of my investment decisions to the objectivity of reason was the best thing I have ever done, lest I wind up on the scrap heap of failed promises and broken dreams.

To a very large degree, I still bear the scars of a criminal assault by those wielding both power and influence over the masses by way of ruthless control of the legislative and judicial branches of government. Alas, my only defense has been to simplify things to where gold is simply a beachball, being temporarily held beneath the surface by an overzealous and underpowered toddler.

Simple, no?

As measured by the SPDR Gold Shares ETF (GLD:NYSE) the giant ETF whose contained ounces have actually dropped on a year-to-date basis despite recent improvements, the gold market is currently in pullback mode, down approximately 3.72% from the recent top at $225.09. As astonishing as the constant drain of ounces from the GLD inventory, the very fact that it is occurring confirms a highly bullish fact: nobody believes the move. If we had GLD inventory rising sharply, we would know that the western retail public has finally and at long last “bought-in” to the notion that gold actually belongs in a portfolio, right up there beside APPL MSFT and Pets.com.

Technically, however, the pullback that began on April 12 is now in its third full week with both MACD and MFI on “sell signals” but with the RSI now down into the 57 area after spending the better part of six weeks in overbought status with a peak in the mid-80s. That is the bad news.

The good news is that GLD is nudging up against an uptrend line that dates back to the February lows around $184. If GLD can trade sideways for another few days allowing the RSI to retrace into the 40’s, it may stand a chance that we get a run to the highs first before anything more serious occurs. Failing that, the 38.2% Fibonacci retracement level is at $203.35, which for June Gold futures is around $2,220, and that level, while painful, would still leave the GLD market in great technical shape for a move to new highs by year-end. I remain a bull on gold and see GLD moving to around $246 on the next advance, which would be about $2,650 for June gold.

As for the junior gold explorers or developers, I continue to hold Getchell Gold Corp. (GTCH:CSE; GGLDF:OTCQB) as my premier selection. With 2,059,900 ounces of gold in the indicated and inferred category, the company now has a new Chairman, Robert Bass. He and his son Chris were added to the Board of Directors in January, which means that the insider group owns and/or controls over 20% of the issued capital.

Prior to those appointments, the number was closer to 1%. The company is busy completing metallurgical studies on the Fondaway Canyon ore in advance of a PEA expected by June. With the deposit wide open in all directions as to strike and to depth, there is considerable upside to resource and the share price. While the old timers tell me that gold ounces in Nevada should trade at $100/ounce, I have not seen anywhere near that number since 2011, and in fact, desperation deals in the past year were being done at $5-10 an ounce as funding completely disappeared and liquidity evaporated.

The good news for companies like GTCH came in the form of the Newmont Corp. (NEM:NYSE) earnings, which absolutely knocked the cover off the ball. Back in February, when the world of armchair gold analysts (wearing stupid oversized cowboy hats) were calling Newmont a “POS company” and bragging to the world that they were selling their stock, I tweeted out to my followers that it was the best “contrarian buy” of the year. I said then that Newmont was spending month after month acquiring companies with big gold assets and, in some cases, paying up (as in “too much”) as in their bid last year for Australian-based Newbridge Gold.

Well, how do those acquisitions look now? Their earnings soared, as did gold production, while AISC dropped sharply in direct contrast to the share price, up over 40% since they got thrown under the proverbial bus back in February. (I must confess that I did not include in my note to subscribers because I was more than adequately represented in senior gold allocation by way of Freeport, which still stands as Freeport has been a beast.) Then, late last week, Agnico Eagle reported their earnings, and they, too, blew the doors off and went out for the week at multi-year highs, but with record earnings and free cash flow, the stock is still 18.6% from its all-time high last seen in September 2020.

I believe that in the old horse chestnut that “there ain’t no fever like GOLD fever,” and if last week was just a fractional tidbit of a rotation by the monster generalist funds into the gold space, then I shudder to think what a move to a 5% allocation will look like as we had in the late 1970’s given that gold miner allocations are estimated to be in the fractions of a percent range today.

As these leviathan funds suddenly discover that they simply cannot own enough of the Newmonts and Barricks and Agnicos of the world, they will migrate down the ladder of quality and size, finally adding ounces of any size and shape and regardless of location, style, or depth. It is at this point in the equation that ounces in Nevada will indeed be priced not at USD $100 per ounce but at $300-500 per ounce.

Getchell Gold is valued at $13.36 per ounce of gold and is located in the heart of the best mining jurisdiction in the world — Nevada — and which is wide open to depth and long strike with what could easily evolve into a Tier One asset (5mm ounces or more) with further drilling and if course the blessing of the two goddesses of the junior mining world — Mother Nature and Lady Luck.

While it has been an excruciatingly long wait, I see a huge upside in the entire group of junior gold developers, but what attracts me to GTCH is that they are both developing an existing and growing resource while exploring for much, much more.


Important Disclosures:

  1. As of the date of this article, officers and/or employees of Streetwise Reports LLC (including members of their household) own securities of Cameco Corp., Western Uranium & Vanadium Corp., American Eagel Gold Corp., Vortex Metals Inc. and Getchell Gold Corp.
  2. Michael Ballanger: I, or members of my immediate household or family, own securities of: All. My company has a financial relationship with Fotzroy Minerals. I determined which companies would be included in this article based on my research and understanding of the sector.
  3. Statements and opinions expressed are the opinions of the author and not of Streetwise Reports, Street Smart, or their officers. The author is wholly responsible for the accuracy of the statements. Streetwise Reports was not paid by the author to publish or syndicate this article. Streetwise Reports requires contributing authors to disclose any shareholdings in, or economic relationships with, companies that they write about. Any disclosures from the author can be found  below. Streetwise Reports relies upon the authors to accurately provide this information and Streetwise Reports has no means of verifying its accuracy.
  4.  This article does not constitute investment advice and is not a solicitation for any investment. Streetwise Reports does not render general or specific investment advice and the information on Streetwise Reports should not be considered a recommendation to buy or sell any security. Each reader is encouraged to consult with his or her personal financial adviser and perform their own comprehensive investment research. By opening this page, each reader accepts and agrees to Streetwise Reports’ terms of use and full legal disclaimer. Streetwise Reports does not endorse or recommend the business, products, services or securities of any company.

For additional disclosures, please click here.

Michael Ballanger Disclosures

This letter makes no guarantee or warranty on the accuracy or completeness of the data provided. Nothing contained herein is intended or shall be deemed to be investment advice, implied or otherwise. This letter represents my views and replicates trades that I am making but nothing more than that. Always consult your registered advisor to assist you with your investments. I accept no liability for any loss arising from the use of the data contained on this letter. Options and junior mining stocks contain a high level of risk that may result in the loss of part or all invested capital and therefore are suitable for experienced and professional investors and traders only. One should be familiar with the risks involved in junior mining and options trading and we recommend consulting a financial adviser if you feel you do not understand the risks involved.

FXTM’s Copper: Hits fresh two-year high!

By ForexTime

  • FXTM launches 10 new commodities!
  • Copper jumps to two-year high
  • Prices up almost 20% year-to-date
  • Bulls in control on H4/D1 charts
  • Key levels of interest at $4.58, $4.54 & $4.50

In case you missed it, FXTM’s new Copper commodity has just hit a fresh two-year high!

Prices punched above $4.65 per pound on Tuesday morning thanks to fundamental forces.

Note: COMEX Copper is priced per pound.

Before we cover the fundamentals, here are some fun facts about copper:

  • 3rd most widely used metal in the world.
  • Used in buildings, electronic products, machinery and transportation.
  • Chile has the world’s largest copper mine.
  • China is the world’s largest consumer.
  • Hit all-time high of $5.01 in March 2022


Now here are the basics:


What is Copper?

It is a shiny, reddish, and malleable metal widely used in our everyday lives.

This metal has major industrial uses and is an essential nutrient in our daily diet!

What does FXTM’s Copper track?

FXTM’s Copper tracks Copper futures on the New York Mercantile Exchange’s COMEX division.

COMEX is an abbreviation of the Commodity Exchange Inc.

Note: Unlike other metals like gold and silver, copper futures are traded as a commodity.

The lowdown…

Copper prices have been trending higher in recent months.

The commodity has gained almost 20% since the start of 2024 due to supply-side factors and expectations around booming demand.

  • In December, Cobre Panama one of the world’s largest copper mines was forced to stop operations.
  • Earlier this month, metal exchanges were prohibited from accepting new Russian production of copper, aluminum and nickel.
  • Zambia, Africa’s second-largest copper producer was hit by power cuts.

The bigger picture

It is not only supply shortages that have boosted copper prices.

The clean energy transition and artificial intelligence projects could fuel upside gains.

Copper remains in hot demand because of its use in electronic devices. But it is also a crucial component in the creation of solar panels, wind turbines and hydro systems.

What does this mean?

Well according to the International Copper Study Group (ICSG), world copper mine production in 2024 has been revised down to 0.5% compared to the 3.7% forecast in October 2023.

In addition, demand is expected to increase by 2% in 2024 and jump to 2.5% in 2025!

With production falling and demand rising, this could spell more gains for copper down the road.

Looking at the technicals…

Prices are firmly bullish on the daily charts with bulls in a position of power.

However, a technical throwback could be in play on the H1 charts with prices testing potential support levels.

  • Sustained weakness below $4.58 may encourage a decline towards the 100-day SMA and $4.50.
  • Should prices rebound from the 100-day SMA, this could trigger a move back towards $4.58, $4.60 and $4.65.


Forex-Time-LogoArticle by ForexTime

ForexTime Ltd (FXTM) is an award winning international online forex broker regulated by CySEC 185/12 www.forextime.com

Gold price recovers amid uncertain US economic outlook

By RoboForex Analytical Department

The price of a troy ounce of gold climbed to 2330.00 USD on Friday. This surge was driven by investors’ ongoing evaluation of the potential direction of the US Federal Reserve’s monetary policy following mixed macroeconomic data.

The US GDP for Q1 did not meet expectations, marking the slowest recovery in two years. The economy expanded by only 1.6%, significantly lower than the forecasted 2.5%. In contrast, GDP growth in Q4 2023 reached 3.4%. The Fed’s consensus forecast for 2024 expects economic growth of 2.1%.

The underwhelming economic performance might prompt the Fed to consider a reduction in interest rates. However, a localised acceleration in consumer inflation suggests that monetary policy might remain restrictive for longer.

As long as interest rates remain high, gold’s appeal as an investment option is somewhat diminished since it does not generate its yield as bonds do. Nonetheless, in times of rising inflation, gold increasingly becomes a valuable hedge against currency devaluation.

Today, the stock exchange will focus on the March Core PCE figures. These data are expected to provide further insights into the Federal Reserve’s monetary policy outlook.

Technical analysis of XAU/USD

On the H4 chart of XAU/USD, a consolidation range has formed above 2346.00, with the ongoing development of the third wave of decline aiming for 2262.22. The local target for this wave at 2296.96 has been reached. Today, a corrective move towards 2346.00 is expected, followed by an anticipated further decline to 2262.22. This bearish scenario is supported technically by the MACD indicator, whose signal line is below zero and is trending downwards towards new lows.

On the H1 chart, the corrective movement towards 2346.00 (testing from below) is continuing. Once completed, a new downward wave towards 2277.00 is expected, potentially reaching 2262.22. This outlook is confirmed by the Stochastic oscillator, with its signal line currently above 80 but poised for a decline towards 20.


Disclaimer

Any forecasts contained herein are based on the author’s particular opinion. This analysis may not be treated as trading advice. RoboForex bears no responsibility for trading results based on trading recommendations and reviews contained herein.

COT Metals Charts: Speculator bets led by Copper & Silver

By InvestMacro

Here are the latest charts and statistics for the Commitment of Traders (COT) data published by the Commodities Futures Trading Commission (CFTC).

The latest COT data is updated through Tuesday April 16th and shows a quick view of how large traders (for-profit speculators and commercial entities) were positioned in the futures markets.

Weekly Speculator Changes led by Copper

The COT metals markets speculator bets were lower this week as just two out of the six metals markets we cover had higher positioning while the other four markets had lower speculator contracts.

Leading the gains for the metals was Copper  with a gain by 4,875 contracts followed by Silver with a small gain of 147 contracts for the week.

The markets with declines in speculator bets for the week were Steel (-1,459 contracts), Platinum (-766 contracts), Gold (-496 contracts) and with Palladium (-268 contracts) also registering lower bets on the week.


Metals Net Speculators Leaderboard

Legend: Weekly Speculators Change | Speculators Current Net Position | Speculators Strength Score compared to last 3-Years (0-100 range)


Strength Scores led by Silver & Copper

COT Strength Scores (a normalized measure of Speculator positions over a 3-Year range, from 0 to 100 where above 80 is Extreme-Bullish and below 20 is Extreme-Bearish) showed that Silver (100 percent), Copper (93 percent) and Steel (86 percent) led the metals markets this week. Gold (67 percent) and Platinum (67 percent) come in as the next highest in the weekly strength scores and above the mid-point level of 50 percent (over the past 3-years).

On the downside, Palladium (27 percent) comes in at the lowest strength level currently.

Strength Statistics:
Gold (67.4 percent) vs Gold previous week (67.6 percent)
Silver (100.0 percent) vs Silver previous week (99.8 percent)
Copper (93.1 percent) vs Copper previous week (87.6 percent)
Platinum (66.7 percent) vs Platinum previous week (68.8 percent)
Palladium (27.0 percent) vs Palladium previous week (28.6 percent)
Steel (85.9 percent) vs Palladium previous week (91.5 percent)


Platinum & Copper top the 6-Week Strength Trends

COT Strength Score Trends (or move index, calculates the 6-week changes in strength scores) showed that Platinum (60 percent) and Copper (59 percent) lead the past six weeks trends for metals with strong trend score increases.

Steel (-4 percent) leads the downside trend scores currently and is the only market with lower 6-week trend scores.

Move Statistics:
Gold (4.8 percent) vs Gold previous week (27.3 percent)
Silver (37.9 percent) vs Silver previous week (58.5 percent)
Copper (59.1 percent) vs Copper previous week (49.5 percent)
Platinum (60.4 percent) vs Platinum previous week (41.1 percent)
Palladium (21.5 percent) vs Palladium previous week (21.4 percent)
Steel (-4.0 percent) vs Steel previous week (6.3 percent)


Individual Markets:

Gold Comex Futures:

Gold Futures COT ChartThe Gold Comex Futures large speculator standing this week resulted in a net position of 201,923 contracts in the data reported through Tuesday. This was a weekly lowering of -496 contracts from the previous week which had a total of 202,419 net contracts.

This week’s current strength score (the trader positioning range over the past three years, measured from 0 to 100) shows the speculators are currently Bullish with a score of 67.4 percent. The commercials are Bearish with a score of 34.4 percent and the small traders (not shown in chart) are Bearish with a score of 41.1 percent.

Price Trend-Following Model: Strong Uptrend

Our weekly trend-following model classifies the current market price position as: Strong Uptrend. The current action for the model is considered to be: Hold – Maintain Long Position.

Gold Futures StatisticsSPECULATORSCOMMERCIALSSMALL TRADERS
– Percent of Open Interest Longs:53.925.79.7
– Percent of Open Interest Shorts:14.968.75.7
– Net Position:201,923-222,75820,835
– Gross Longs:278,777132,68450,245
– Gross Shorts:76,854355,44229,410
– Long to Short Ratio:3.6 to 10.4 to 11.7 to 1
NET POSITION TREND:
– Strength Index Score (3 Year Range Pct):67.434.441.1
– Strength Index Reading (3 Year Range):BullishBearishBearish
NET POSITION MOVEMENT INDEX:
– 6-Week Change in Strength Index:4.8-6.517.1


Silver Comex Futures:

Silver Futures COT ChartThe Silver Comex Futures large speculator standing this week resulted in a net position of 53,359 contracts in the data reported through Tuesday. This was a weekly rise of 147 contracts from the previous week which had a total of 53,212 net contracts.

This week’s current strength score (the trader positioning range over the past three years, measured from 0 to 100) shows the speculators are currently Bullish-Extreme with a score of 100.0 percent. The commercials are Bearish-Extreme with a score of 0.4 percent and the small traders (not shown in chart) are Bullish-Extreme with a score of 81.5 percent.

Price Trend-Following Model: Strong Uptrend

Our weekly trend-following model classifies the current market price position as: Strong Uptrend. The current action for the model is considered to be: Hold – Maintain Long Position.

Silver Futures StatisticsSPECULATORSCOMMERCIALSSMALL TRADERS
– Percent of Open Interest Longs:46.926.418.6
– Percent of Open Interest Shorts:16.568.56.8
– Net Position:53,359-74,02820,669
– Gross Longs:82,41546,44232,658
– Gross Shorts:29,056120,47011,989
– Long to Short Ratio:2.8 to 10.4 to 12.7 to 1
NET POSITION TREND:
– Strength Index Score (3 Year Range Pct):100.00.481.5
– Strength Index Reading (3 Year Range):Bullish-ExtremeBearish-ExtremeBullish-Extreme
NET POSITION MOVEMENT INDEX:
– 6-Week Change in Strength Index:37.9-36.522.2


Copper Grade #1 Futures:

Copper Futures COT ChartThe Copper Grade #1 Futures large speculator standing this week resulted in a net position of 47,569 contracts in the data reported through Tuesday. This was a weekly increase of 4,875 contracts from the previous week which had a total of 42,694 net contracts.

This week’s current strength score (the trader positioning range over the past three years, measured from 0 to 100) shows the speculators are currently Bullish-Extreme with a score of 93.1 percent. The commercials are Bearish-Extreme with a score of 7.8 percent and the small traders (not shown in chart) are Bullish with a score of 72.2 percent.

Price Trend-Following Model: Strong Uptrend

Our weekly trend-following model classifies the current market price position as: Strong Uptrend. The current action for the model is considered to be: Hold – Maintain Long Position.

Copper Futures StatisticsSPECULATORSCOMMERCIALSSMALL TRADERS
– Percent of Open Interest Longs:48.323.27.8
– Percent of Open Interest Shorts:32.442.04.9
– Net Position:47,569-56,0868,517
– Gross Longs:144,59069,56023,259
– Gross Shorts:97,021125,64614,742
– Long to Short Ratio:1.5 to 10.6 to 11.6 to 1
NET POSITION TREND:
– Strength Index Score (3 Year Range Pct):93.17.872.2
– Strength Index Reading (3 Year Range):Bullish-ExtremeBearish-ExtremeBullish
NET POSITION MOVEMENT INDEX:
– 6-Week Change in Strength Index:59.1-60.037.2


Platinum Futures:

Platinum Futures COT ChartThe Platinum Futures large speculator standing this week resulted in a net position of 18,241 contracts in the data reported through Tuesday. This was a weekly decline of -766 contracts from the previous week which had a total of 19,007 net contracts.

This week’s current strength score (the trader positioning range over the past three years, measured from 0 to 100) shows the speculators are currently Bullish with a score of 66.7 percent. The commercials are Bearish with a score of 34.6 percent and the small traders (not shown in chart) are Bearish with a score of 40.0 percent.

Price Trend-Following Model: Weak Downtrend

Our weekly trend-following model classifies the current market price position as: Weak Downtrend. The current action for the model is considered to be: Hold – Maintain Short Position.

Platinum Futures StatisticsSPECULATORSCOMMERCIALSSMALL TRADERS
– Percent of Open Interest Longs:64.118.910.9
– Percent of Open Interest Shorts:41.847.84.3
– Net Position:18,241-23,6145,373
– Gross Longs:52,43015,4948,927
– Gross Shorts:34,18939,1083,554
– Long to Short Ratio:1.5 to 10.4 to 12.5 to 1
NET POSITION TREND:
– Strength Index Score (3 Year Range Pct):66.734.640.0
– Strength Index Reading (3 Year Range):BullishBearishBearish
NET POSITION MOVEMENT INDEX:
– 6-Week Change in Strength Index:60.4-49.7-30.0


Palladium Futures:

Palladium Futures COT ChartThe Palladium Futures large speculator standing this week resulted in a net position of -9,034 contracts in the data reported through Tuesday. This was a weekly fall of -268 contracts from the previous week which had a total of -8,766 net contracts.

This week’s current strength score (the trader positioning range over the past three years, measured from 0 to 100) shows the speculators are currently Bearish with a score of 27.0 percent. The commercials are Bullish with a score of 76.2 percent and the small traders (not shown in chart) are Bearish with a score of 42.3 percent.

Price Trend-Following Model: Weak Downtrend

Our weekly trend-following model classifies the current market price position as: Weak Downtrend. The current action for the model is considered to be: Hold – Maintain Short Position.

Palladium Futures StatisticsSPECULATORSCOMMERCIALSSMALL TRADERS
– Percent of Open Interest Longs:26.056.47.7
– Percent of Open Interest Shorts:69.313.17.6
– Net Position:-9,0349,02410
– Gross Longs:5,41411,7591,599
– Gross Shorts:14,4482,7351,589
– Long to Short Ratio:0.4 to 14.3 to 11.0 to 1
NET POSITION TREND:
– Strength Index Score (3 Year Range Pct):27.076.242.3
– Strength Index Reading (3 Year Range):BearishBullishBearish
NET POSITION MOVEMENT INDEX:
– 6-Week Change in Strength Index:21.5-21.1-0.1


Steel Futures Futures:

Steel Futures COT ChartThe Steel Futures large speculator standing this week resulted in a net position of -2,730 contracts in the data reported through Tuesday. This was a weekly fall of -1,459 contracts from the previous week which had a total of -1,271 net contracts.

This week’s current strength score (the trader positioning range over the past three years, measured from 0 to 100) shows the speculators are currently Bullish-Extreme with a score of 85.9 percent. The commercials are Bearish-Extreme with a score of 14.8 percent and the small traders (not shown in chart) are Bearish with a score of 39.5 percent.

Price Trend-Following Model: Downtrend

Our weekly trend-following model classifies the current market price position as: Downtrend. The current action for the model is considered to be: Hold – Maintain Short Position.

Steel Futures StatisticsSPECULATORSCOMMERCIALSSMALL TRADERS
– Percent of Open Interest Longs:12.182.31.4
– Percent of Open Interest Shorts:22.672.01.2
– Net Position:-2,7302,66565
– Gross Longs:3,11921,291364
– Gross Shorts:5,84918,626299
– Long to Short Ratio:0.5 to 11.1 to 11.2 to 1
NET POSITION TREND:
– Strength Index Score (3 Year Range Pct):85.914.839.5
– Strength Index Reading (3 Year Range):Bullish-ExtremeBearish-ExtremeBearish
NET POSITION MOVEMENT INDEX:
– 6-Week Change in Strength Index:-4.03.610.5


Article By InvestMacroReceive our weekly COT Newsletter

*COT Report: The COT data, released weekly to the public each Friday, is updated through the most recent Tuesday (data is 3 days old) and shows a quick view of how large speculators or non-commercials (for-profit traders) were positioned in the futures markets.

The CFTC categorizes trader positions according to commercial hedgers (traders who use futures contracts for hedging as part of the business), non-commercials (large traders who speculate to realize trading profits) and nonreportable traders (usually small traders/speculators) as well as their open interest (contracts open in the market at time of reporting). See CFTC criteria here.

Gold hits record high amid growing geopolitical tensions

By RoboForex Analytical Department

Gold prices have soared past 2400.00 USD, reaching a new record high on Friday. This marks the fifth consecutive week of gains for the precious metal, fuelled by increasing market demand for “safe-haven” assets amid escalating geopolitical tensions and uncertain global economic conditions.

The recent sharp increase in geopolitical tensions, particularly in the Middle East, has overshadowed optimistic remarks from Federal Reserve officials. The Fed’s monetary authorities are currently inclined towards gradual interest rate cuts throughout the year, given the persistent strength of inflation and the robust state of the US economy. However, the deepening conflict, especially with Iran’s involvement, has heightened concerns about the stability of the region, diminishing hopes for a quick diplomatic resolution.

Gold’s role as a defensive asset has been reinforced under these circumstances, with expectations that its price could climb even higher if the Middle East conflict continues escalating. Investor interest in gold will likely to persist as long as the situation remains volatile.

The focus on gold as a safe investment has largely overshadowed other economic indicators, including fluctuations in the value of the US dollar and other currencies.

Technical analysis of XAU/USD

On the H4 chart of XAU/USD, a broad consolidation range has formed around 2379.70. Exiting this range upward opens the potential to target 2437.00. Following this, a correction to the level of 2323.23 might commence, possibly extending to 2183.42. This scenario is supported by the MACD indicator, with its signal line positioned above zero but poised to decline towards new lows.

On the H1 chart, XAU/USD exhibits a diverging “Triangle” formation around 2379.70. A downward movement to 2342.42 could occur, followed by an upward trajectory to 2437.00. Upon reaching this peak, a decline to 2323.23 is anticipated. This corrective movement is the initial target. The Stochastic oscillator, with its signal line currently above 20, is expected to rise towards 80, suggesting potential upward movements within this framework.


Disclaimer

Any forecasts contained herein are based on the author’s particular opinion. This analysis may not be treated as trading advice. RoboForex bears no responsibility for trading results based on trading recommendations and reviews contained herein.