Originating in Greek mythology as a challenge to divine order, the term “hubris” remains a significant theme in literature and life, representing a dangerous belief in one’s own invincibility or superiority. Strictly defined, it is “excessive pride, arrogance, or overconfidence that leads to a person’s downfall, often by causing them to overstep limits, defy gods, or ignore warnings.”
Mark Twain had a different definition that we as humans know all too well. Twain once wrote, “It ain’t what you don’t know that gits ya into trouble. It’s what you know for sure that ain’t exactly so.”
I had a teacher who reminded me at a very young age that making blind assumptions without checking one’s facts is a recipe for disaster and, worse still, embarrassment. “You know what you do when you ‘ASSUME’ something? You make an “ASS” of “U” and “ME.”
In the practice of writing newsletters, one tends to get elevated to the undeserved role of “authority,” as in, “he/she is an authority on gold and silver.” Sometimes, authors of financial newsletters are assigned designations like “guru” or “pundit” or “expert” but the reality of this pastime (as opposed to profession) is that most of us are simply common folks that for some unworldly reason have the intestinal fortitude and rhinoceros-like skin to put their opinions, expert or not, out there in full view for all the world to judge and rejoice or judge and condemn. The rejoicing comes after a particularly good guess (as opposed to calculation) at the future direction and amplitude of a particular stock or commodity. The condemnation occurs when one’s stab at the future direction and amplitude of a particular stock or commodity winds up in the trash bin. Reward or punishment for well-executed speculations is either more or fewer followers, and depending on whether one is paid as a “content provider” or under the subscriber model, loss or gain of people that grew accustomed to one’s accurate (or inaccurate) guesses.
As a young boy, I used to sell papers in the wee hours of weekend mornings at Woodbine Racetrack in northwest Toronto where the industry professionals such as trainers and grooms and jockeys would all arrive as the sun was rising and pay a dime for the “Daily Racing Form” which had all the races and the horses listed along with a list of their last three heats on either the turf (grass) or mud (dirt). One section of the paper featured the section where the handicappers wrote a column with their “touts” for the day’s races, which is where the term “tout sheet” was first derived. There was “Peter’s Picks,” “The Trackman,” and “The OddsMaker” all picking winners, placers, and showers for the expressed benefit of the amateur handicapper or weekend gambler who would lay down their minimum $2 bets with absolute certainty after reading through the hieroglyphics contained in the form.
One day, I decided to keep track of all the picks made by the “expert” race appraisers, so for the next few months of the summer, I wrote down the names of all the horses and where they finished each race. At the same time, I would pick three horses to win, place, and show in the same races, all based on their “colours” which were bay, chestnut, black, brown, or gray. At the end of the season, I tallied up all the results, and to no one’s particular surprise (except mine), a 12-year-old boy picking horses based on the colour of their coats outperformed the “experts” all equipped with 30-odd years of bookmaking and handicapping under their belts.
That is eerily similar to the late 1970s when newsletter guru and former E.F. Hutton Senior Technical Analyst Joe Granville would ask chimpanzees (dressed up as Wall Street bankers) to throw darts at the stock pages of the Wall Street Journal and then compare their track records to those of the “bank trust officers” that are today’s “market strategists.”
The results were all the same. Sometimes the monkeys would be on top of the pack (usually in down markets), and sometimes they would be in the middle of the pack, but rarely did they trail the pack, once again proving that “A Random Walk down Wall Street” author Burton G. Malkiel was more than just a theorist but more of a statistician.
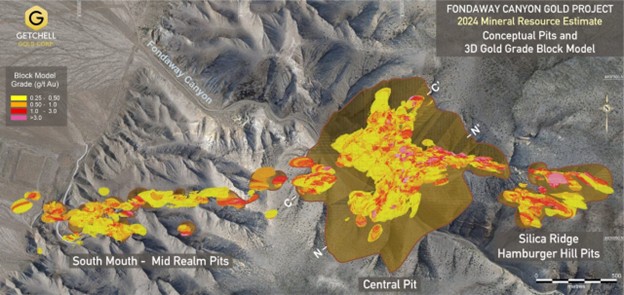
Over the years, I have found that investment success was more common in areas in which I was familiar, such as the junior mining space. I think the reason that my career evolved around commodities and mining was my fascination with those horses at Woodbine. You could look at two dozen horses under two dozen different jockeys, and only in the manner in which both horse and rider displayed a certain “swagger” could one recognize the importance of “presence” in the sport of kings. In a similar manner, CEO’s of successful mining and or exploration companies would emit a similar “swagger” when they entered a boardroom.
The firmness of a handshake or the directness of focus when being introduced seemed to accompany the great ones. However, at the end of the day, even the great ones (like Friedland, Beattie, or Netolitzky) would be the first to admit that really great geologists need an ample serving of good fortune in order to amass enviable track records. Luck does play a big part in any discovery because even the most sophisticated technology in geophysics or geochemistry cannot prevent Mother Nature and Lady Luck from playing a cruel trick with ruthless regularity and tempestuous timing.
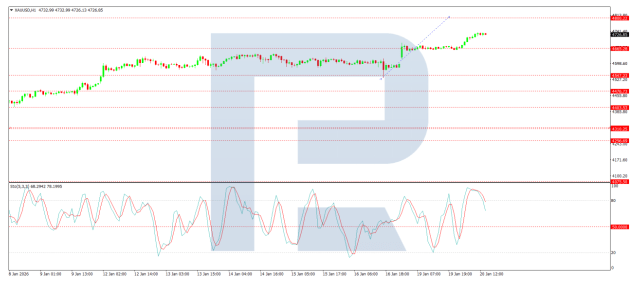
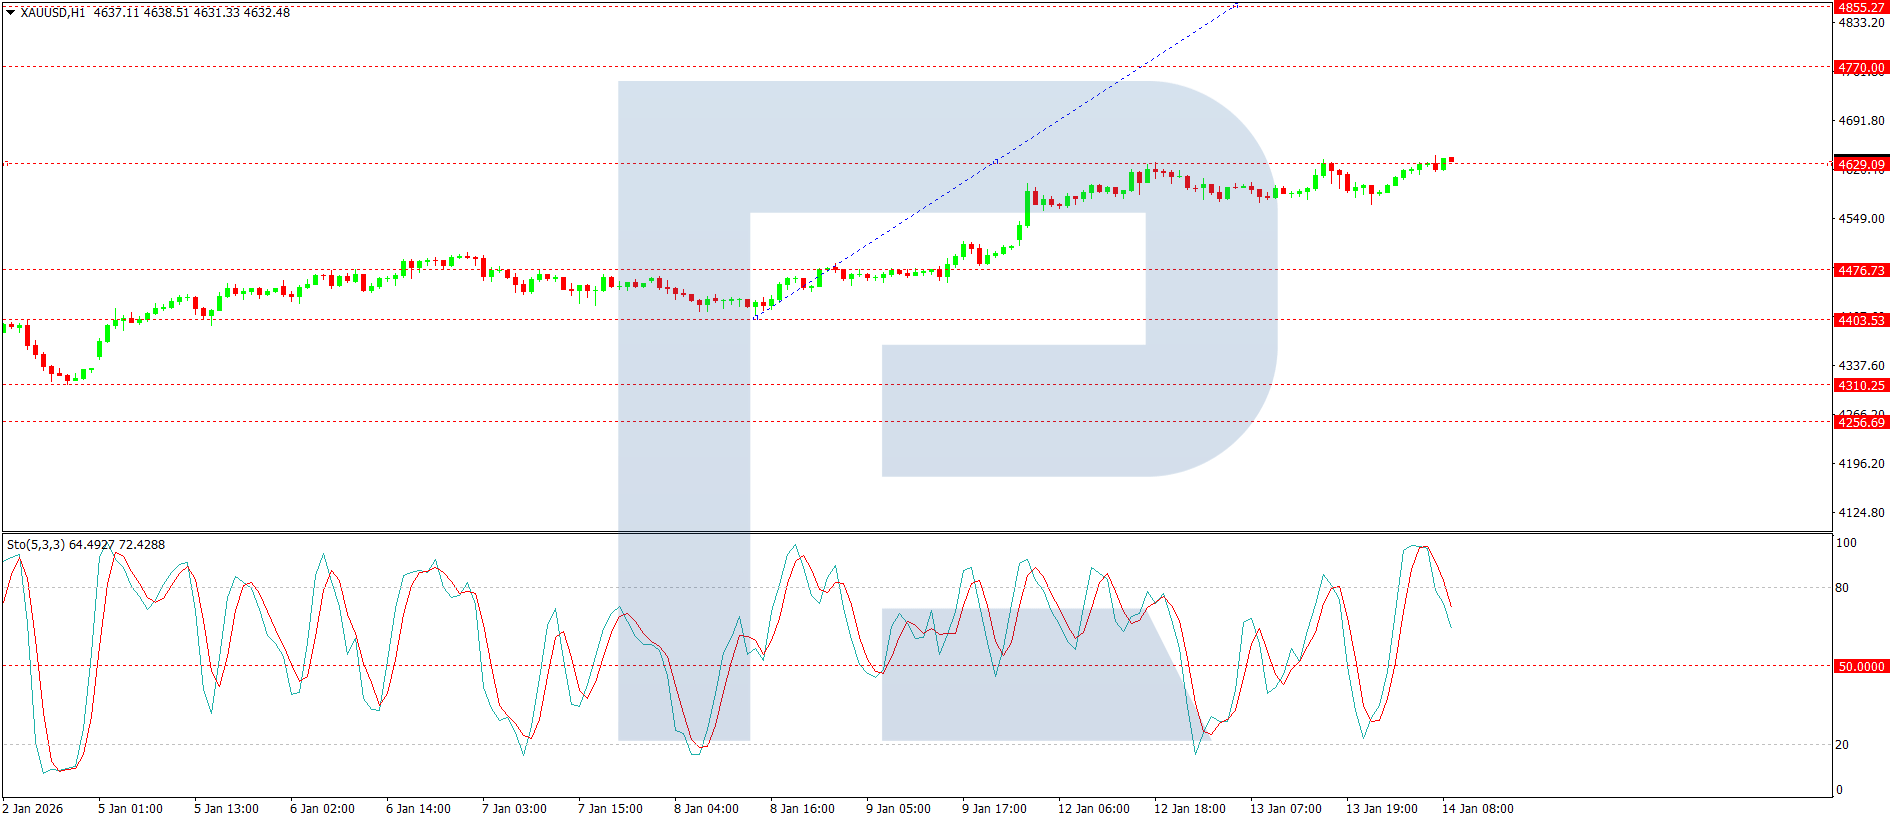
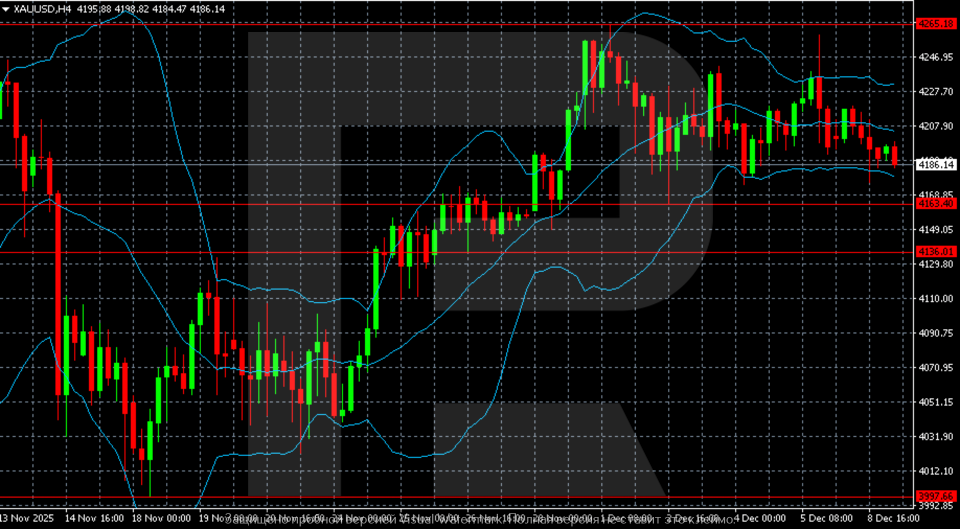
Technical analysts would have us believe that all those squiggly lines on a graph are infinitely more predictive than the soggy leaves at the bottom of a teacup or a wishbone-shaped piece of driftwood in locating subsurface water. However, despite finding personal success in using the tool called “technical analysis” (“TA”) in improving returns, I learned a valuable lesson this past week. About a month ago, with gold prices approaching $4,400, I used TA to identify a series of extreme readings that, in past eras, have led to trend reversals.
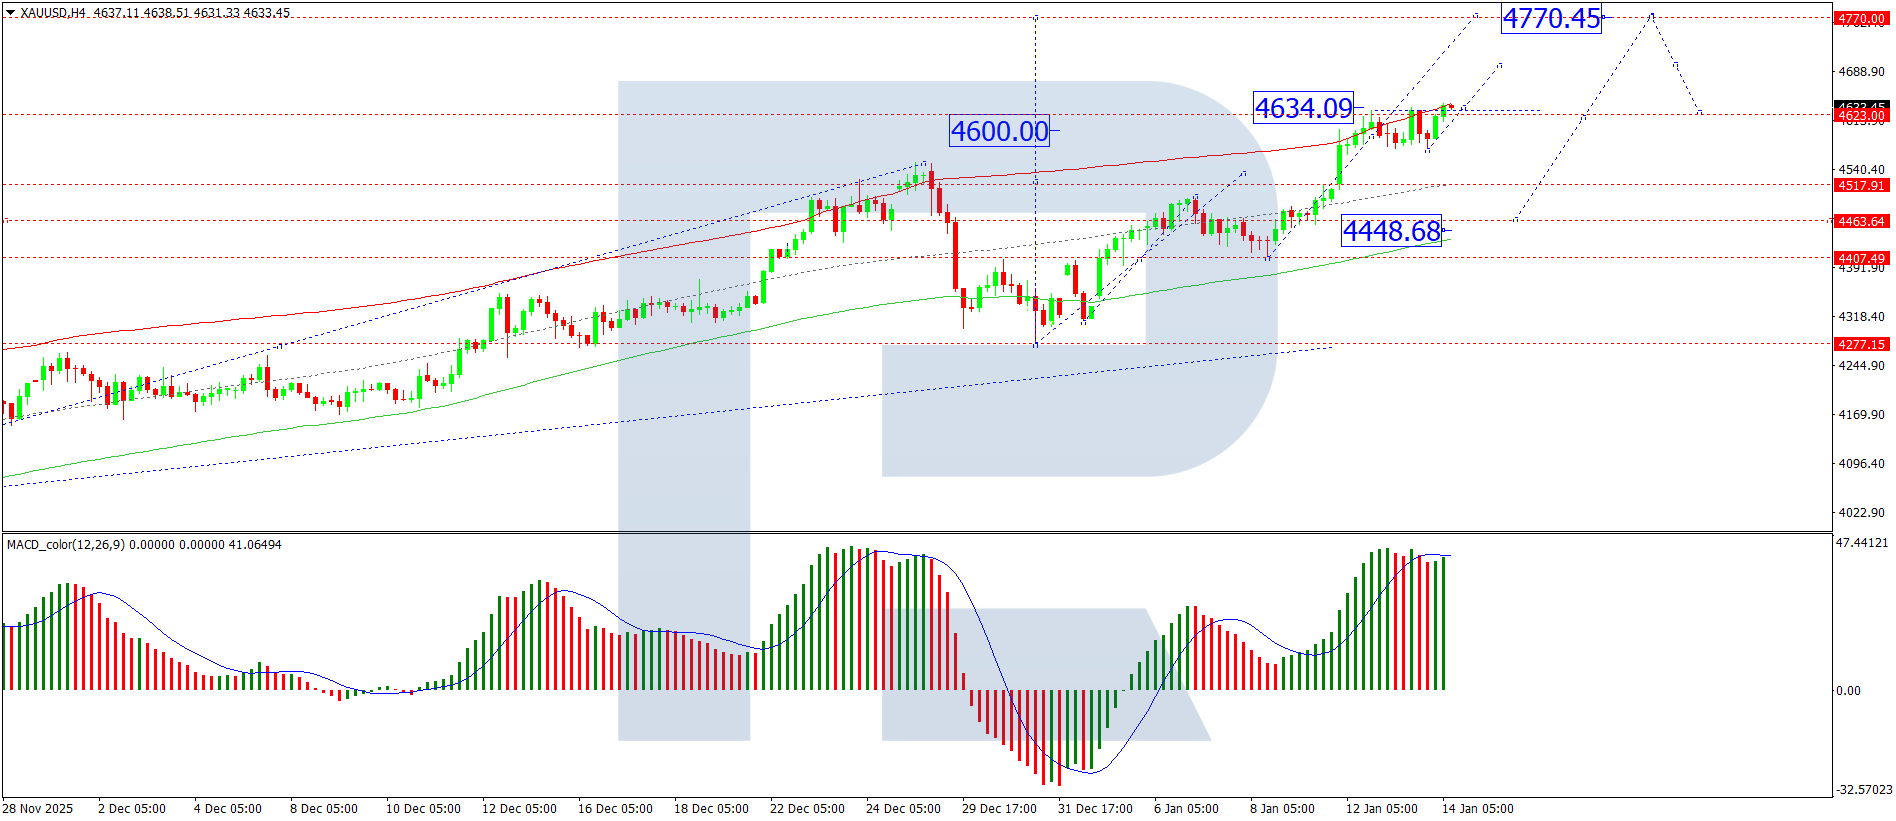
As a result, on October 17, I sent out an email alert calling for a top in gold, which resulted in an outside key reversal day followed by a retest the following Monday that also failed. As a result, my call for the near-term top in gold was then and remains today as a solid one, with February gold still $213 below the top of $4,433 seen the prior Friday.
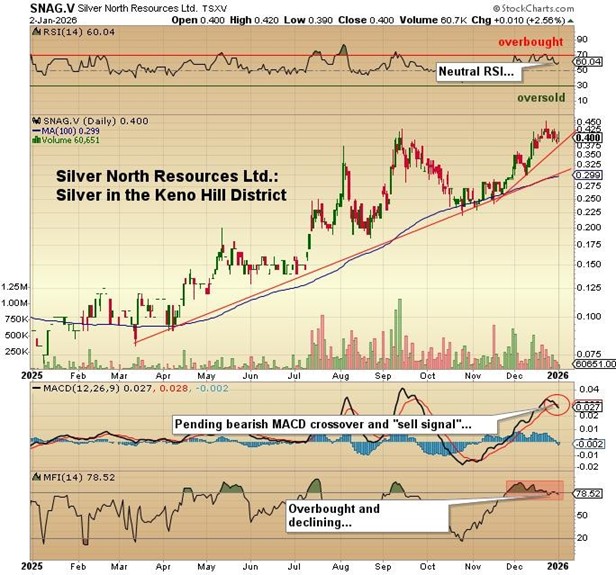
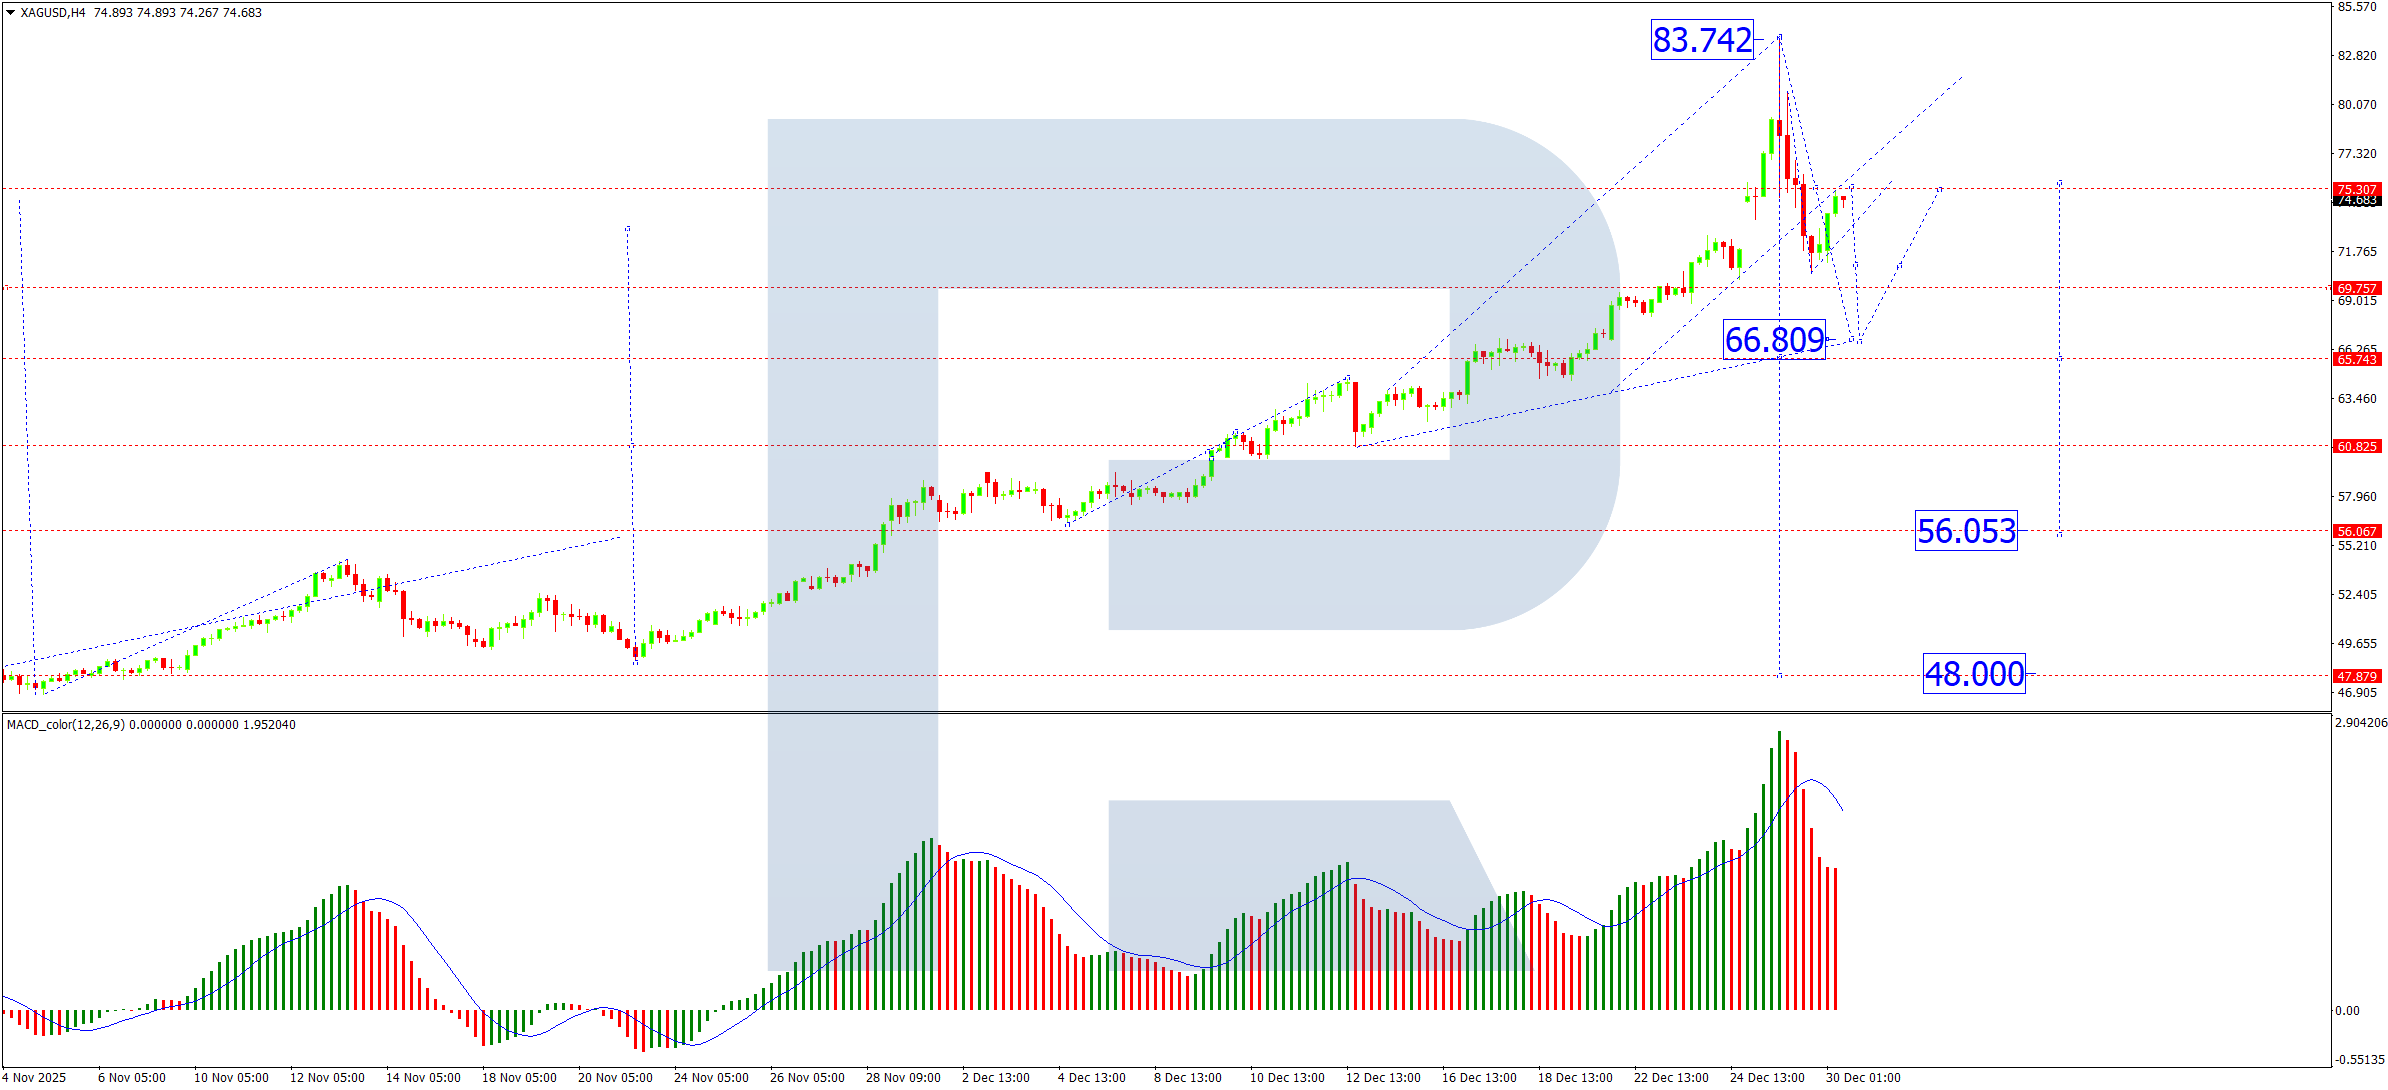
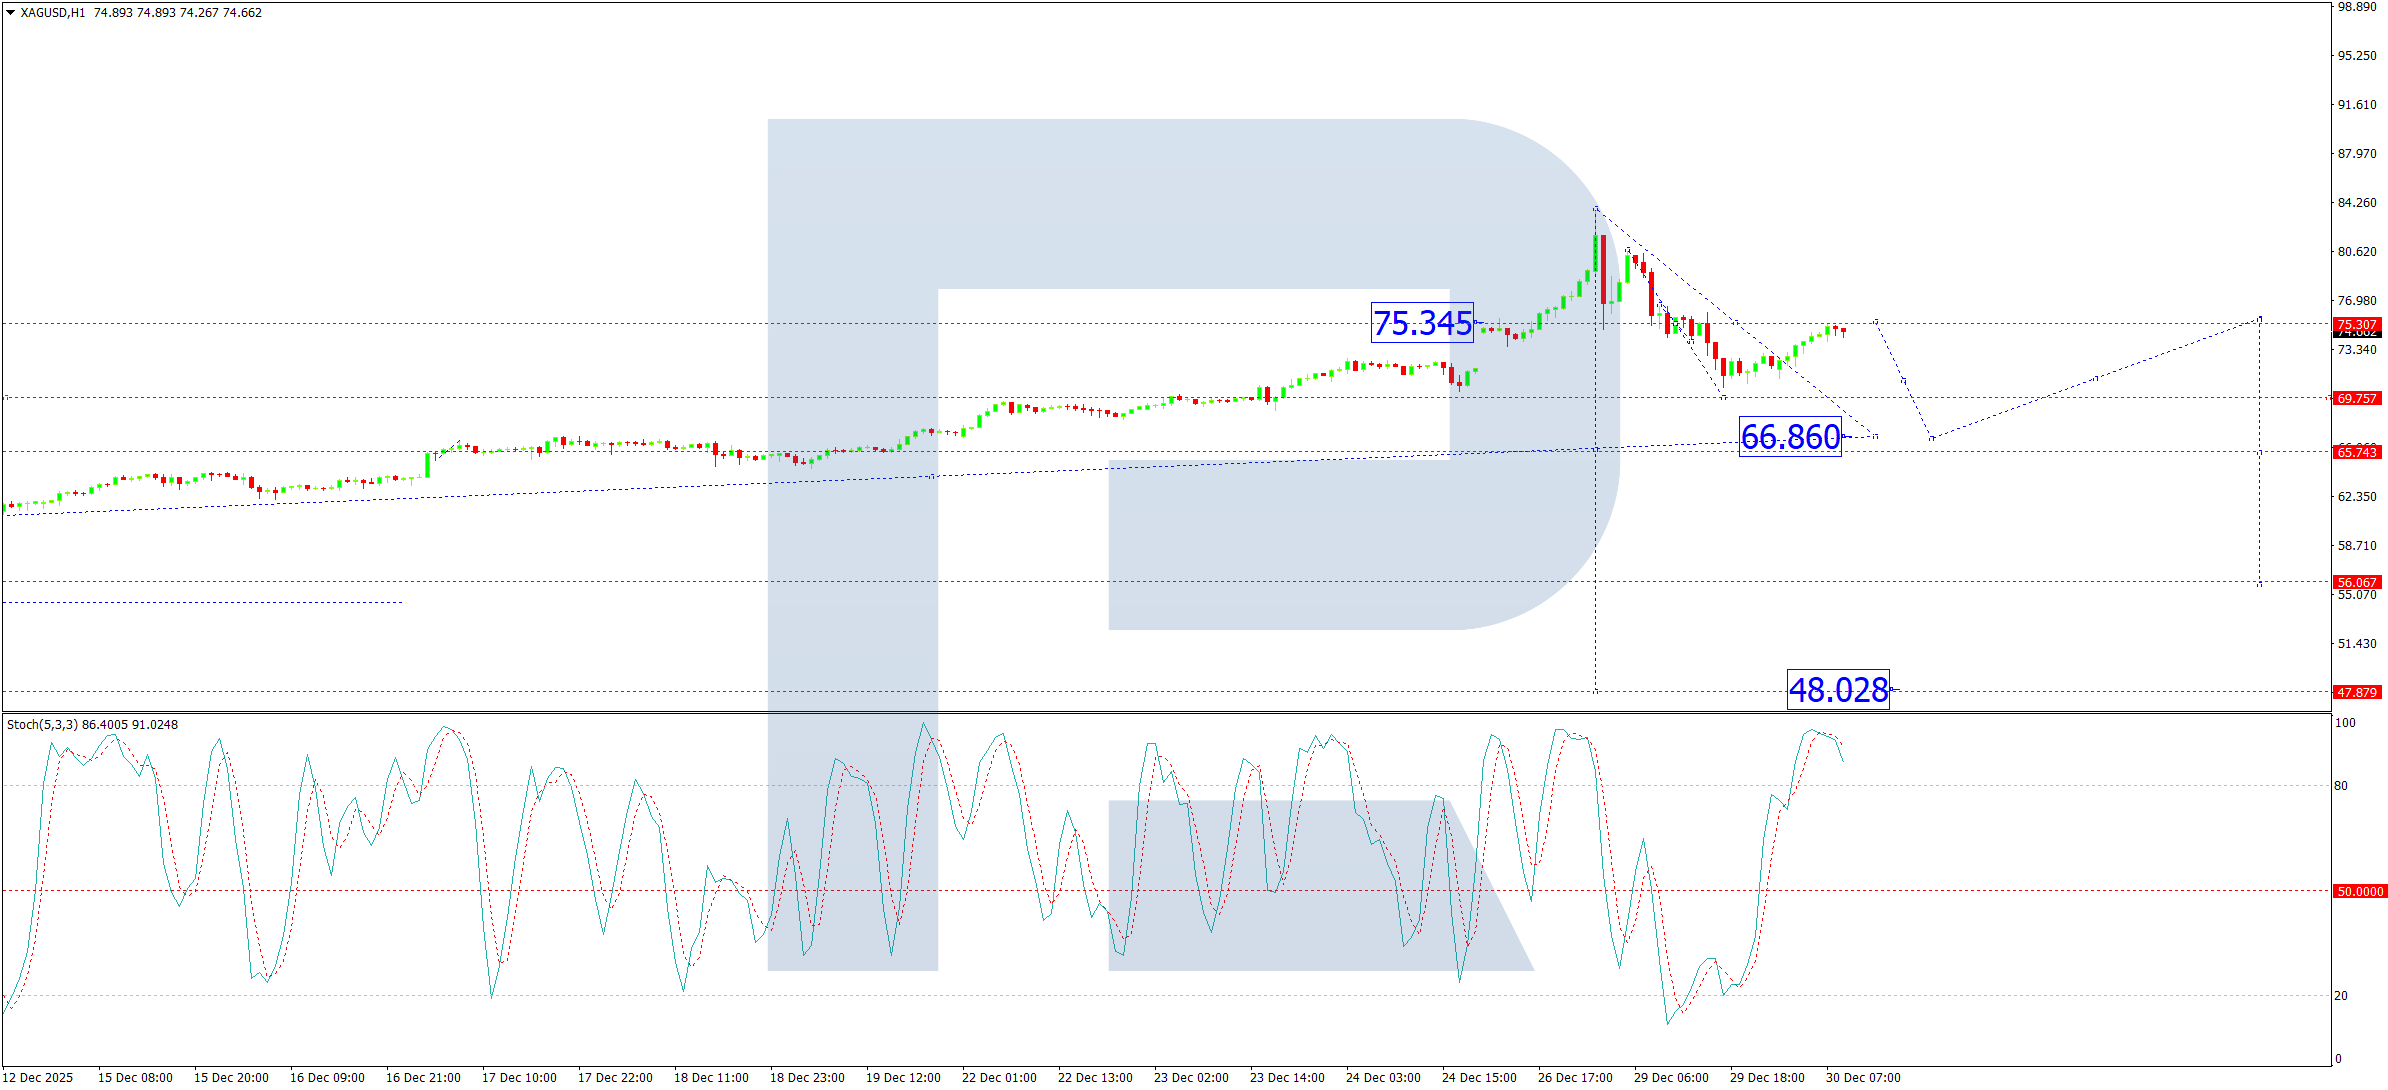
Inflated with inner peace and burgeoning with the pride one feels when a particular call goes well, I waited with the patience of a lion-hunter for another popular metal to display characteristics similar to that of gold. I lurked silently in the bushes until late November, and with all the hubris and swagger of a Secretariat or Northern Dancer approaching the starting gate, I elected to make the call that I now regret, and that call was “Sell silver.” The price was around $57.00 per ounce basis March.
During the week immediately following that call, I began to sense that there had been a kind of shift, as in “there’s been a shift in the force, Luke” from Star Wars fame, as silver spat in the face of GGMA “expertise” and drove northward through $59. On Monday, March silver gapped through $60, and by Thursday, it hit $65.
What changed?
As I sat in my office overlooking the lovely and now-frozen Scugog Swamp listening intently to Fed Chairman Jerome Powell, I decided to write the following to my subscribers:
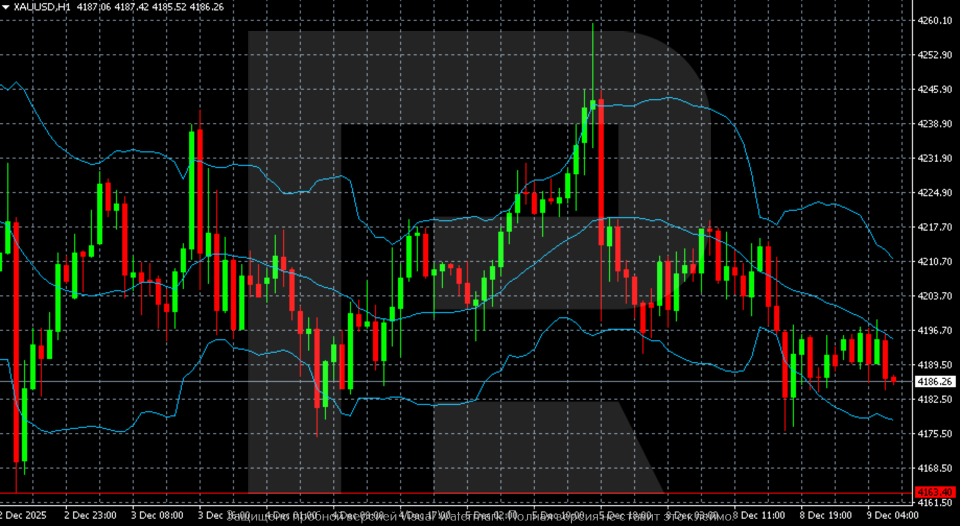
“In keeping with the Fed’s dual mandates of “price stability” and “maximum full employment,” their clandestine third mandate “protecting Wall Street” was delivered wonderfully today by Fed Chairman Jerome Powell as he walked the world through the 2:30 presser with nary a thought about inflation but ample comments about the “weakening jobs market.” Wall Street took that as a “dovish” tilt and took the DJIA to a 600-point gain and the S&P 500 to a 55-point gain. Traders also took the U.S. dollar down with the DXY down .568 to 98.632, and gold from down $30 to up $27, and silver from down $0.27 to up $1.36.
With this kind of cheerleading, the Fed has given traders an early Christmas gift, so my speculation of a weaker, 2018-style close to 2025 must be shuttered. Also, the hedges on gold and silver being used in the GGMA 2025 Trading Account have to be re-examined as the dovish Fed has now thrown the U.S. dollar overboard in favour of easier money. The Fed has also reintroduced a mild form of quantitative easing, or as the commentators called it, “soft QE.” In a scenario of Fed purchases of $40 billion of T-bills every month, we are back to a stimulative environment, which, from where I sit, is patently absurd given the S&P within a chip shot of record highs. Any time the Fed engineers a “risk on” policy move, stocks and the metals always move higher, so to be hedged against a stimulative Fed is at once dangerous and stupid.
I look for traders to now have a free rein to take stocks and the metals higher into year-end. While I will not move to add to any new long positions in the gold or silver space, I now expect February gold to re-test the high of October 19th at $4,433. Gold traders cannot ignore the breathtaking breakout in silver, so I suspect that there will be a lot of short-covering by the end of the month. I will be looking at the RSI and the HUI:US to see if we get a confirmed new high for gold. If we get one, I will open new speculative positions in the leveraged ETFs and in options.”
This week, the HUI:US broke out above the October 15 high of 693.10 and moved to a new record high of 715.70. All that is required for there to be a confirmed new “leg” of the precious metals bull is for February gold to close above $4,433. At Friday’s high, it was $4,387.80, so we are banging on the proverbial door.
I used a phrase in this Thursday’s alert that should be recalled and recited, and that is this: “It is not a sin to be wrong, but it IS a sin to STAY wrong.”
May we never forget the wisdom of that adage.
2026
Moving into 2026 is going to be a very interesting endeavour as I am now forced to begin to formulate the GGMA 2026 Forecast Issue, which seems to be getting more difficult each and every year. The newsletter I write focuses on a given theme each year, after starting off in 2020 with the idea that escalating debt levels in the West would eventually require collateralization of sovereign debt with gold reserves, and whether it was pandemics or regional bank problems, each crisis was met with monetization.
Debt has remained a dominant theme and rationale for gold and silver ownership every year since the service was founded, but in the past two years, the electrification movement and the macroeconomic outlook for copper sent me scurrying for senior and junior opportunities in the northern and southern hemispheres. I used my beloved Freeport-McMoRan Inc. (FCX:NYSE) as a proxy for not only copper but also gold, as the globe’s premier producer of the red metal is also a significant member of the gold club, thanks largely to its part-ownership of the mighty Grasberg Mine in Indonesia.