
By RoboForex Analytical Department
The price of gold (XAUUSD) continues its upward trajectory, hitting a new peak at 2460 USD per troy ounce on Friday. The surge in gold prices is largely driven by growing expectations that the US Federal Reserve will soon reduce interest rates. This anticipation has been bolstered by recent signals from the Fed’s July meeting and weaker-than-expected US economic data.
Recent US manufacturing activity has declined sharply, and unemployment claims have reached a high of 249,000 for the year, indicating potential economic softening. These factors contribute to the speculation of a possible rate cut by the Fed as early as September, contingent on forthcoming economic reports.
Moreover, escalating tensions in the Middle East enhance gold’s appeal as a safe-haven asset, adding another layer of support for the rising prices.
Technical analysis: XAU/USD
Free Reports:
 Sign Up for Our Stock Market Newsletter – Get updated on News, Charts & Rankings of Public Companies when you join our Stocks Newsletter
 Get our Weekly Commitment of Traders Reports - See where the biggest traders (Hedge Funds and Commercial Hedgers) are positioned in the futures markets on a weekly basis.
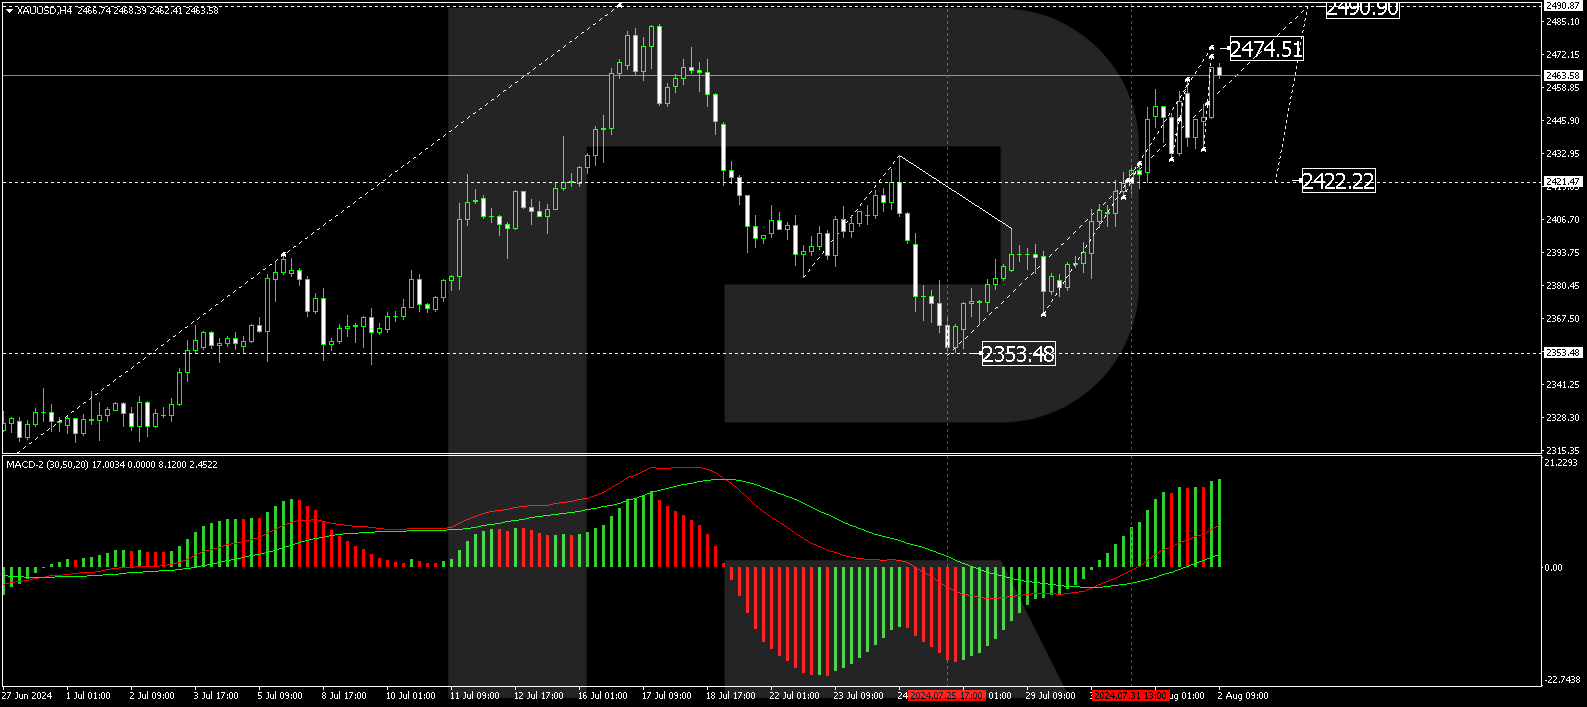
On the H4 chart, XAU/USD performed a growth wave to the level of 2422.22. The market has formed a compact consolidation range around this level, and with the upside exit, the growth wave continues to the level of 2474.50. The target is local. After reaching this level, we will consider the probability of correction to 2422.22 (testing from above). Further, we expect the beginning of a new wave of growth towards 2490.90. Technically, this scenario is confirmed by the MACD indicator, with its signal line above the zero level and trending upwards.
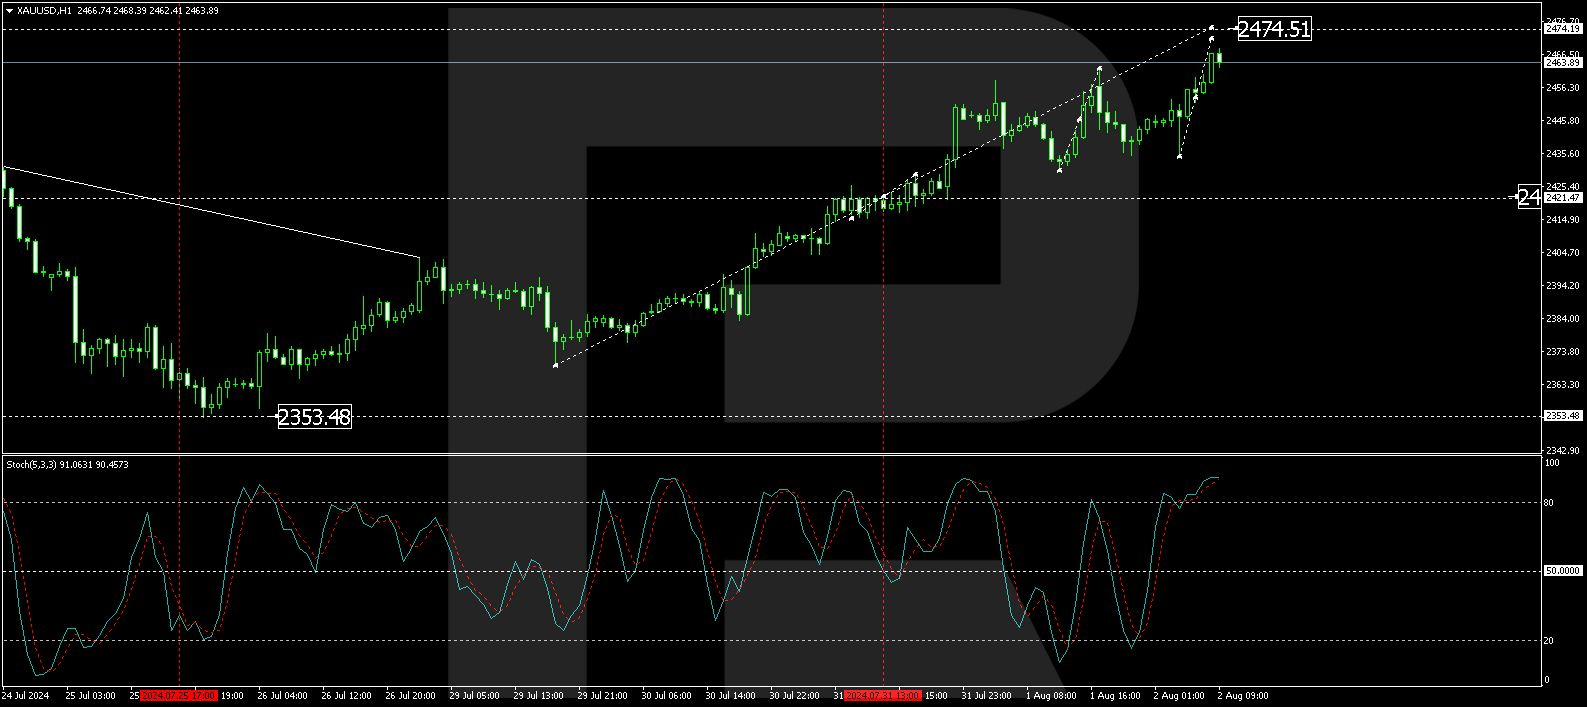
On the H1 chart of XAU/USD, the market has formed a consolidation range around 2446.00. With the upside exit, considering the probability of the wave continuation to the local target of 2474.50 is suggested. After reaching this level, we will consider the likelihood of correction to 2422.22. Technically, this scenario is confirmed by the Stochastic oscillator, with its signal line above 80 and preparing for a decline.
Investors and traders should monitor these levels closely, as developments regarding the Fed’s forthcoming decisions and geopolitical factors could significantly impact further movements in the gold market.
Disclaimer
Any forecasts contained herein are based on the author’s particular opinion. This analysis may not be treated as trading advice. RoboForex bears no responsibility for trading results based on trading recommendations and reviews contained herein.

- EUR/USD: Busy Week Ahead Aug 3, 2026
- Positive sentiment in the AI sector supported stock indices. Oil prices remain volatile Aug 3, 2026
- The Tech‑heavy NASDAQ Index jumped by more than 3.3%. The offshore yuan is trading at its highest level since 2023 Jul 31, 2026
- USD/JPY After Volatility: Multiple Events in One Day Jul 31, 2026
- The US indices sell off amid renewed US-Iran clashes. Oil jumps by 7% Jul 30, 2026
- USD/JPY Temporary in Equilibrium: Multiple Factors in Focus Jul 30, 2026
- GBP/USD at Month’s Lows: The Outlook Remains Weak Jul 29, 2026
- Crude oil falls below $80 per barrel. Australia sees inflation slowdown Jul 29, 2026
- The US Tech sector hit by sell‑off. Oil prices decline on renewed negotiations Jul 28, 2026
- Gold Declines, Focus on Fed and Falling Oil Prices Jul 28, 2026
