By InvestMacro
Here are the latest charts and statistics for the Commitment of Traders (COT) data published by the Commodities Futures Trading Commission (CFTC).
The latest COT data is updated through Tuesday March 24th and shows a quick view of how large traders (for-profit speculators and commercial entities) were positioned in the futures markets.
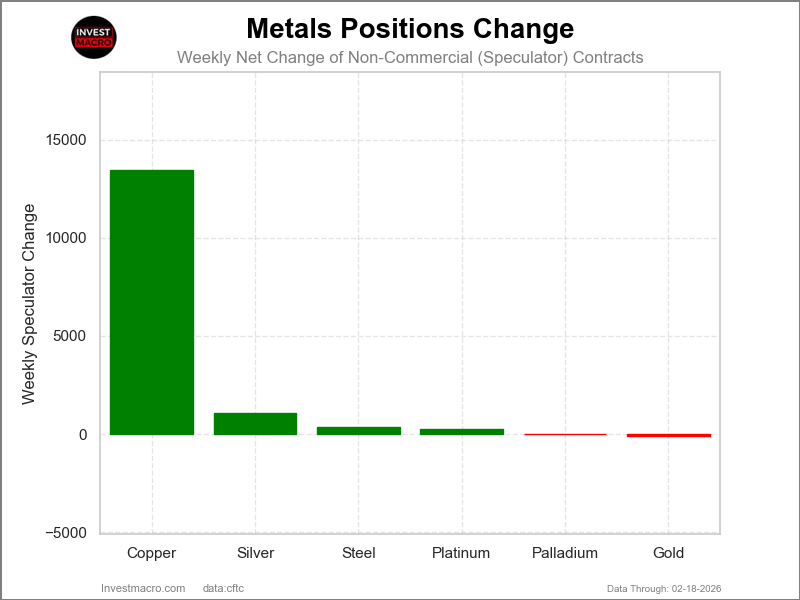
Weekly Speculator Changes led by Gold & Silver
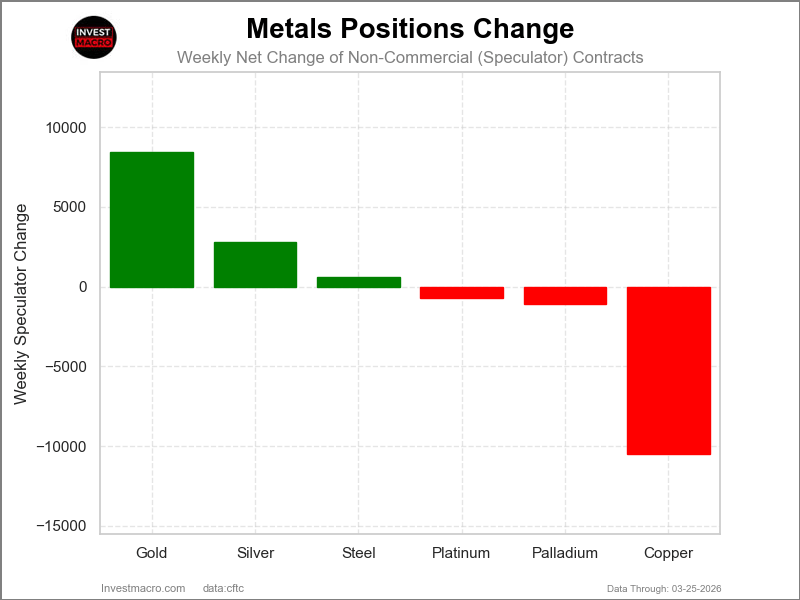
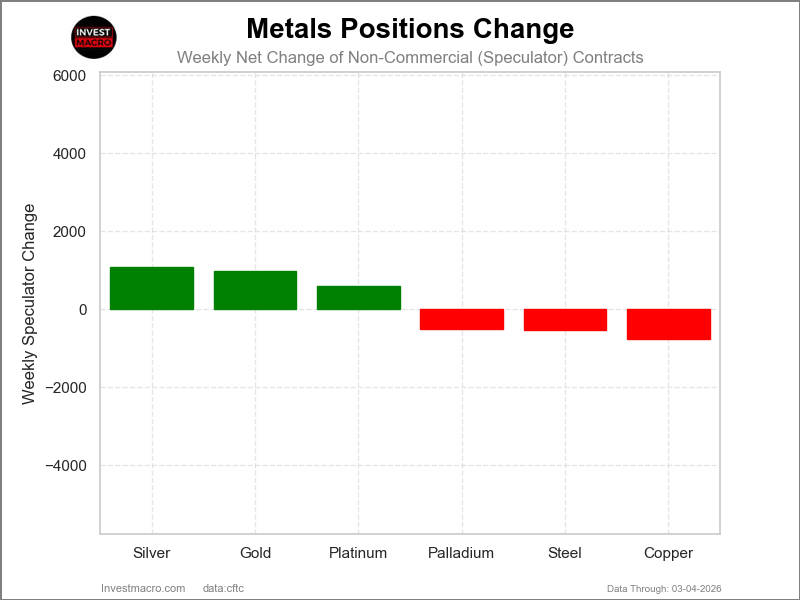
The COT metals markets speculator bets were mixed this week as three out of the six metals markets we cover had higher positioning while the other three markets had lower speculator contracts.
Leading the gains for the metals was Gold (8,458 contracts) with Silver (2,792 contracts) and Steel (595 contracts) also showing positive weeks.
The markets with declines in speculator bets for the week were Copper (-10,507 contracts), Palladium (-1,057 contracts) and with Platinum (-700 contracts) also registering lower bets on the week.
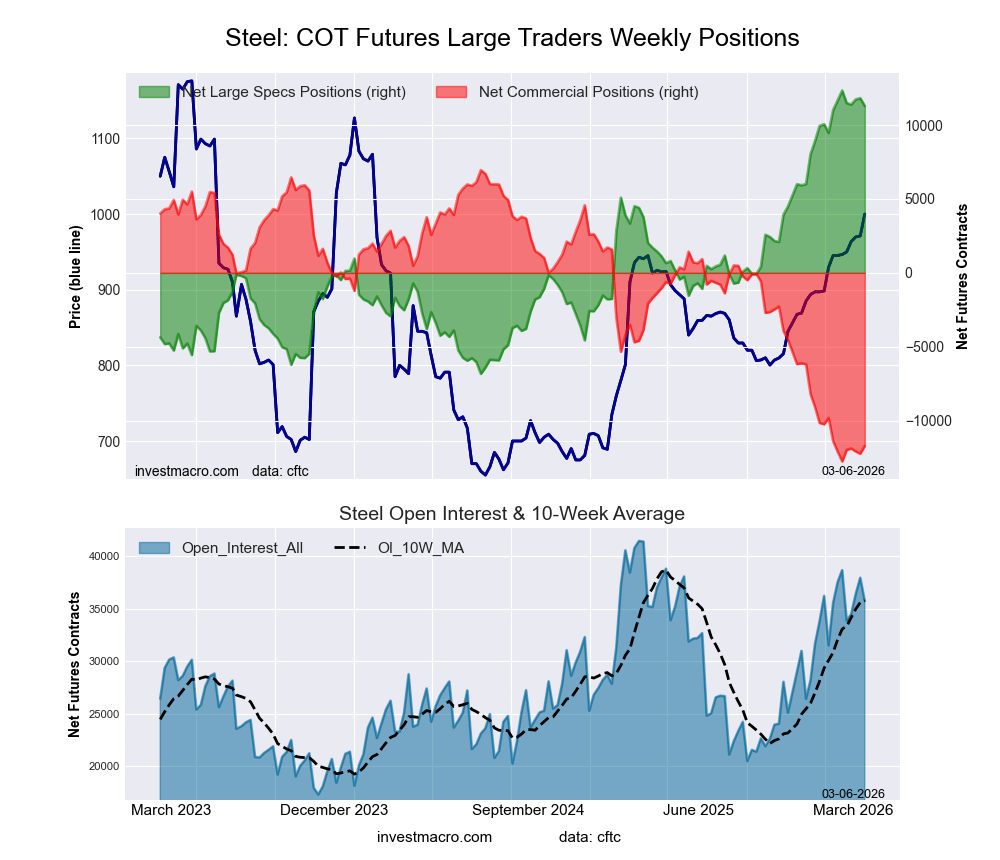
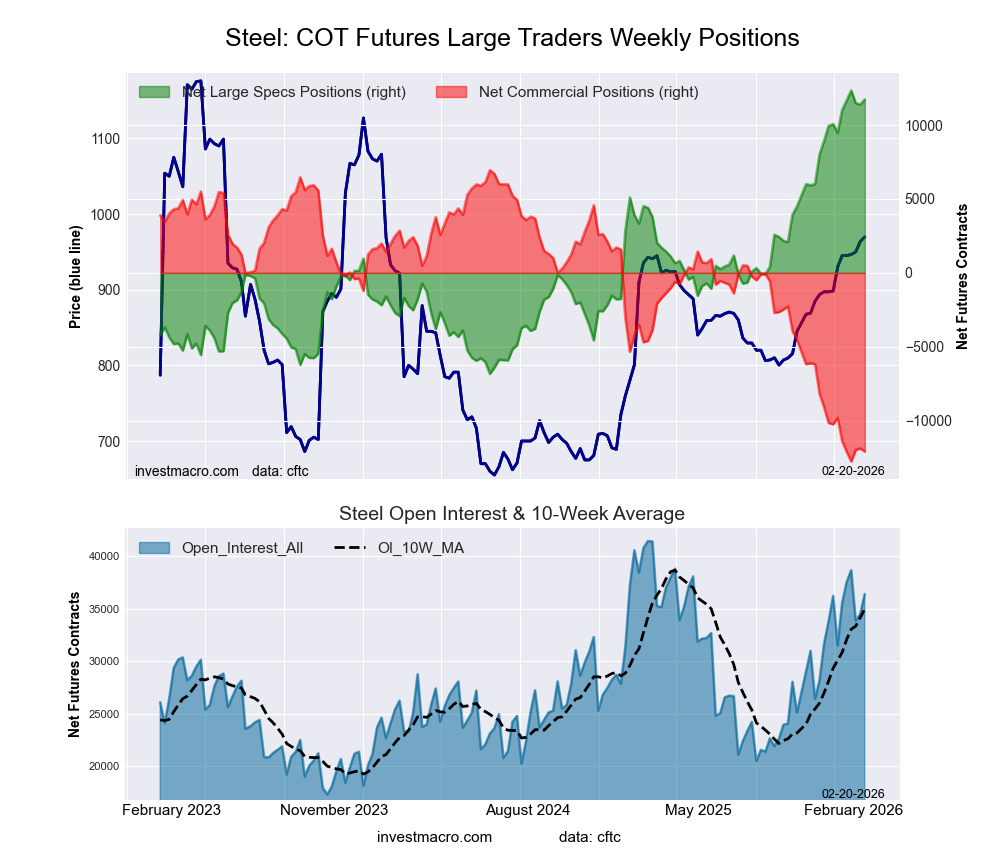
Steel Speculator Positions continue to rise to New Record High
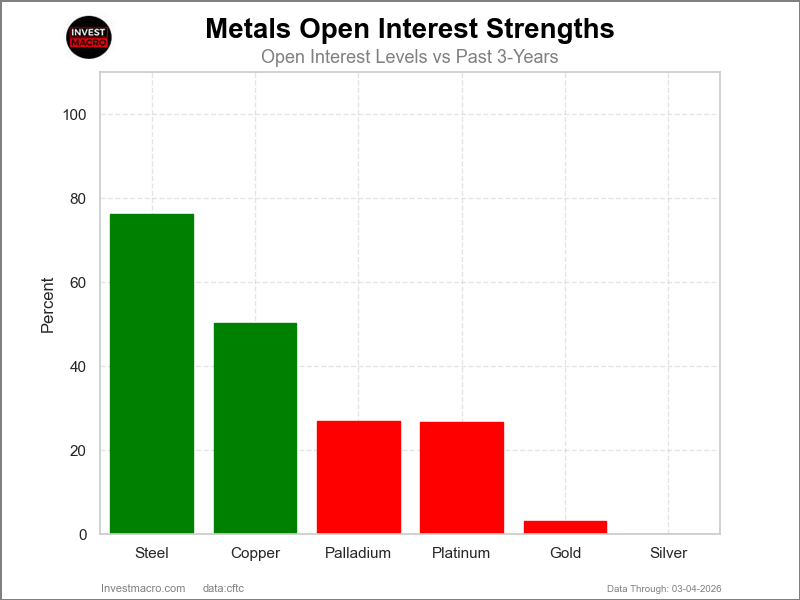
Highlighting the weekly speculator positions was the Steel speculator position which rose this week for a third consecutive week. The Steel position has been rising consistently higher over the past months with gains in 13 out of the past 17 weeks. The Steel speculator position is currently at an all-time high record at 14,462 contracts, according to the CFTC data — although it is a limited dataset going back only to 2020. This market traditionally has held negative speculative positions, but since September, the overall net position has been bullish with 12 out of the last 13 weeks seeing bullish positions above +10,000 net contracts. The open interest levels for Steel are also at all-time record highs, showing there are more open positions and interest in the market than has been seen going back to data beginning in 2020.
Copper and Silver lead Metals markets price performance this week.
The major Metals markets this week were led by Copper, which rose by 3.40% over the past five days. Silver was next with a gain of 3.09%. Steel rose by 0.50% on the week while Gold rounded out the gainers with a 0.32% rise. Palladium fell by -1.92% on the week, while Platinum was the biggest loser on the week with a decline of -3.36%.
Over the past 30 days, the high-flying Metals markets have come back to Earth with Steel being the only Metals market that has seen a gain over the past 30 days with a 4.94% rise. Palladium has fallen by -18.31% over the past 30 days, while Platinum has dipped by -9.57%. Gold is down by -8.13%, with Silver lower by -6.36%, and Copper has fallen by -5.80% in these past 30 days.
However, over the past 90 days, all of the Metals markets still have positive returns except for Palladium, which has fallen by just -0.45%.
Metals Data:
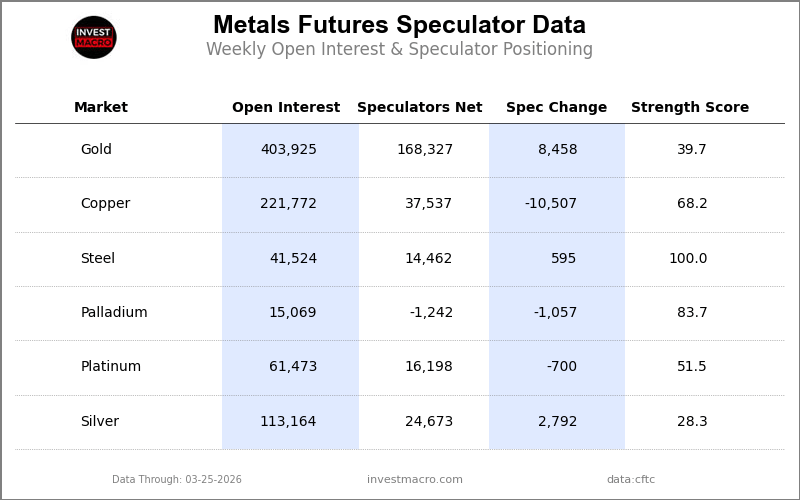
Legend: Weekly Speculators Change | Speculators Current Net Position | Speculators Strength Score compared to last 3-Years (0-100 range)
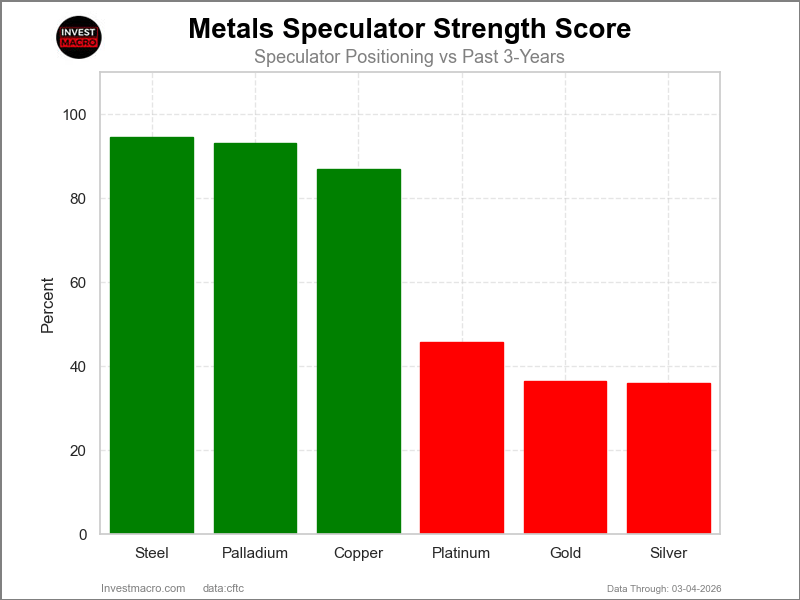
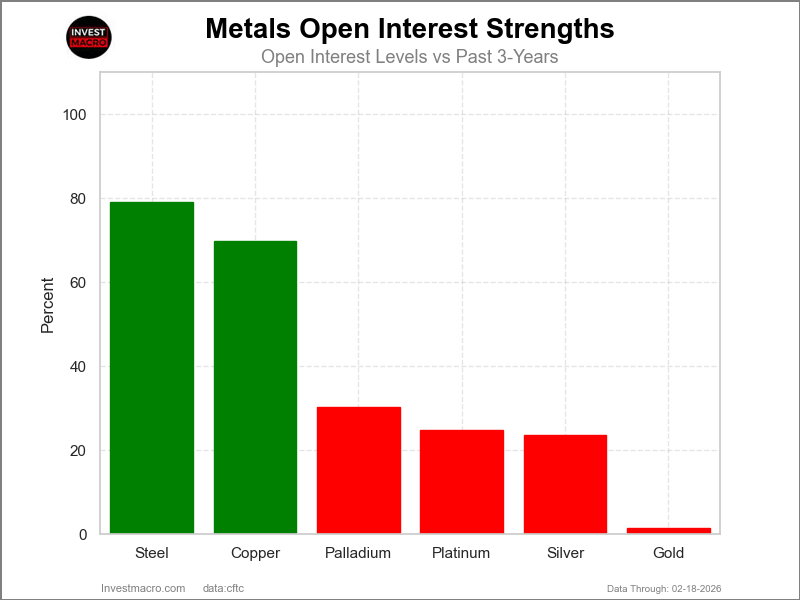
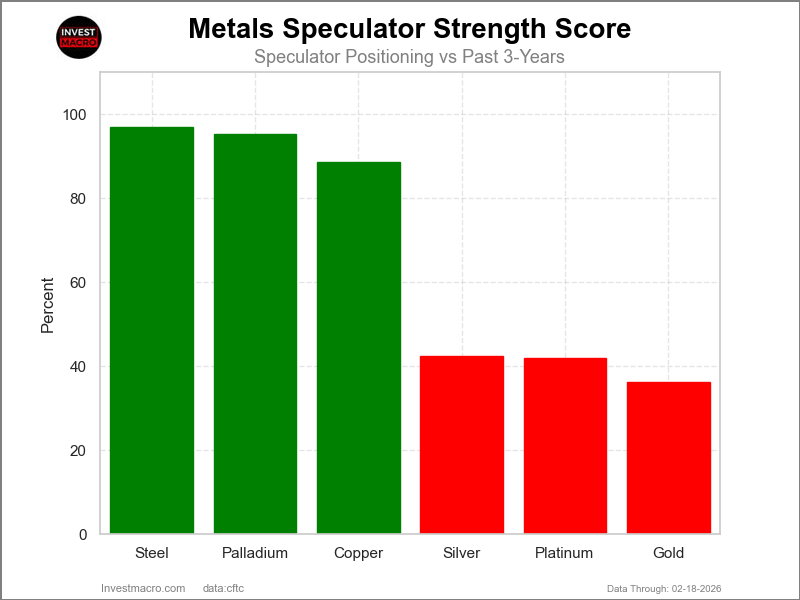
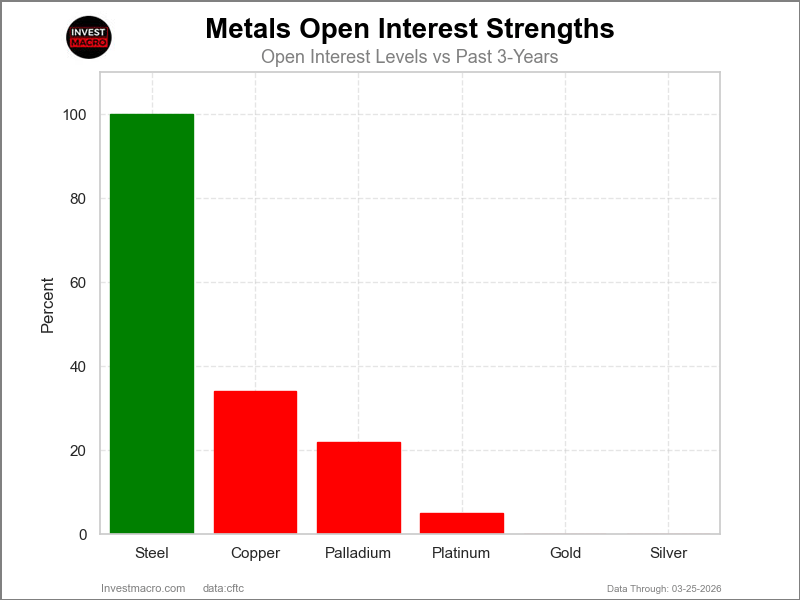
Strength Scores led by Steel & Palladium
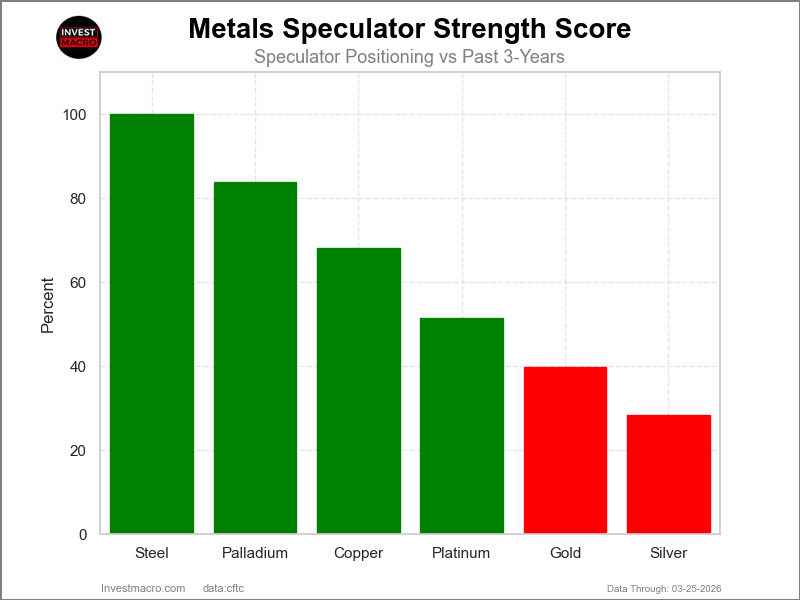
COT Strength Scores (a normalized measure of Speculator positions over a 3-Year range, from 0 to 100 where above 80 is Extreme-Bullish and below 20 is Extreme-Bearish) showed that Steel (100 percent) and Palladium (84 percent) lead the metals markets this week.
On the downside, Silver (28 percent) comes in at the lowest strength level currently.
Strength Statistics:
Gold (39.7 percent) vs Gold previous week (36.3 percent)
Silver (28.3 percent) vs Silver previous week (23.6 percent)
Copper (68.2 percent) vs Copper previous week (78.0 percent)
Platinum (51.5 percent) vs Platinum previous week (53.3 percent)
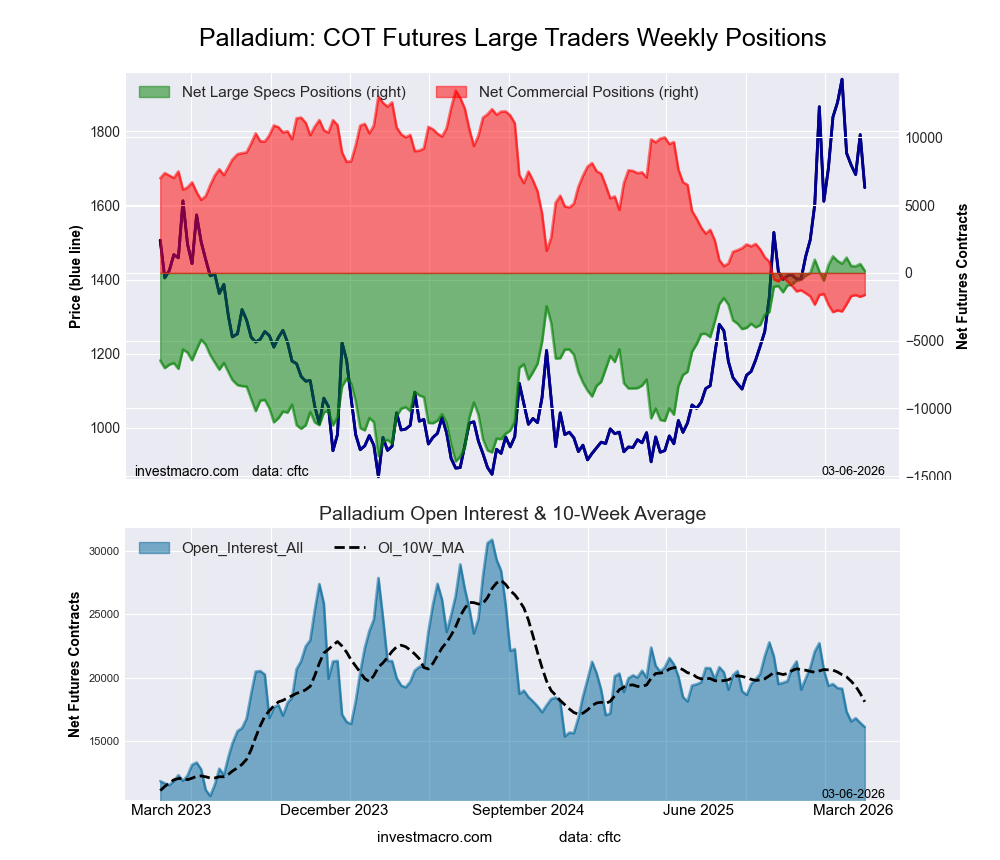
Palladium (83.7 percent) vs Palladium previous week (90.7 percent)
Steel (100.0 percent) vs Steel previous week (97.2 percent)
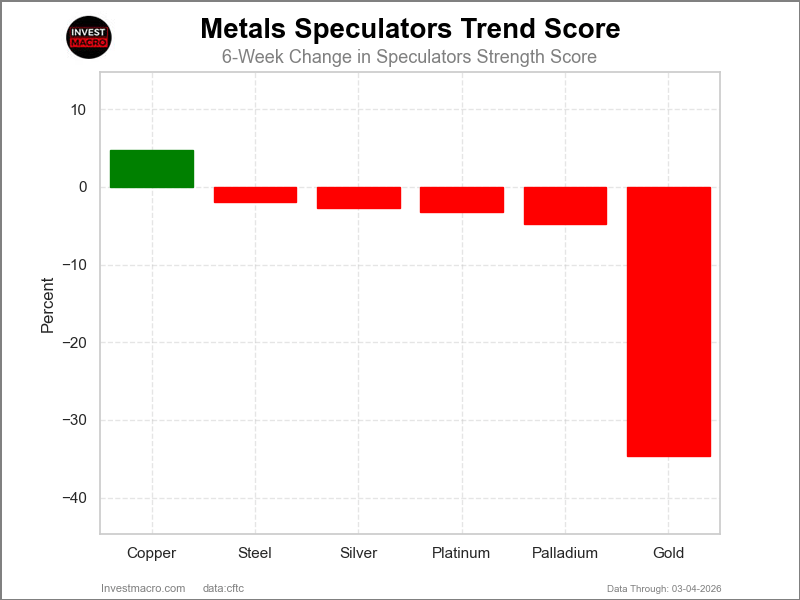
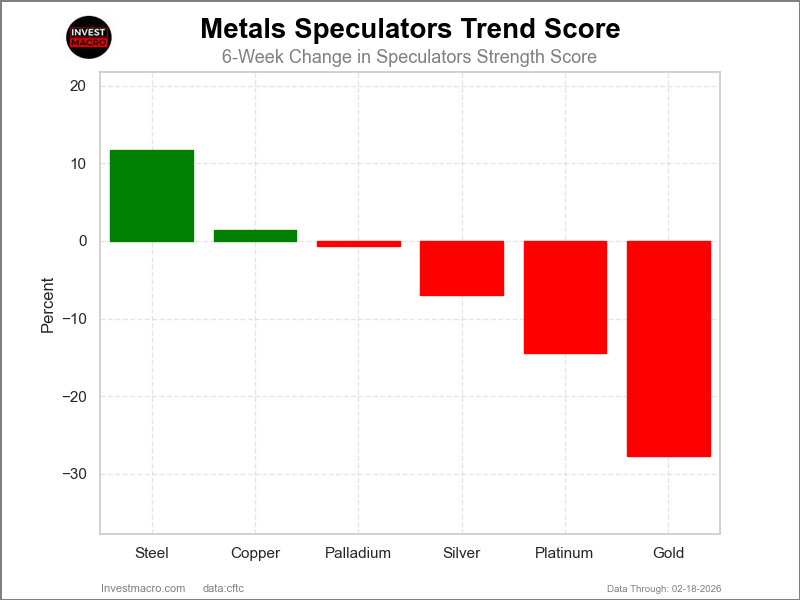
Steel & Platinum top the 6-Week Strength Trends
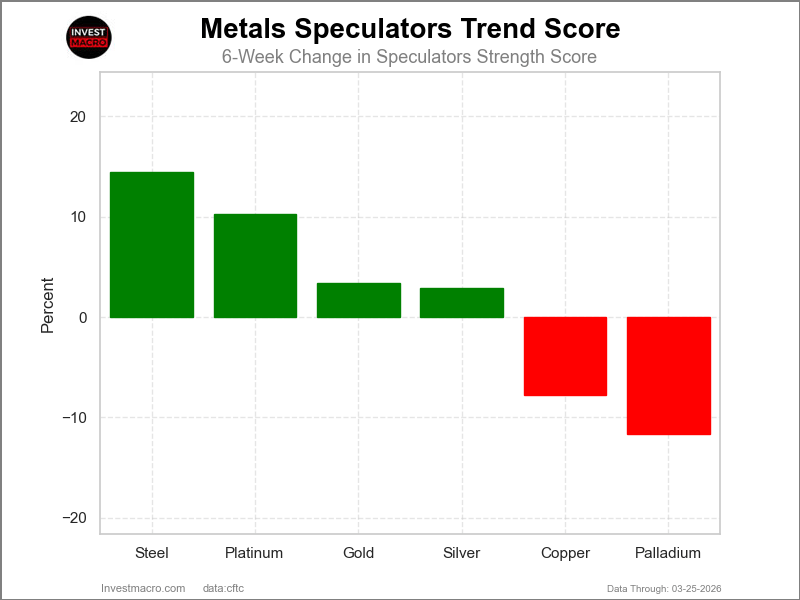
COT Strength Score Trends (or move index, calculates the 6-week changes in strength scores) showed that Steel (14 percent) and Platinum (10 percent) lead the past six weeks trends for metals.
Palladium (-12 percent) leads the downside trend scores currently with Copper (-8 percent) as the next market with lower trend scores.
Move Statistics:
Gold (3.4 percent) vs Gold previous week (-2.4 percent)
Silver (2.9 percent) vs Silver previous week (-6.7 percent)
Copper (-7.8 percent) vs Copper previous week (0.2 percent)
Platinum (10.3 percent) vs Platinum previous week (9.5 percent)
Palladium (-11.6 percent) vs Palladium previous week (-8.7 percent)
Steel (14.4 percent) vs Steel previous week (11.2 percent)
Individual Markets:
Gold Comex Futures:
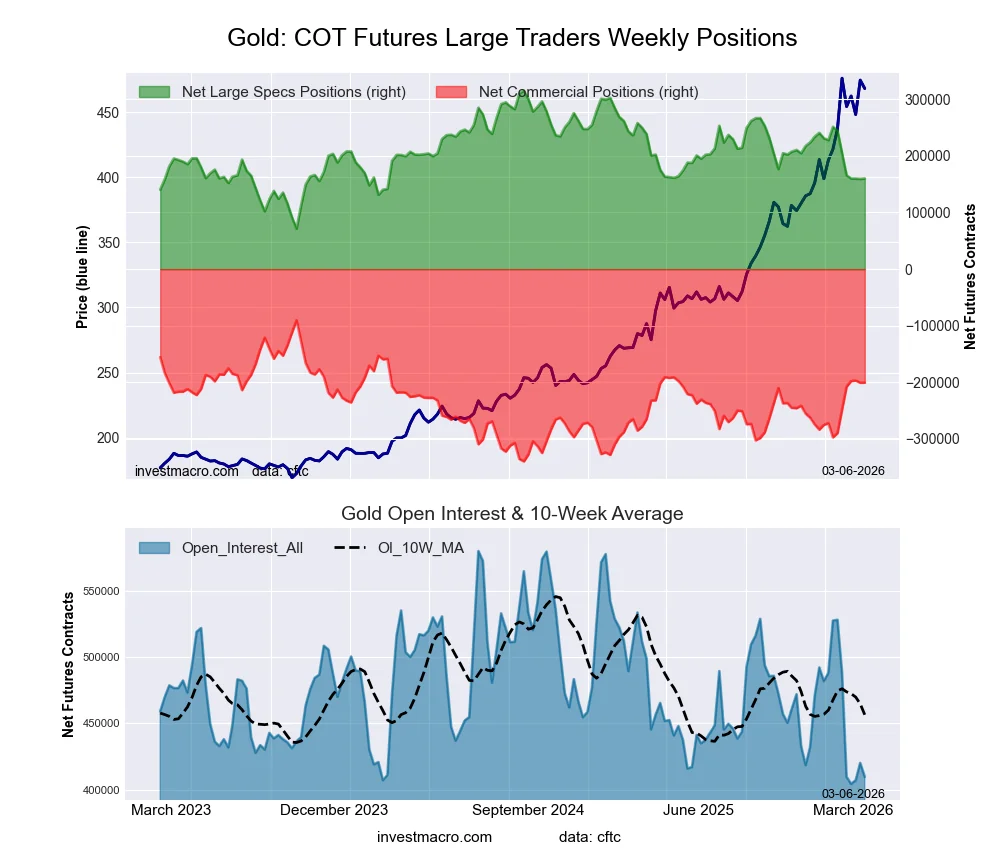
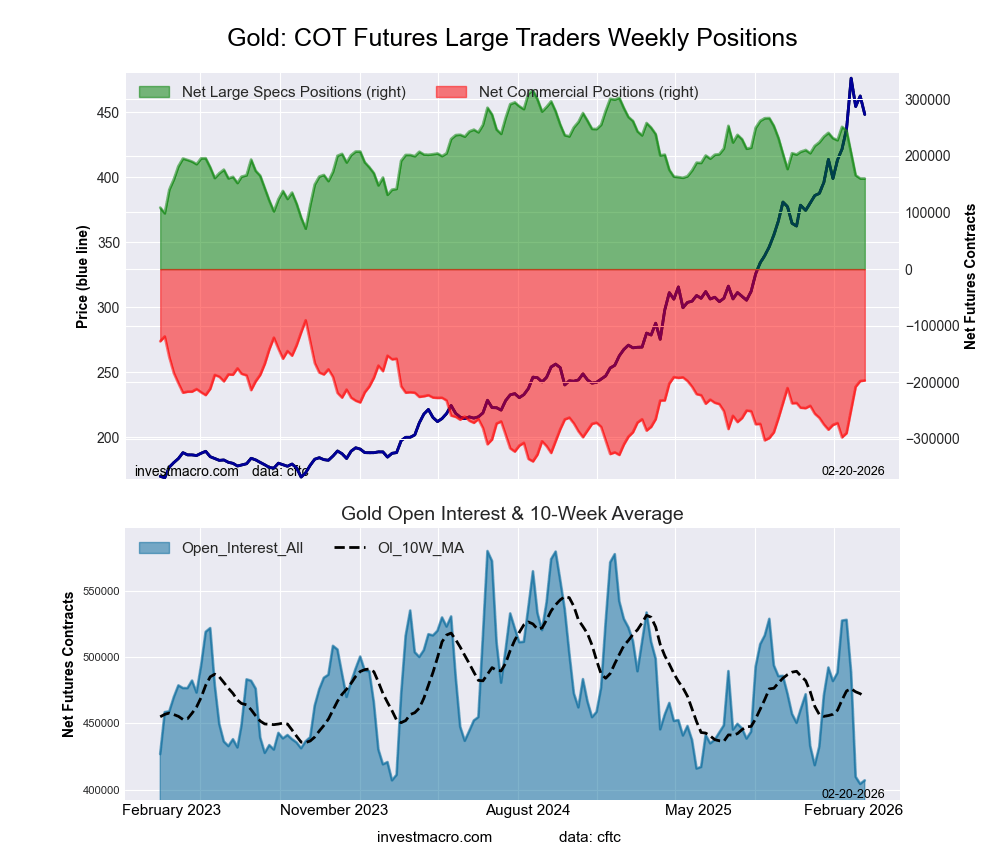
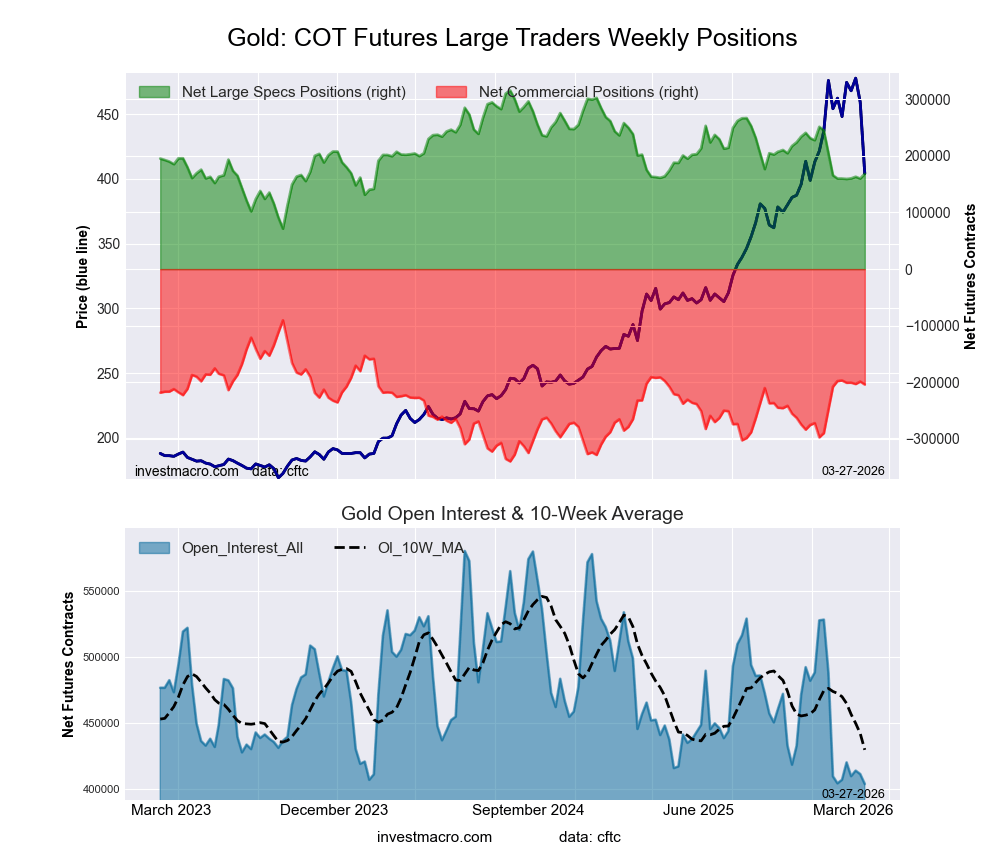 The Gold Comex Futures large speculator standing this week resulted in a net position of 168,327 contracts in the data reported through Tuesday. This was a weekly boost of 8,458 contracts from the previous week which had a total of 159,869 net contracts.
This week’s current strength score (the trader positioning range over the past three years, measured from 0 to 100) shows the speculators are currently Bearish with a score of 39.7 percent. The commercials are Bullish with a score of 54.5 percent and the small traders (not shown in chart) are Bullish with a score of 69.7 percent.
Price Trend-Following Model: Weak Uptrend
Our weekly trend-following model classifies the current market price position as: Weak Uptrend.
| Gold Futures Statistics | SPECULATORS | COMMERCIALS | SMALL TRADERS |
| – Percent of Open Interest Longs: | 54.7 | 19.1 | 12.2 |
| – Percent of Open Interest Shorts: | 13.0 | 69.5 | 3.4 |
| – Net Position: | 168,327 | -203,828 | 35,501 |
| – Gross Longs: | 220,861 | 76,997 | 49,273 |
| – Gross Shorts: | 52,534 | 280,825 | 13,772 |
| – Long to Short Ratio: | 4.2 to 1 | 0.3 to 1 | 3.6 to 1 |
| NET POSITION TREND: | |||
| – Strength Index Score (3 Year Range Pct): | 39.7 | 54.5 | 69.7 |
| – Strength Index Reading (3 Year Range): | Bearish | Bullish | Bullish |
| NET POSITION MOVEMENT INDEX: | |||
| – 6-Week Change in Strength Index: | 3.4 | -2.4 | -6.5 |
Silver Comex Futures:
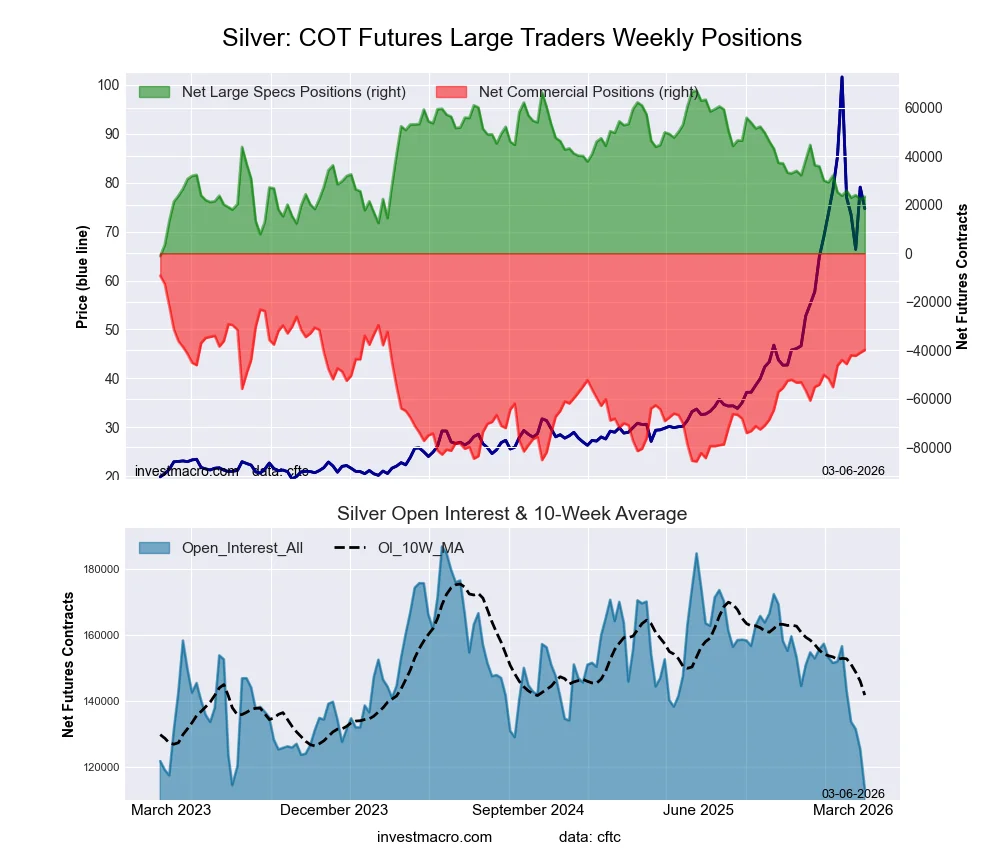
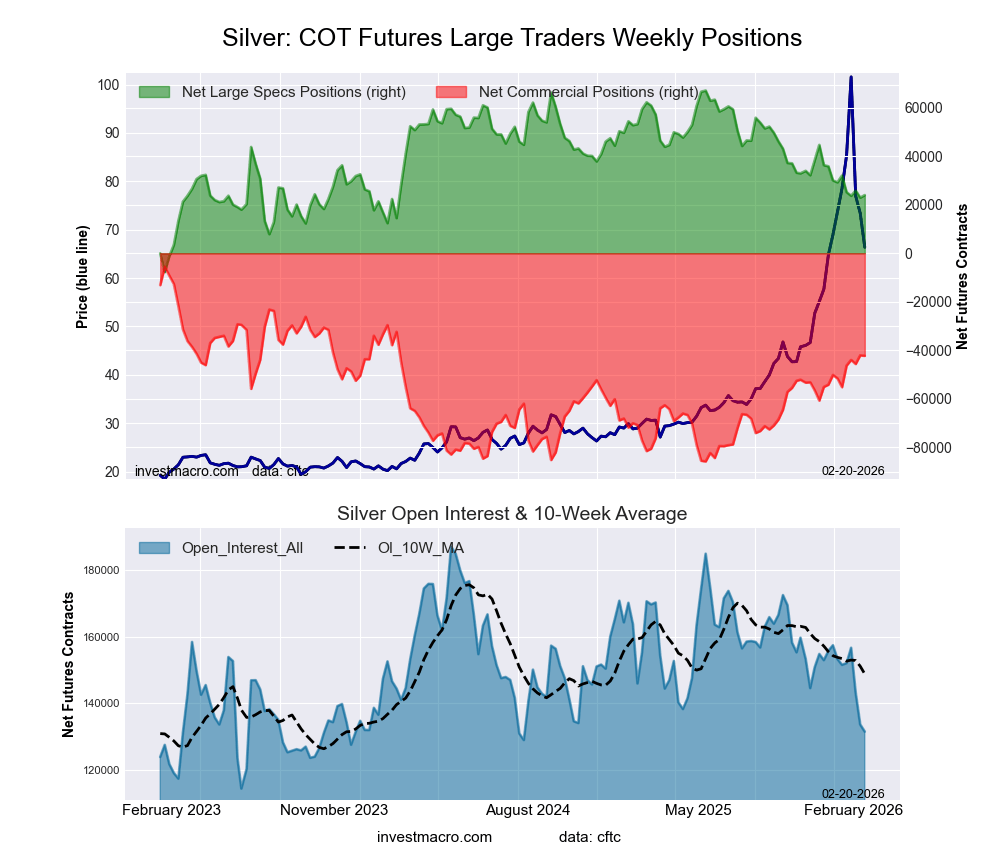
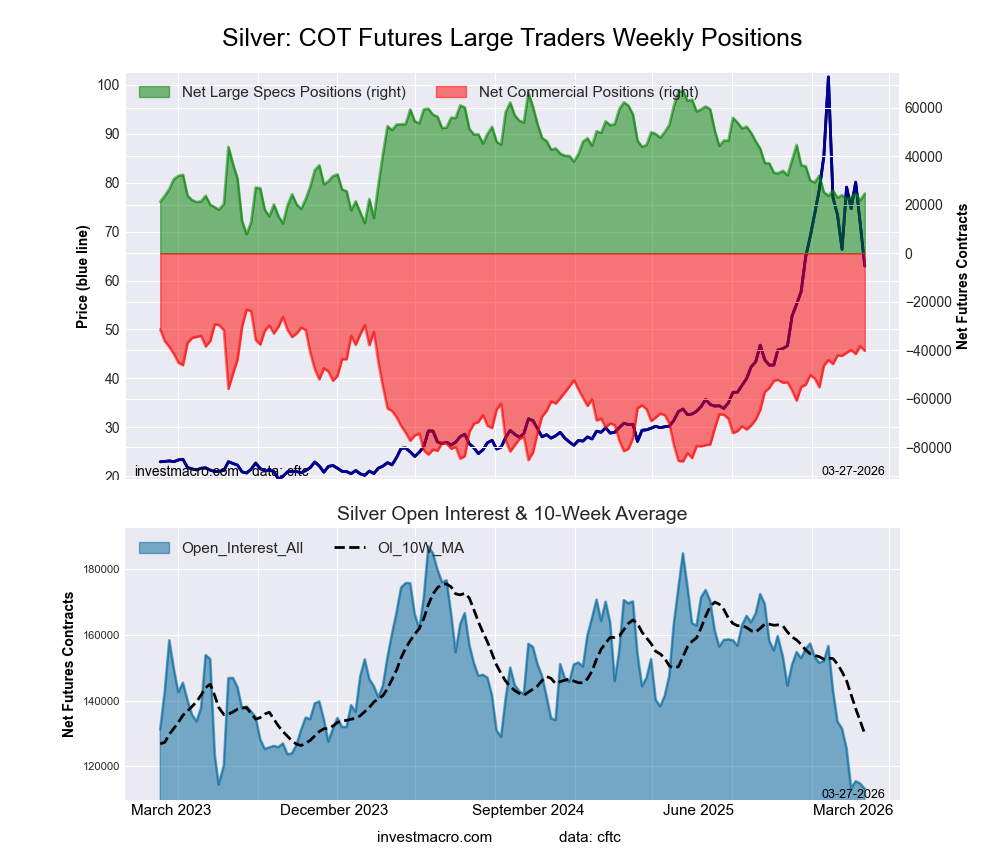 The Silver Comex Futures large speculator standing this week resulted in a net position of 24,673 contracts in the data reported through Tuesday. This was a weekly gain of 2,792 contracts from the previous week which had a total of 21,881 net contracts.
This week’s current strength score (the trader positioning range over the past three years, measured from 0 to 100) shows the speculators are currently Bearish with a score of 28.3 percent. The commercials are Bullish with a score of 72.8 percent and the small traders (not shown in chart) are Bearish with a score of 38.6 percent.
Price Trend-Following Model: Weak Uptrend
Our weekly trend-following model classifies the current market price position as: Weak Uptrend.
| Silver Futures Statistics | SPECULATORS | COMMERCIALS | SMALL TRADERS |
| – Percent of Open Interest Longs: | 30.0 | 26.1 | 21.7 |
| – Percent of Open Interest Shorts: | 8.2 | 61.7 | 7.9 |
| – Net Position: | 24,673 | -40,288 | 15,615 |
| – Gross Longs: | 33,938 | 29,511 | 24,555 |
| – Gross Shorts: | 9,265 | 69,799 | 8,940 |
| – Long to Short Ratio: | 3.7 to 1 | 0.4 to 1 | 2.7 to 1 |
| NET POSITION TREND: | |||
| – Strength Index Score (3 Year Range Pct): | 28.3 | 72.8 | 38.6 |
| – Strength Index Reading (3 Year Range): | Bearish | Bullish | Bearish |
| NET POSITION MOVEMENT INDEX: | |||
| – 6-Week Change in Strength Index: | 2.9 | 3.0 | -19.9 |
Copper Grade #1 Futures:
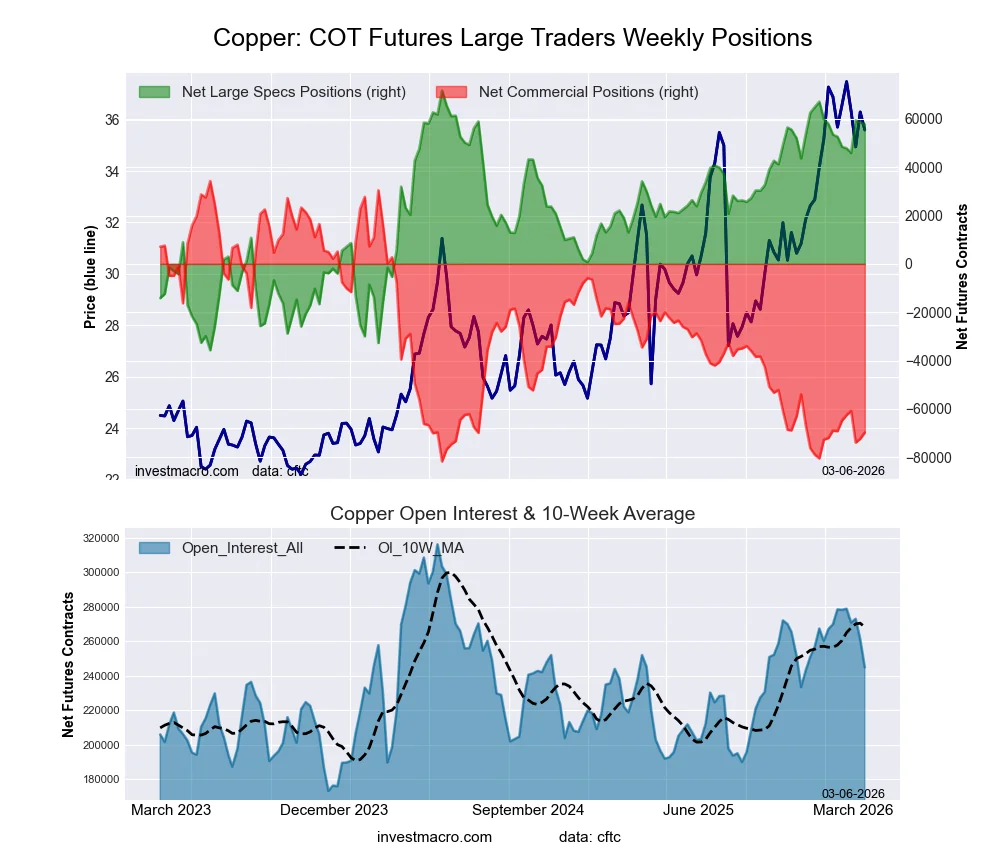
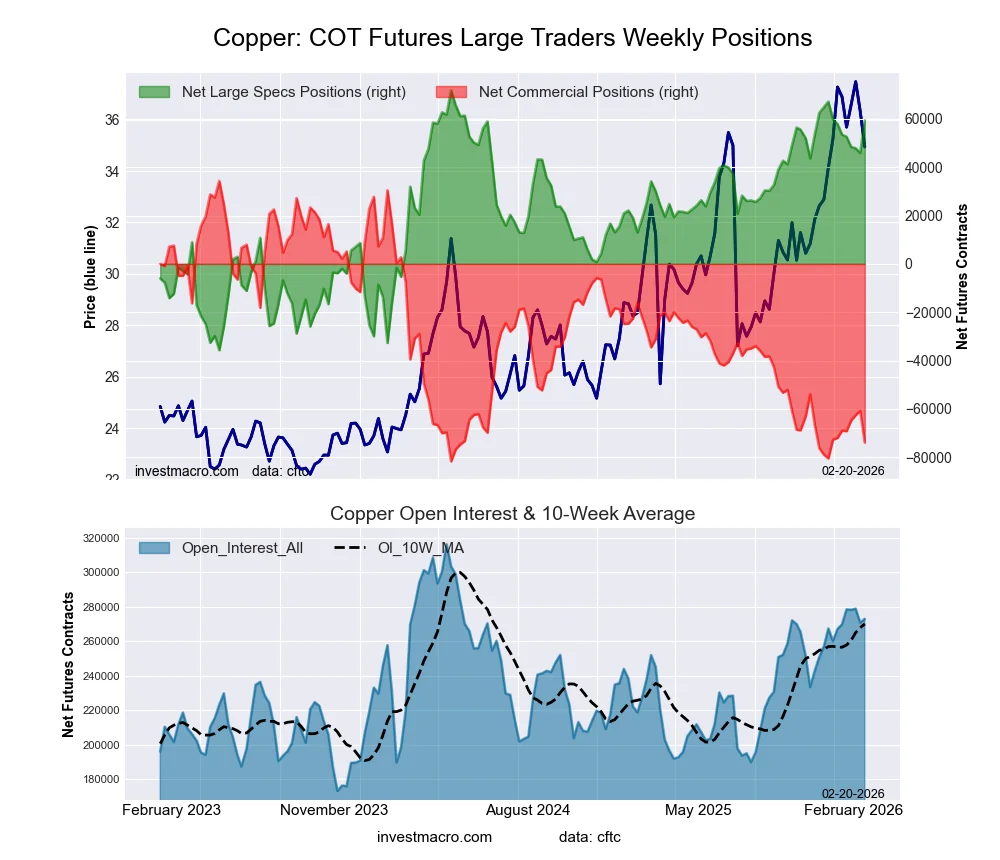
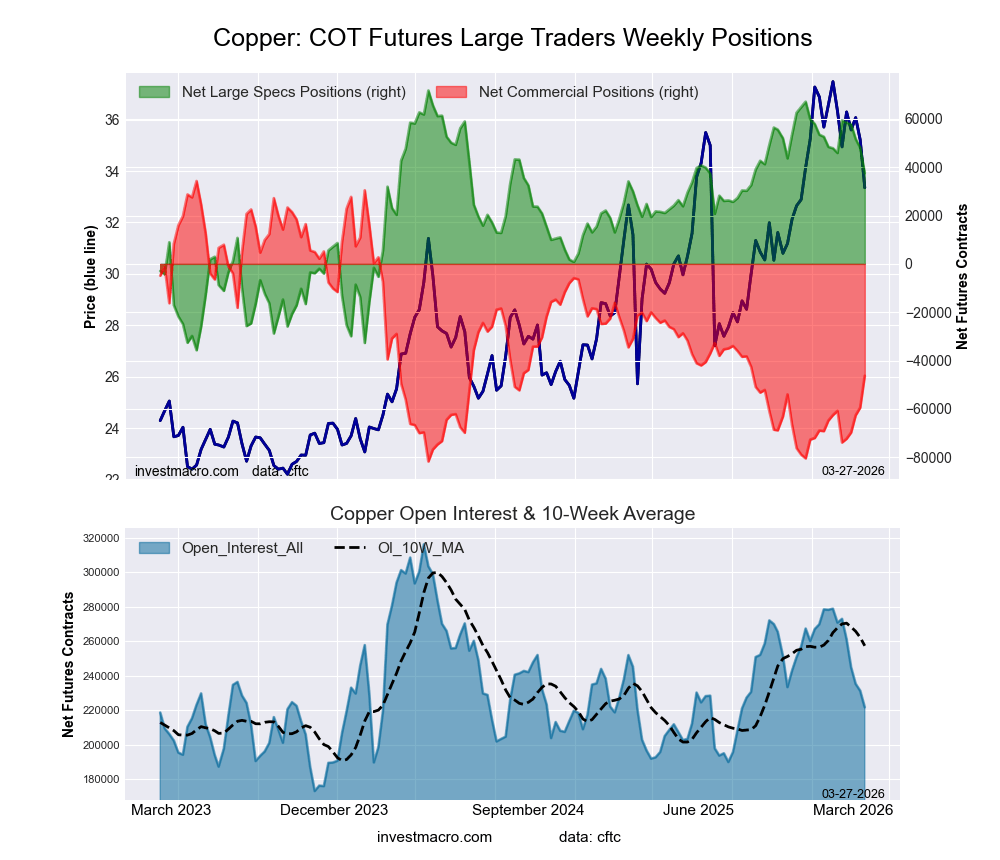 The Copper Grade #1 Futures large speculator standing this week resulted in a net position of 37,537 contracts in the data reported through Tuesday. This was a weekly lowering of -10,507 contracts from the previous week which had a total of 48,044 net contracts.
This week’s current strength score (the trader positioning range over the past three years, measured from 0 to 100) shows the speculators are currently Bullish with a score of 68.2 percent. The commercials are Bearish with a score of 30.5 percent and the small traders (not shown in chart) are Bullish with a score of 59.5 percent.
Price Trend-Following Model: Weak Uptrend
Our weekly trend-following model classifies the current market price position as: Weak Uptrend.
| Copper Futures Statistics | SPECULATORS | COMMERCIALS | SMALL TRADERS |
| – Percent of Open Interest Longs: | 30.9 | 41.0 | 8.7 |
| – Percent of Open Interest Shorts: | 14.0 | 61.8 | 4.7 |
| – Net Position: | 37,537 | -46,288 | 8,751 |
| – Gross Longs: | 68,491 | 90,872 | 19,196 |
| – Gross Shorts: | 30,954 | 137,160 | 10,445 |
| – Long to Short Ratio: | 2.2 to 1 | 0.7 to 1 | 1.8 to 1 |
| NET POSITION TREND: | |||
| – Strength Index Score (3 Year Range Pct): | 68.2 | 30.5 | 59.5 |
| – Strength Index Reading (3 Year Range): | Bullish | Bearish | Bullish |
| NET POSITION MOVEMENT INDEX: | |||
| – 6-Week Change in Strength Index: | -7.8 | 12.5 | -31.8 |
Platinum Futures:
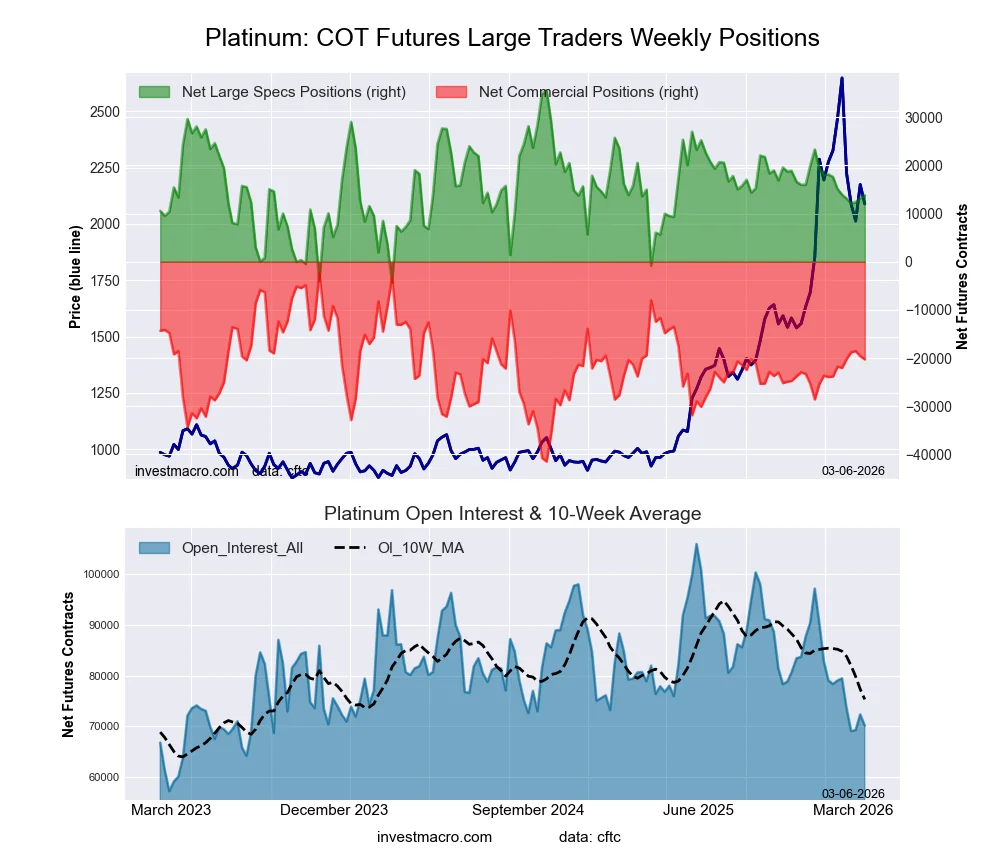
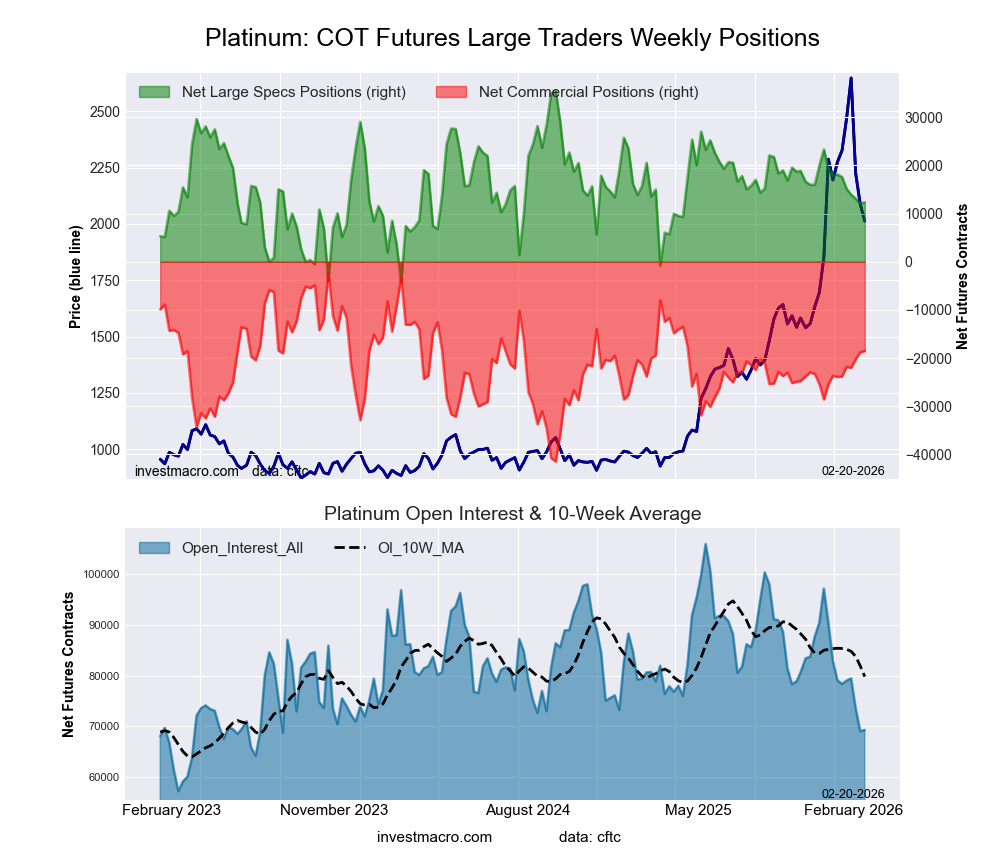
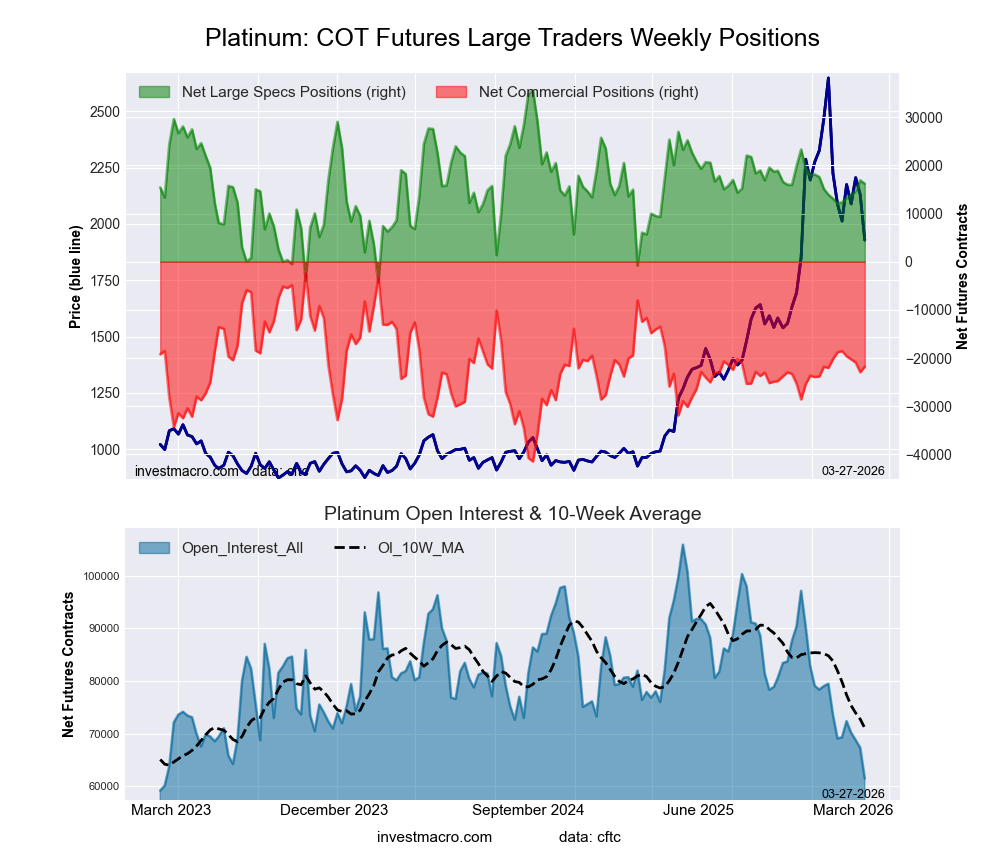 The Platinum Futures large speculator standing this week resulted in a net position of 16,198 contracts in the data reported through Tuesday. This was a weekly reduction of -700 contracts from the previous week which had a total of 16,898 net contracts.
This week’s current strength score (the trader positioning range over the past three years, measured from 0 to 100) shows the speculators are currently Bullish with a score of 51.5 percent. The commercials are Bullish with a score of 50.4 percent and the small traders (not shown in chart) are Bullish with a score of 62.5 percent.
Price Trend-Following Model: Weak Uptrend
Our weekly trend-following model classifies the current market price position as: Weak Uptrend.
| Platinum Futures Statistics | SPECULATORS | COMMERCIALS | SMALL TRADERS |
| – Percent of Open Interest Longs: | 42.5 | 31.1 | 14.0 |
| – Percent of Open Interest Shorts: | 16.2 | 66.4 | 5.0 |
| – Net Position: | 16,198 | -21,749 | 5,551 |
| – Gross Longs: | 26,146 | 19,093 | 8,601 |
| – Gross Shorts: | 9,948 | 40,842 | 3,050 |
| – Long to Short Ratio: | 2.6 to 1 | 0.5 to 1 | 2.8 to 1 |
| NET POSITION TREND: | |||
| – Strength Index Score (3 Year Range Pct): | 51.5 | 50.4 | 62.5 |
| – Strength Index Reading (3 Year Range): | Bullish | Bullish | Bullish |
| NET POSITION MOVEMENT INDEX: | |||
| – 6-Week Change in Strength Index: | 10.3 | -7.6 | -13.2 |
Palladium Futures:
 The Palladium Futures large speculator standing this week resulted in a net position of -1,242 contracts in the data reported through Tuesday. This was a weekly fall of -1,057 contracts from the previous week which had a total of -185 net contracts.
This week’s current strength score (the trader positioning range over the past three years, measured from 0 to 100) shows the speculators are currently Bullish-Extreme with a score of 83.7 percent. The commercials are Bearish-Extreme with a score of 17.6 percent and the small traders (not shown in chart) are Bullish with a score of 63.5 percent.
Price Trend-Following Model: Weak Uptrend
Our weekly trend-following model classifies the current market price position as: Weak Uptrend.
| Palladium Futures Statistics | SPECULATORS | COMMERCIALS | SMALL TRADERS |
| – Percent of Open Interest Longs: | 42.9 | 36.4 | 15.9 |
| – Percent of Open Interest Shorts: | 51.2 | 36.5 | 7.5 |
| – Net Position: | -1,242 | -15 | 1,257 |
| – Gross Longs: | 6,468 | 5,488 | 2,389 |
| – Gross Shorts: | 7,710 | 5,503 | 1,132 |
| – Long to Short Ratio: | 0.8 to 1 | 1.0 to 1 | 2.1 to 1 |
| NET POSITION TREND: | |||
| – Strength Index Score (3 Year Range Pct): | 83.7 | 17.6 | 63.5 |
| – Strength Index Reading (3 Year Range): | Bullish-Extreme | Bearish-Extreme | Bullish |
| NET POSITION MOVEMENT INDEX: | |||
| – 6-Week Change in Strength Index: | -11.6 | 10.3 | 2.2 |
Steel Futures Futures:
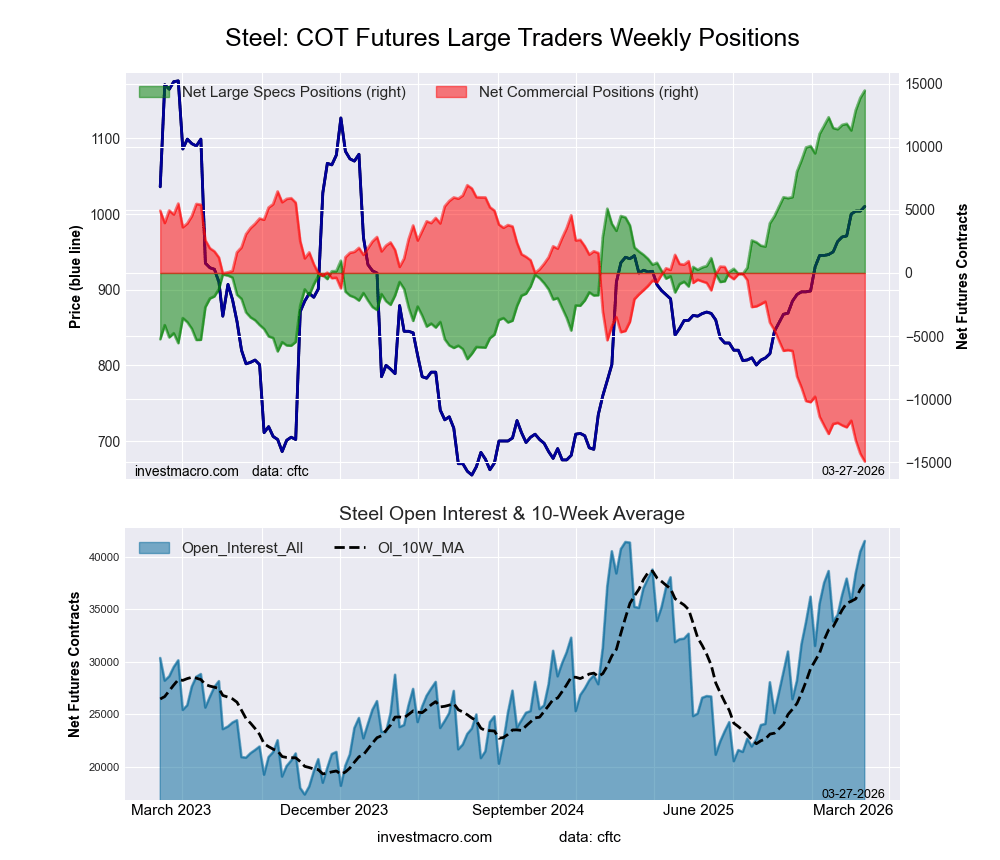 The Steel Futures large speculator standing this week resulted in a net position of 14,462 contracts in the data reported through Tuesday. This was a weekly rise of 595 contracts from the previous week which had a total of 13,867 net contracts.
This week’s current strength score (the trader positioning range over the past three years, measured from 0 to 100) shows the speculators are currently Bullish-Extreme with a score of 100.0 percent. The commercials are Bearish-Extreme with a score of 0.0 percent and the small traders (not shown in chart) are Bullish-Extreme with a score of 98.7 percent.
Price Trend-Following Model: Uptrend
Our weekly trend-following model classifies the current market price position as: Uptrend.
| Steel Futures Statistics | SPECULATORS | COMMERCIALS | SMALL TRADERS |
| – Percent of Open Interest Longs: | 38.0 | 58.1 | 1.8 |
| – Percent of Open Interest Shorts: | 3.1 | 94.1 | 0.6 |
| – Net Position: | 14,462 | -14,946 | 484 |
| – Gross Longs: | 15,769 | 24,143 | 736 |
| – Gross Shorts: | 1,307 | 39,089 | 252 |
| – Long to Short Ratio: | 12.1 to 1 | 0.6 to 1 | 2.9 to 1 |
| NET POSITION TREND: | |||
| – Strength Index Score (3 Year Range Pct): | 100.0 | 0.0 | 98.7 |
| – Strength Index Reading (3 Year Range): | Bullish-Extreme | Bearish-Extreme | Bullish-Extreme |
| NET POSITION MOVEMENT INDEX: | |||
| – 6-Week Change in Strength Index: | 14.4 | -14.0 | -1.3 |
Article By InvestMacro – Receive our weekly COT Newsletter
*COT Report: The COT data, released weekly to the public each Friday, is updated through the most recent Tuesday (data is 3 days old) and shows a quick view of how large speculators or non-commercials (for-profit traders) were positioned in the futures markets.
The CFTC categorizes trader positions according to commercial hedgers (traders who use futures contracts for hedging as part of the business), non-commercials (large traders who speculate to realize trading profits) and nonreportable traders (usually small traders/speculators) as well as their open interest (contracts open in the market at time of reporting). See CFTC criteria here.