John Newell of John Newell & Associates takes a look at the CRB Index and reviews companies on the index he believes might be positioned for the next upleg.
The Thomson Reuters/ Core Commodity CRB Index is one of those indicators that does not always get the attention it deserves, but it should. It quietly reflects what is happening across the entire commodity complex, not just gold, silver, or copper in isolation, but the full spectrum of raw materials that drive the global economy.
At its core, the CRB Index is a basket of commodities that includes energy, metals, and agricultural products. Because energy carries a heavy weighting, shifts in oil can influence the index, but the broader message comes from how all these components move together. When the CRB trends higher, it typically reflects strengthening demand, tightening supply, or rising inflation pressures. When it trends lower, it often signals the opposite.
For years, the CRB has been stuck in a wide, grinding range. Rallies would start, build some momentum, and then fade. That kind of price action usually tells you the sector is under-owned and lacking a strong macro tailwind.
That may now be changing.
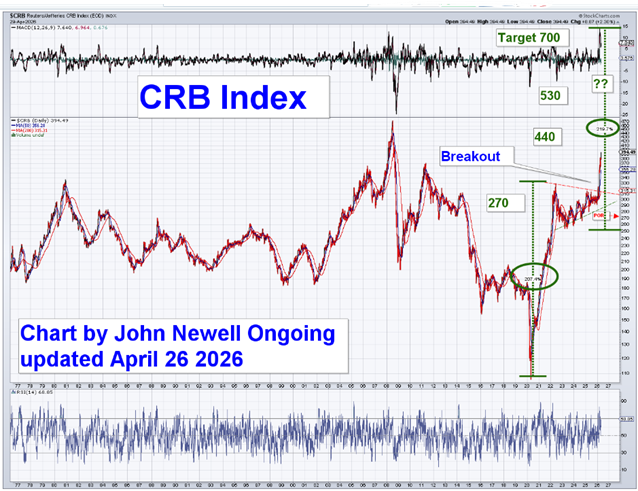
The decline into the 2020–2021 lows marked a classic capitulation phase. The selling was sharp and emotional, the kind of move that tends to mark the end of a cycle rather than the middle of one. What followed has been a steady recovery, but more importantly, a shift in structure. The CRB has begun to build higher lows, and that is often the first sign that a market is transitioning from distribution into accumulation.
I often refer to the idea of “same way down, same way up,” and the CRB is starting to show that kind of symmetry. The area around 270 marked what I call the Point of Recognition, where the market proved the downtrend had lost control. Since then, the consolidation has been constructive, not weak.
From here, the roadmap becomes clearer. Levels around 440 and 530 represent logical steps along the way, while a move toward 700 would suggest something much larger, potentially the early stages of a new commodity cycle.
Now, none of this happens in a straight line. Corrections are part of the process, and in many ways, they are where the best information shows up.
Because what holds up best during a correction often leads the next move higher.
What Goes Down the Least…
One of the simplest observations in market behavior is that relative strength matters. Stocks that refuse to break down when their sector is under pressure tend to outperform when sentiment turns.
In the recent pullback across precious metals and energy, a few names have stood out. They have not collapsed. They have held structure, built higher lows, and in some cases continued advancing.
Those are the ones I pay attention to.
Honey Badger Silver Inc.
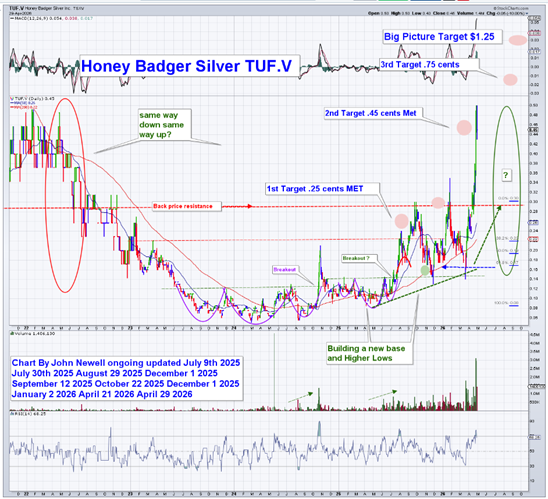
Honey Badger Silver Inc. (TUF:TSXV; HBEIF:OTCQB) is a story that has quietly evolved from a collection of exploration assets into something more substantial.
The company’s strategy has been straightforward but effective. Rather than chasing high-risk exploration alone, management has focused on acquiring silver ounces in the ground at low cost, often in past-producing districts with infrastructure already in place. That approach has allowed the company to build scale without excessive dilution.
The turning point came with the acquisition of the Prairie Creek Project in the Northwest Territories. This is not just another exploration play. It is a high-grade, fully permitted silver-zinc-lead project with existing underground development and a defined resource base. Historically, Prairie Creek hosts roughly 240 million ounces of silver equivalent in measured and indicated categories, with an additional 167 million ounces inferred.
That scale matters, especially in a market where new discoveries are harder to come by and permitting timelines continue to stretch.
What stands out is the valuation gap. While many peers trade at significantly higher values per ounce in the ground, Honey Badger remains priced at a fraction of that level. That disconnect creates the potential for a re-rating as the market begins to recognize the underlying asset base.
From a market standpoint, the stock has already shown strength. It has achieved earlier upside targets and, despite a pullback in silver, has held its structure and built a new base. That type of behavior is not typical in this space, and it often points to accumulation rather than distribution.
Management is another piece of the puzzle. With a capital markets background and experience building and financing companies, the team has shown discipline in how it has grown the asset base.
This is no longer just an exploration story. It is becoming a development story, and that shift can be meaningful if the broader commodity cycle continues to improve.
Lux Metals Corp.
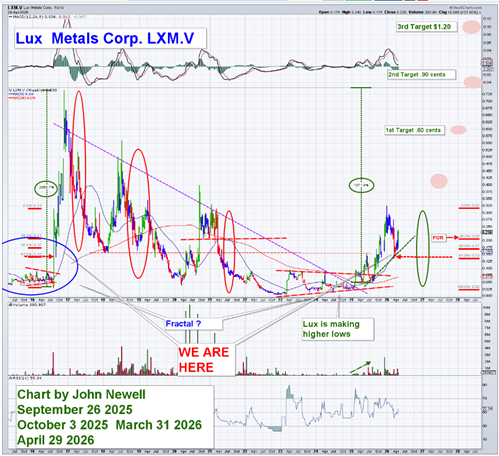
Lux Metals Corp (LXM:TSXV; BBBMF:OTCMKTS) is still early in its story, but that is part of what makes it interesting.
The company is focused on advancing its copper and gold assets, positioning itself within a sector that continues to benefit from long-term demand tied to electrification and infrastructure. While the broader market has been volatile, Lux has been quietly building a more constructive structure.
What stands out here is the transition from a prolonged downtrend into a basing phase, followed by the early signs of higher lows. That shift may seem subtle, but it is often where the biggest opportunities begin.
On the fundamental side, the company is still in the exploration and development stage, which means the value is tied to what it can prove in the ground. In a stronger commodity environment, that optionality becomes more valuable, particularly for companies with clean structures and room to grow.
What I am watching is how the stock behaves around key levels. Holding support and continuing to build higher lows during a broader correction suggests that sellers are losing control. If that continues, the next phase tends to come quickly.
Lux fits the profile of a company that could benefit from renewed interest in base metals, particularly if the CRB continues to strengthen.
ATHA Energy Corp.
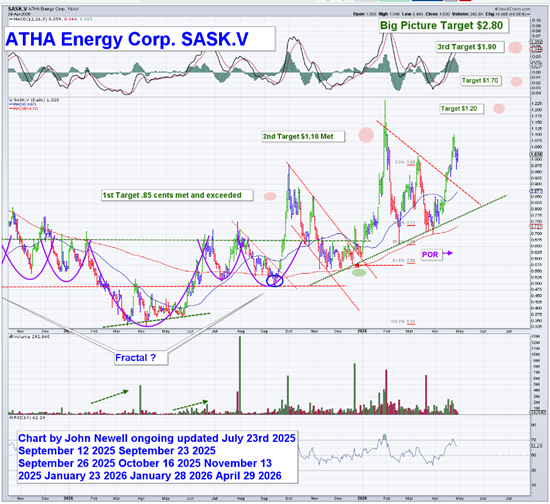
ATHA Energy Corp. (SASK:TSX.V; SASKF:OTCMKTS; X5U:FRA) sits in a different part of the commodity spectrum, but the setup is similar.
The company is focused on uranium, a sector that has quietly been building momentum as the world rethinks energy security and the role of nuclear power. With a large land position and exposure to high-quality uranium districts, ATHA has positioned itself within a theme that is gaining traction.
What stands out technically is that the stock has already moved through earlier upside targets and continues to build higher lows. Even during recent volatility, the structure has held.
That is not something you see in weaker names.
From a fundamental perspective, uranium remains one of the more compelling long-term stories in the resource space. Supply constraints, increasing demand for clean energy, and geopolitical considerations all support the case for higher prices over time.
ATHA provides leverage to that theme, and the market appears to be recognizing it.
The combination of improving fundamentals and a chart that continues to act well places it firmly in the category of relative strength.
The Bigger Picture
What ties all of this together is the backdrop.
The CRB Index appears to be transitioning out of a multi-year base. That does not guarantee a straight move higher, but it does suggest the environment is improving.
At the same time, we are seeing select companies that are not breaking down during corrections. They are holding structure, building higher lows, and quietly positioning themselves for the next move.
That combination matters.
Because when the commodity cycle turns, capital does not flow evenly. It flows first into the names that are already acting right.
The CRB gives us the signal.
These companies are giving us the early confirmation.
And if this is the beginning of a broader move in commodities, then the real opportunity will not come from the index itself. It will come from the companies that have already shown they can hold their ground when the market tests them.
That is where I would be focusing my attention right now.
Important Disclosures:
- As of the date of this article, officers, contractors, shareholders, and/or employees of Streetwise Reports LLC (including members of their household) own securities of Lux Metals Corp.
- John Newell: I, or members of my immediate household or family, own securities of: Lux Metals Corp. and Honey Badger Silver Inc. My company has a financial relationship with: None. My company has purchased stocks mentioned in this article for my management clients: None. I determined which companies would be included in this article based on my research and understanding of the sector.
- Statements and opinions expressed are the opinions of the author and not of Streetwise Reports, Street Smart, or their officers. The author is wholly responsible for the accuracy of the statements. Streetwise Reports was not paid by the author to publish or syndicate this article. Streetwise Reports requires contributing authors to disclose any shareholdings in, or economic relationships with, companies that they write about. Any disclosures from the author can be found below. Streetwise Reports relies upon the authors to accurately provide this information and Streetwise Reports has no means of verifying its accuracy.
- This article does not constitute investment advice and is not a solicitation for any investment. Streetwise Reports does not render general or specific investment advice and the information on Streetwise Reports should not be considered a recommendation to buy or sell any security. Each reader is encouraged to consult with his or her personal financial adviser and perform their own comprehensive investment research. By opening this page, each reader accepts and agrees to Streetwise Reports’ terms of use and full legal disclaimer. Streetwise Reports does not endorse or recommend the business, products, services or securities of any company.
For additional disclosures, please click here.
John Newell Disclaimer
As always it is important to note that investing in precious metals like silver carries risks, and market conditions can change violently with shock and awe tactics, that we have seen over the past 20 years. Before making any investment decisions, it’s advisable consult with a financial advisor if needed. Also the practice of conducting thorough research and to consider your investment goals and risk tolerance.