Archive for investing – Page 13

COT Futures Metals Charts: Gold, Comex Silver, Copper Grade #1, Platinum and Palladium

By CountingPips.com COT Home | Data Tables | Data Downloads | Newsletter

Here are the latest charts and statistics for the Commitment of Traders (COT) data published by the Commodities Futures Trading Commission (CFTC).

The latest COT data is updated through Tuesday June 22 2021 and shows a quick view of how large traders (for-profit speculators and commercial entities) were positioned in the futures markets.


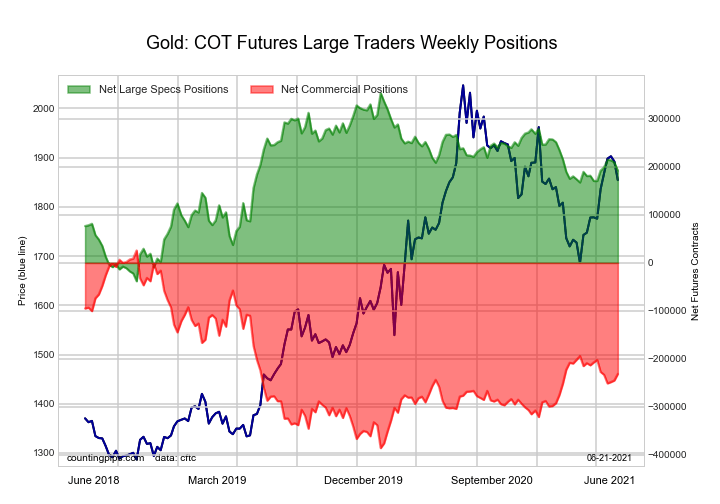
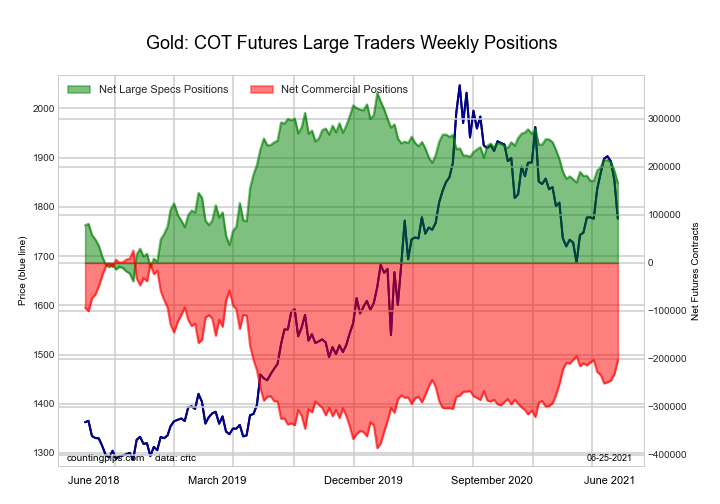
Gold Comex Futures:

Federal Funds 30-Day Bonds Futures COT ChartThe Gold Comex Futures large speculator standing this week was a net position of 166,214 contracts in the data reported through Tuesday. This was a weekly reduction of -25,822 contracts from the previous week which had a total of 192,036 net contracts.

This week’s current strength score (the trader positioning range over the past three years, measured from 0 to 100) shows the speculators are currently Bullish with a score of 52.2 percent. The commercials are Bearish with a score of 44.5 percent and the small traders (not shown in chart) are Bullish with a score of 71.5 percent.

Gold Futures StatisticsSPECULATORSCOMMERCIALSSMALL TRADERS
– Percent of Open Interest Longs:55.823.311.7
– Percent of Open Interest Shorts:19.267.93.7
– Net Position:166,214-202,38236,168
– Gross Longs:253,153105,83053,152
– Gross Shorts:86,939308,21216,984
– Long to Short Ratio:2.9 to 10.3 to 13.1 to 1
NET POSITION TREND:
– COT Index Score (3 Year Range Pct):52.244.571.5
– COT Index Reading (3 Year Range):BullishBearishBullish
NET POSITION MOVEMENT INDEX:
– 6-Week Change in Strength Index:-6.66.03.3


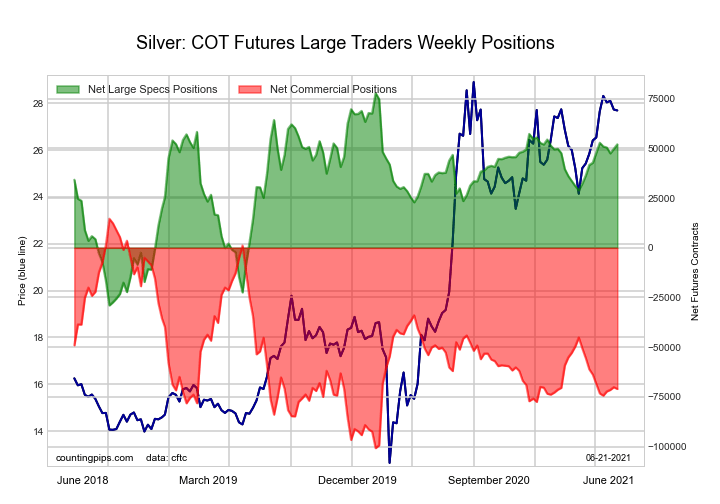
Silver Comex Futures:

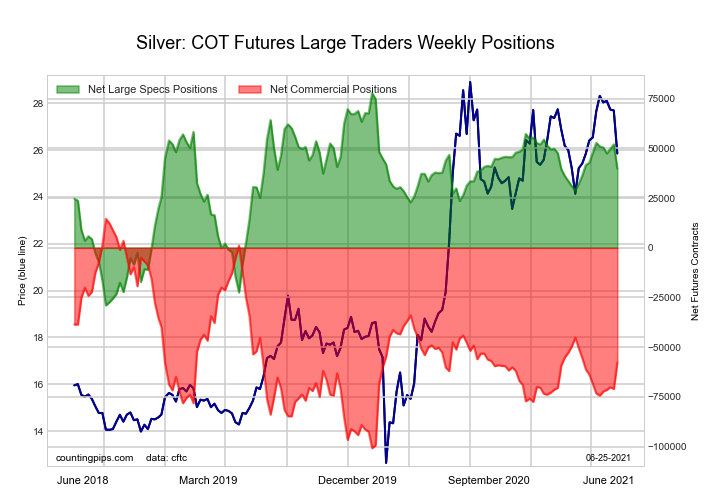
2-Year Treasury Bonds Futures COT ChartThe Silver Comex Futures large speculator standing this week was a net position of 39,871 contracts in the data reported through Tuesday. This was a weekly decline of -12,193 contracts from the previous week which had a total of 52,064 net contracts.

This week’s current strength score (the trader positioning range over the past three years, measured from 0 to 100) shows the speculators are currently Bullish with a score of 64.4 percent. The commercials are Bearish with a score of 37.3 percent and the small traders (not shown in chart) are Bearish with a score of 44.6 percent.

Silver Futures StatisticsSPECULATORSCOMMERCIALSSMALL TRADERS
– Percent of Open Interest Longs:42.033.716.7
– Percent of Open Interest Shorts:19.366.56.5
– Net Position:39,871-57,68217,811
– Gross Longs:73,84159,24329,267
– Gross Shorts:33,970116,92511,456
– Long to Short Ratio:2.2 to 10.5 to 12.6 to 1
NET POSITION TREND:
– COT Index Score (3 Year Range Pct):64.437.344.6
– COT Index Reading (3 Year Range):BullishBearishBearish
NET POSITION MOVEMENT INDEX:
– 6-Week Change in Strength Index:-12.113.5-15.8


Copper Grade #1 Futures:

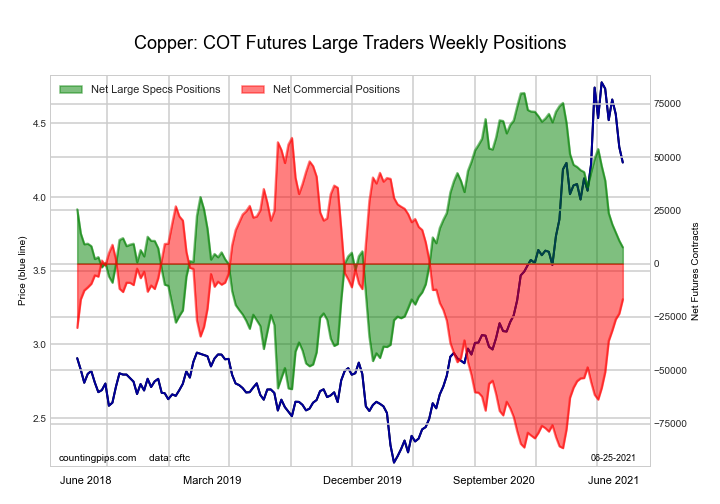
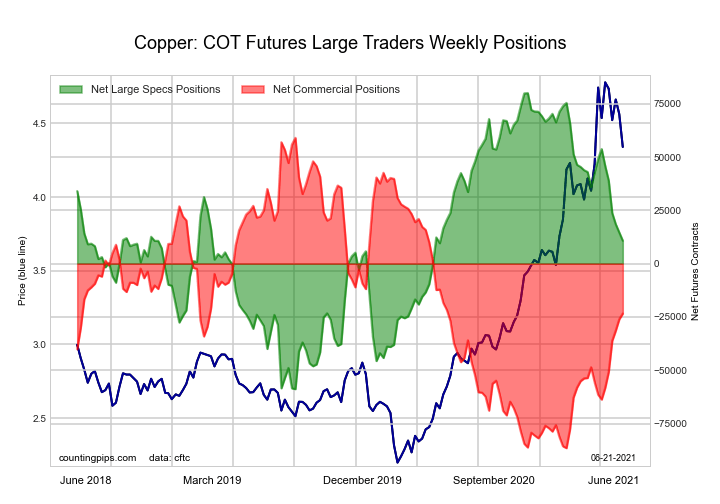
5-Year Treasury Bonds Futures COT ChartThe Copper Grade #1 Futures large speculator standing this week was a net position of 7,686 contracts in the data reported through Tuesday. This was a weekly decrease of -3,085 contracts from the previous week which had a total of 10,771 net contracts.

This week’s current strength score (the trader positioning range over the past three years, measured from 0 to 100) shows the speculators are currently Bearish with a score of 47.9 percent. The commercials are Bearish with a score of 48.0 percent and the small traders (not shown in chart) are Bullish with a score of 77.6 percent.

Copper Futures StatisticsSPECULATORSCOMMERCIALSSMALL TRADERS
– Percent of Open Interest Longs:40.038.210.6
– Percent of Open Interest Shorts:36.346.36.2
– Net Position:7,686-16,7249,038
– Gross Longs:82,54078,77821,914
– Gross Shorts:74,85495,50212,876
– Long to Short Ratio:1.1 to 10.8 to 11.7 to 1
NET POSITION TREND:
– COT Index Score (3 Year Range Pct):47.948.077.6
– COT Index Reading (3 Year Range):BearishBearishBullish
NET POSITION MOVEMENT INDEX:
– 6-Week Change in Strength Index:-27.528.6-20.0


Platinum Futures:

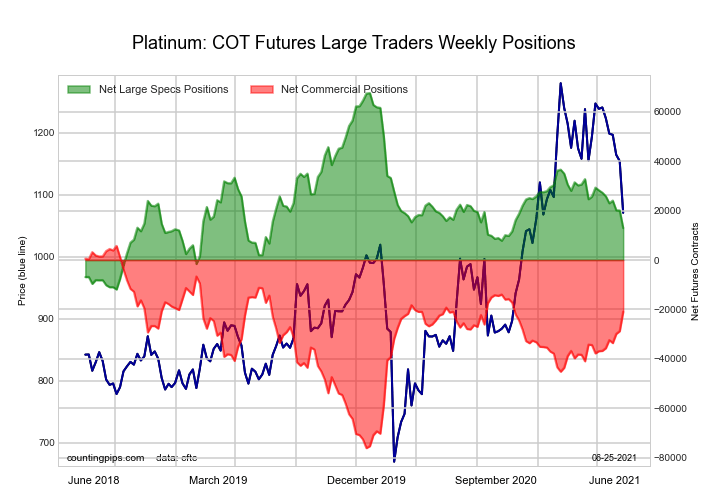
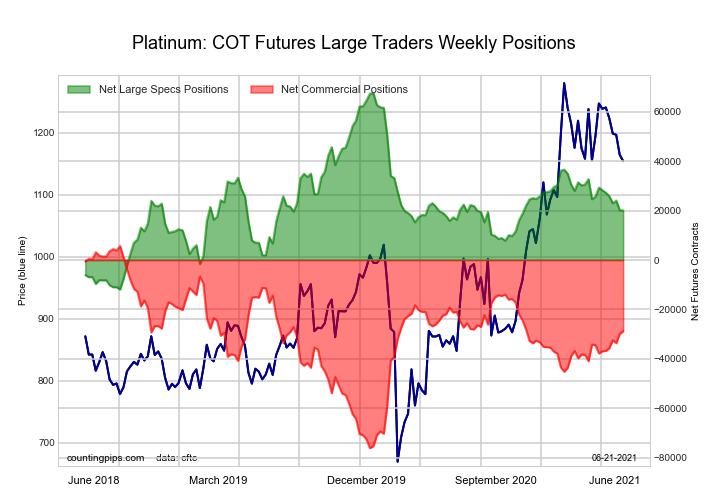
10-Year Treasury Notes Bonds Futures COT ChartThe Platinum Futures large speculator standing this week was a net position of 12,940 contracts in the data reported through Tuesday. This was a weekly decrease of -7,117 contracts from the previous week which had a total of 20,057 net contracts.

This week’s current strength score (the trader positioning range over the past three years, measured from 0 to 100) shows the speculators are currently Bearish with a score of 31.3 percent. The commercials are Bullish with a score of 67.5 percent and the small traders (not shown in chart) are Bullish with a score of 73.5 percent.

Platinum Futures StatisticsSPECULATORSCOMMERCIALSSMALL TRADERS
– Percent of Open Interest Longs:50.329.517.4
– Percent of Open Interest Shorts:29.962.54.8
– Net Position:12,940-20,9257,985
– Gross Longs:31,83018,64810,996
– Gross Shorts:18,89039,5733,011
– Long to Short Ratio:1.7 to 10.5 to 13.7 to 1
NET POSITION TREND:
– COT Index Score (3 Year Range Pct):31.367.573.5
– COT Index Reading (3 Year Range):BearishBullishBullish
NET POSITION MOVEMENT INDEX:
– 6-Week Change in Strength Index:-18.019.4-21.5


Palladium Futures:

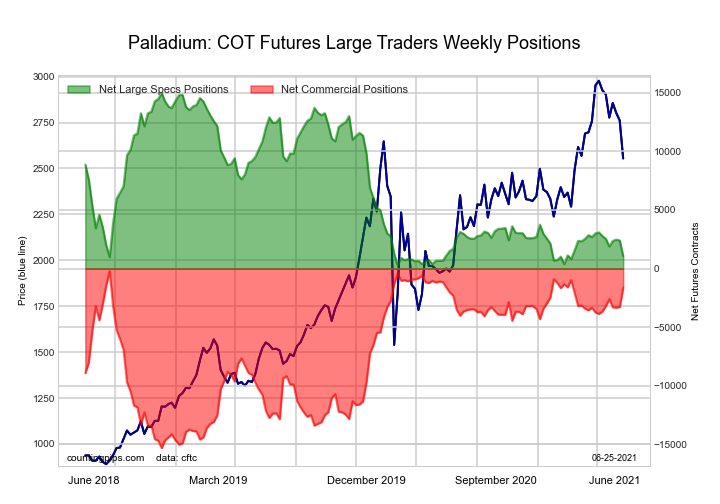
Ultra 10-Year Treasury Notes Bonds Futures COT ChartThe Palladium Futures large speculator standing this week was a net position of 1,072 contracts in the data reported through Tuesday. This was a weekly decrease of -1,331 contracts from the previous week which had a total of 2,403 net contracts.

This week’s current strength score (the trader positioning range over the past three years, measured from 0 to 100) shows the speculators are currently Bearish-Extreme with a score of 5.3 percent. The commercials are Bullish-Extreme with a score of 90.6 percent and the small traders (not shown in chart) are Bullish with a score of 77.5 percent.

Palladium Futures StatisticsSPECULATORSCOMMERCIALSSMALL TRADERS
– Percent of Open Interest Longs:48.634.414.7
– Percent of Open Interest Shorts:36.952.18.7
– Net Position:1,072-1,626554
– Gross Longs:4,4743,1731,353
– Gross Shorts:3,4024,799799
– Long to Short Ratio:1.3 to 10.7 to 11.7 to 1
NET POSITION TREND:
– COT Index Score (3 Year Range Pct):5.390.677.5
– COT Index Reading (3 Year Range):Bearish-ExtremeBullish-ExtremeBullish
NET POSITION MOVEMENT INDEX:
– 6-Week Change in Strength Index:-11.613.4-18.7


Article By CountingPips.comReceive our weekly COT Reports by Email

*COT Report: The COT data, released weekly to the public each Friday, is updated through the most recent Tuesday (data is 3 days old) and shows a quick view of how large speculators or non-commercials (for-profit traders) were positioned in the futures markets.

The CFTC categorizes trader positions according to commercial hedgers (traders who use futures contracts for hedging as part of the business), non-commercials (large traders who speculate to realize trading profits) and nonreportable traders (usually small traders/speculators).

Find CFTC criteria here: (http://www.cftc.gov/MarketReports/CommitmentsofTraders/ExplanatoryNotes/index.htm).

COT Stock Market Futures Charts: VIX, Dow, Nasdaq, SP500, Russell-2000, Emerging Markets

By CountingPips.com COT Home | Data Tables | Data Downloads | Newsletter

Here are the latest charts and statistics for the Commitment of Traders (COT) data published by the Commodities Futures Trading Commission (CFTC).

The latest COT data is updated through Tuesday June 22 2021 and shows a quick view of how large traders (for-profit speculators and commercial entities) were positioned in the futures markets.


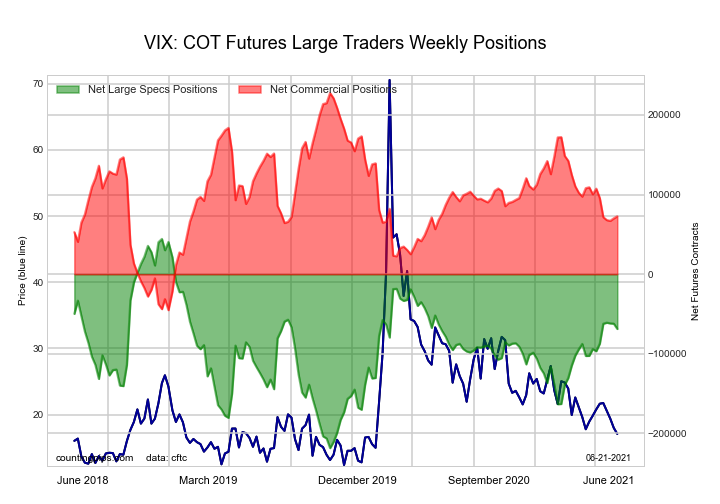
VIX Volatility Futures Futures:

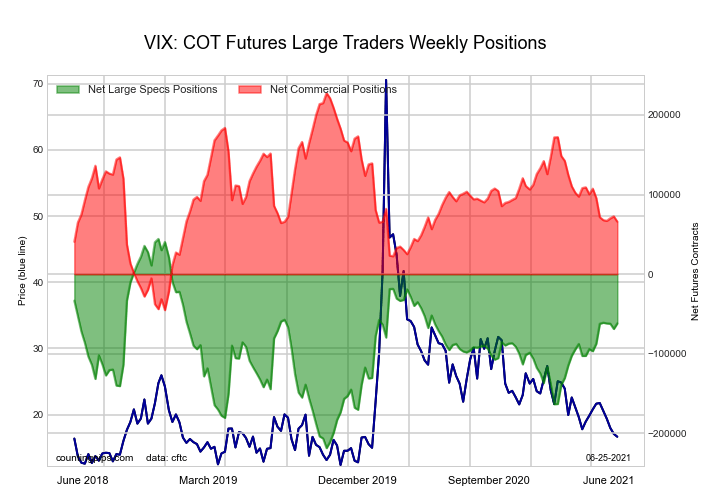
Federal Funds 30-Day Bonds Futures COT ChartThe VIX Volatility Futures large speculator standing this week totaled a net position of -61,776 contracts in the data reported through Tuesday. This was a weekly boost of 6,971 contracts from the previous week which had a total of -68,747 net contracts.

This week’s current strength score (the trader positioning range over the past three years, measured from 0 to 100) shows the speculators are currently Bullish with a score of 59.6 percent. The commercials are Bearish with a score of 40.7 percent and the small traders (not shown in chart) are Bearish with a score of 40.6 percent.

VIX Volatility Futures StatisticsSPECULATORSCOMMERCIALSSMALL TRADERS
– Percent of Open Interest Longs:23.149.37.0
– Percent of Open Interest Shorts:42.528.58.3
– Net Position:-61,77665,947-4,171
– Gross Longs:73,154156,28522,256
– Gross Shorts:134,93090,33826,427
– Long to Short Ratio:0.5 to 11.7 to 10.8 to 1
NET POSITION TREND:
– COT Index Score (3 Year Range Pct):59.640.740.6
– COT Index Reading (3 Year Range):BullishBearishBearish
NET POSITION MOVEMENT INDEX:
– 6-Week Change in Strength Index:9.7-10.915.7


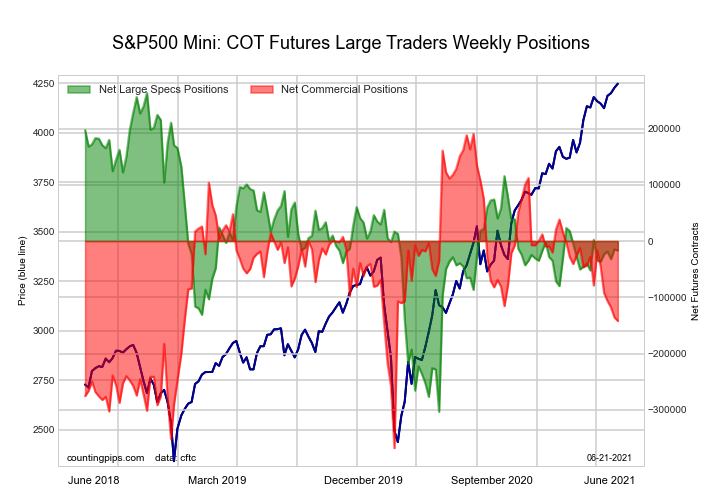
S&P500 Mini Futures Futures:

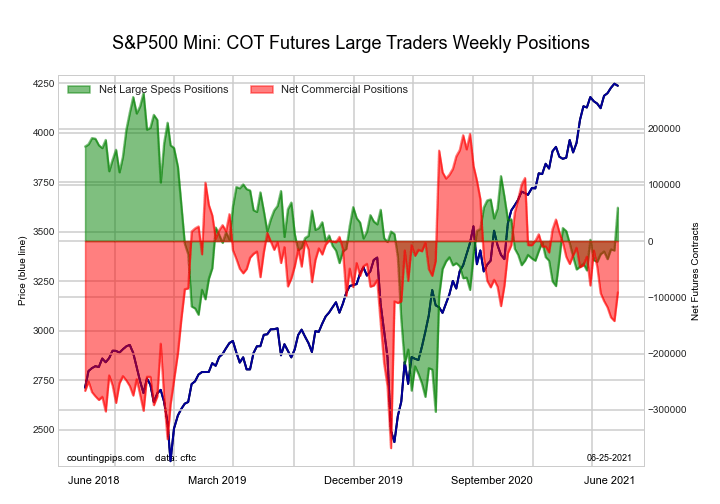
2-Year Treasury Bonds Futures COT ChartThe S&P500 Mini Futures large speculator standing this week totaled a net position of 59,335 contracts in the data reported through Tuesday. This was a weekly increase of 75,998 contracts from the previous week which had a total of -16,663 net contracts.

This week’s current strength score (the trader positioning range over the past three years, measured from 0 to 100) shows the speculators are currently Bullish with a score of 64.0 percent. The commercials are Bearish with a score of 49.5 percent and the small traders (not shown in chart) are Bearish with a score of 33.1 percent.

S&P500 Mini Futures StatisticsSPECULATORSCOMMERCIALSSMALL TRADERS
– Percent of Open Interest Longs:14.272.910.5
– Percent of Open Interest Shorts:11.976.59.2
– Net Position:59,335-91,33131,996
– Gross Longs:364,2401,869,036268,915
– Gross Shorts:304,9051,960,367236,919
– Long to Short Ratio:1.2 to 11.0 to 11.1 to 1
NET POSITION TREND:
– COT Index Score (3 Year Range Pct):64.049.533.1
– COT Index Reading (3 Year Range):BullishBearishBearish
NET POSITION MOVEMENT INDEX:
– 6-Week Change in Strength Index:17.0-8.3-10.5


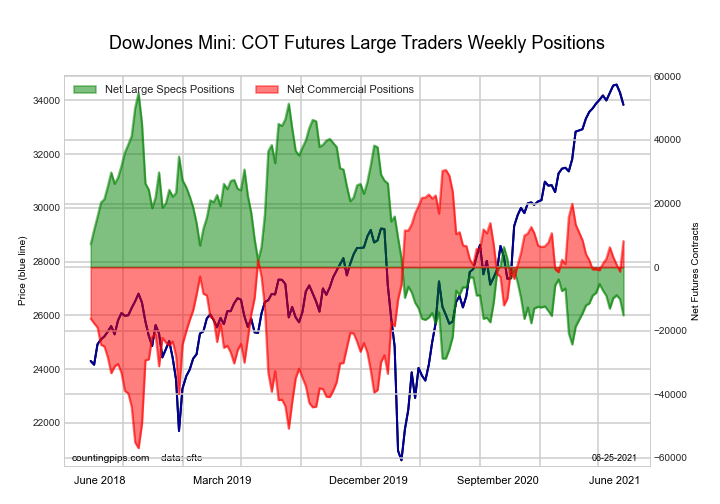
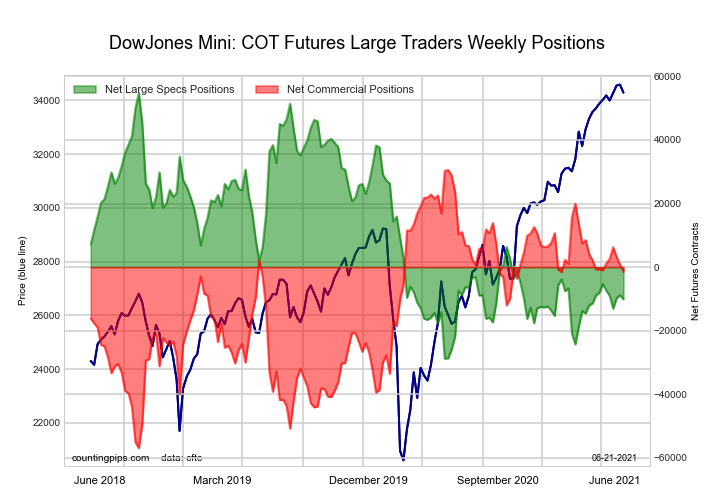
Dow Jones Mini Futures Futures:

5-Year Treasury Bonds Futures COT ChartThe Dow Jones Mini Futures large speculator standing this week totaled a net position of -15,147 contracts in the data reported through Tuesday. This was a weekly fall of -5,058 contracts from the previous week which had a total of -10,089 net contracts.

This week’s current strength score (the trader positioning range over the past three years, measured from 0 to 100) shows the speculators are currently Bearish-Extreme with a score of 16.3 percent. The commercials are Bullish with a score of 74.4 percent and the small traders (not shown in chart) are Bullish with a score of 75.6 percent.

Dow Jones Mini Futures StatisticsSPECULATORSCOMMERCIALSSMALL TRADERS
– Percent of Open Interest Longs:27.251.017.3
– Percent of Open Interest Shorts:41.943.010.5
– Net Position:-15,1478,2076,940
– Gross Longs:27,86152,33417,758
– Gross Shorts:43,00844,12710,818
– Long to Short Ratio:0.6 to 11.2 to 11.6 to 1
NET POSITION TREND:
– COT Index Score (3 Year Range Pct):16.374.475.6
– COT Index Reading (3 Year Range):Bearish-ExtremeBullishBullish
NET POSITION MOVEMENT INDEX:
– 6-Week Change in Strength Index:-9.38.13.9


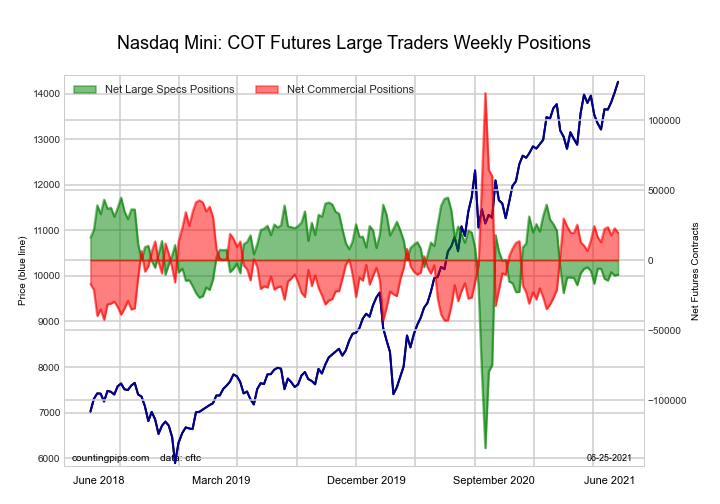
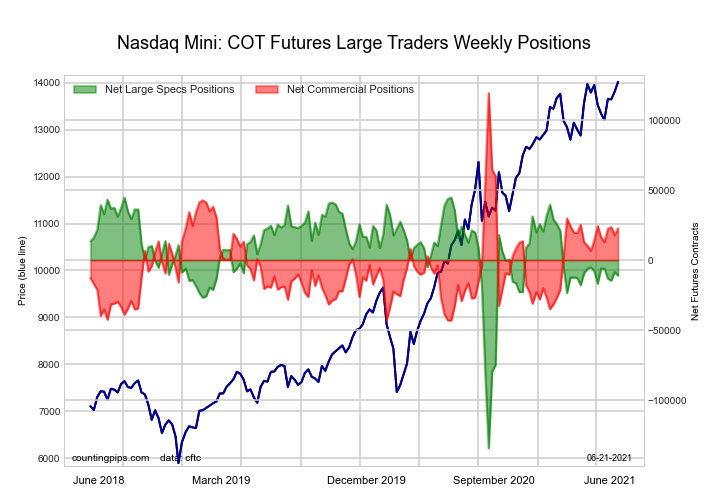
Nasdaq Mini Futures Futures:

10-Year Treasury Notes Bonds Futures COT ChartThe Nasdaq Mini Futures large speculator standing this week totaled a net position of -10,365 contracts in the data reported through Tuesday. This was a weekly rise of 669 contracts from the previous week which had a total of -11,034 net contracts.

This week’s current strength score (the trader positioning range over the past three years, measured from 0 to 100) shows the speculators are currently Bullish with a score of 69.2 percent. The commercials are Bearish with a score of 38.5 percent and the small traders (not shown in chart) are Bearish with a score of 23.5 percent.

Nasdaq Mini Futures StatisticsSPECULATORSCOMMERCIALSSMALL TRADERS
– Percent of Open Interest Longs:26.357.115.5
– Percent of Open Interest Shorts:30.948.419.5
– Net Position:-10,36519,496-9,131
– Gross Longs:58,747127,85734,576
– Gross Shorts:69,112108,36143,707
– Long to Short Ratio:0.9 to 11.2 to 10.8 to 1
NET POSITION TREND:
– COT Index Score (3 Year Range Pct):69.238.523.5
– COT Index Reading (3 Year Range):BullishBearishBearish
NET POSITION MOVEMENT INDEX:
– 6-Week Change in Strength Index:-2.41.92.9


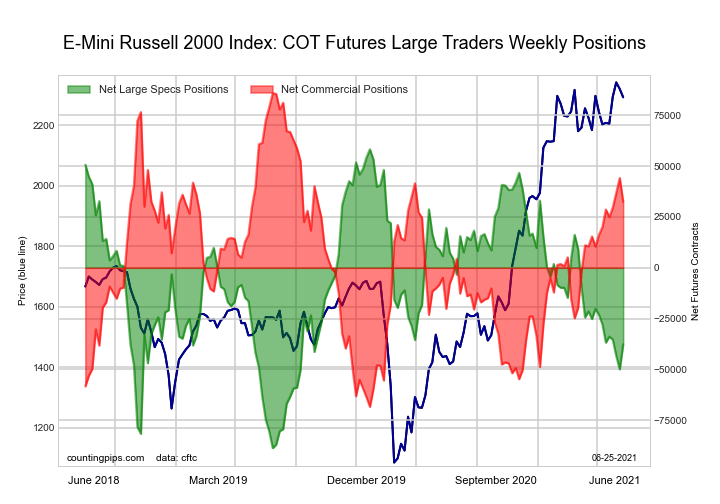
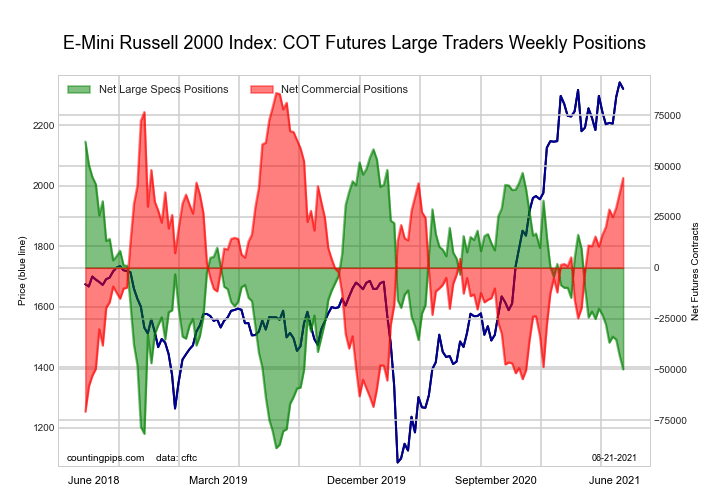
Russell 2000 Mini Futures Futures:

Ultra 10-Year Treasury Notes Bonds Futures COT ChartThe Russell 2000 Mini Futures large speculator standing this week totaled a net position of -37,648 contracts in the data reported through Tuesday. This was a weekly gain of 12,319 contracts from the previous week which had a total of -49,967 net contracts.

This week’s current strength score (the trader positioning range over the past three years, measured from 0 to 100) shows the speculators are currently Bearish with a score of 34.7 percent. The commercials are Bullish with a score of 65.3 percent and the small traders (not shown in chart) are Bearish with a score of 47.8 percent.

Russell 2000 Mini Futures StatisticsSPECULATORSCOMMERCIALSSMALL TRADERS
– Percent of Open Interest Longs:12.181.06.2
– Percent of Open Interest Shorts:21.173.15.0
– Net Position:-37,64832,4395,209
– Gross Longs:50,033335,76925,858
– Gross Shorts:87,681303,33020,649
– Long to Short Ratio:0.6 to 11.1 to 11.3 to 1
NET POSITION TREND:
– COT Index Score (3 Year Range Pct):34.765.347.8
– COT Index Reading (3 Year Range):BearishBullishBearish
NET POSITION MOVEMENT INDEX:
– 6-Week Change in Strength Index:-6.78.0-7.2


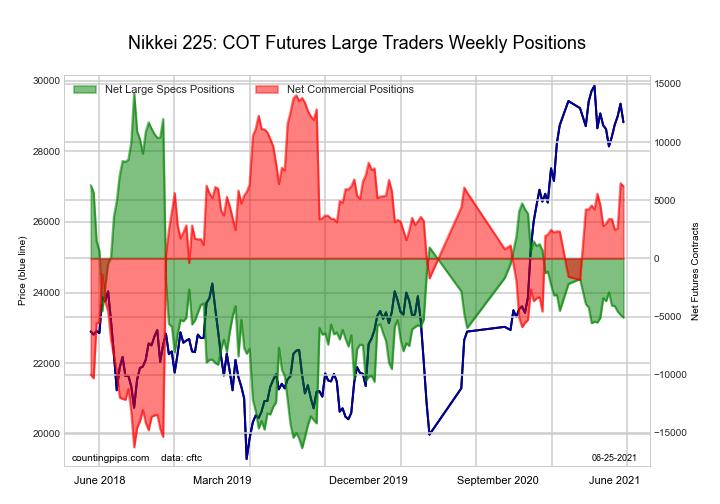
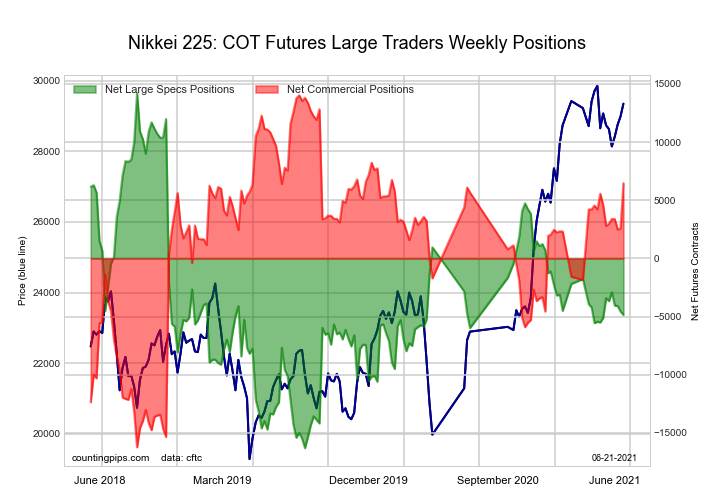
Nikkei Stock Average (USD) Futures Futures:

US Year Treasury Notes Long Bonds Futures COT ChartThe Nikkei Stock Average (USD) Futures large speculator standing this week totaled a net position of -5,081 contracts in the data reported through Tuesday. This was a weekly lowering of -233 contracts from the previous week which had a total of -4,848 net contracts.

This week’s current strength score (the trader positioning range over the past three years, measured from 0 to 100) shows the speculators are currently Bearish with a score of 36.8 percent. The commercials are Bullish with a score of 74.1 percent and the small traders (not shown in chart) are Bearish-Extreme with a score of 5.8 percent.

Nikkei Stock Average Futures StatisticsSPECULATORSCOMMERCIALSSMALL TRADERS
– Percent of Open Interest Longs:14.760.424.8
– Percent of Open Interest Shorts:46.521.631.8
– Net Position:-5,0816,200-1,119
– Gross Longs:2,3529,6513,965
– Gross Shorts:7,4333,4515,084
– Long to Short Ratio:0.3 to 12.8 to 10.8 to 1
NET POSITION TREND:
– COT Index Score (3 Year Range Pct):36.874.15.8
– COT Index Reading (3 Year Range):BearishBullishBearish-Extreme
NET POSITION MOVEMENT INDEX:
– 6-Week Change in Strength Index:-4.710.6-20.9


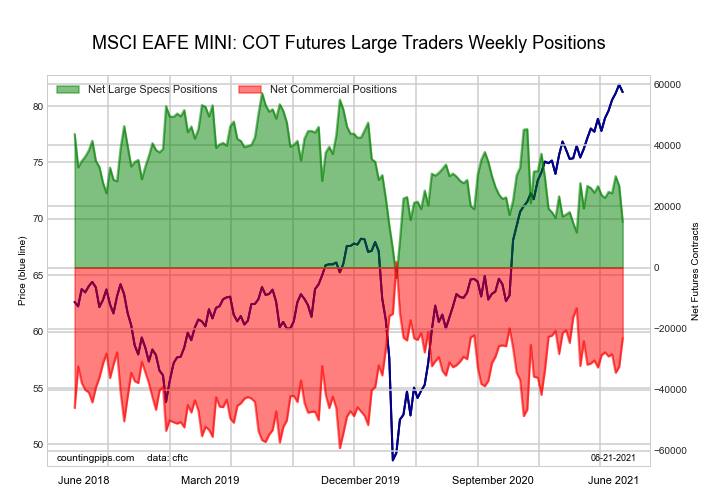
MSCI EAFE Mini Futures Futures:

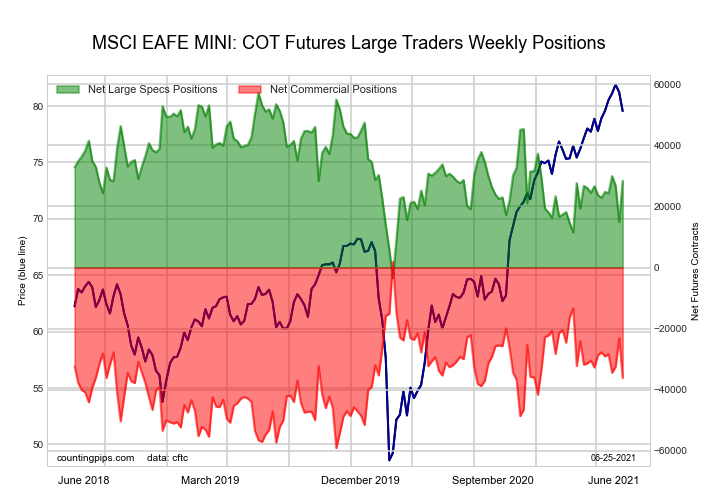
Ultra US Year Treasury Notes Long Bonds Futures COT ChartThe MSCI EAFE Mini Futures large speculator standing this week totaled a net position of 28,409 contracts in the data reported through Tuesday. This was a weekly lift of 13,479 contracts from the previous week which had a total of 14,930 net contracts.

This week’s current strength score (the trader positioning range over the past three years, measured from 0 to 100) shows the speculators are currently Bullish with a score of 52.5 percent. The commercials are Bearish with a score of 37.7 percent and the small traders (not shown in chart) are Bullish-Extreme with a score of 86.5 percent.

MSCI EAFE Mini Futures StatisticsSPECULATORSCOMMERCIALSSMALL TRADERS
– Percent of Open Interest Longs:9.987.02.8
– Percent of Open Interest Shorts:3.095.80.9
– Net Position:28,409-36,1787,769
– Gross Longs:40,821357,36511,607
– Gross Shorts:12,412393,5433,838
– Long to Short Ratio:3.3 to 10.9 to 13.0 to 1
NET POSITION TREND:
– COT Index Score (3 Year Range Pct):52.537.786.5
– COT Index Reading (3 Year Range):BullishBearishBullish-Extreme
NET POSITION MOVEMENT INDEX:
– 6-Week Change in Strength Index:9.2-13.825.9


MSCI Emerging Mkts Mini Futures Futures:

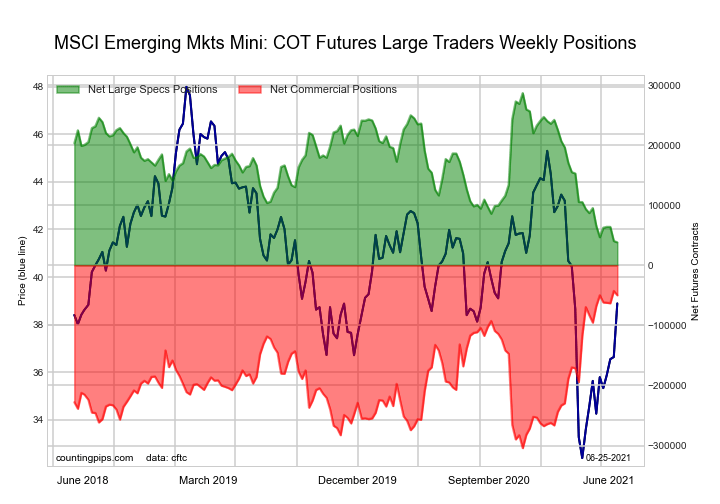
Eurodollar Bonds Futures COT ChartThe MSCI Emerging Mkts Mini Futures large speculator standing this week totaled a net position of 38,211 contracts in the data reported through Tuesday. This was a weekly decrease of -2,219 contracts from the previous week which had a total of 40,430 net contracts.

This week’s current strength score (the trader positioning range over the past three years, measured from 0 to 100) shows the speculators are currently Bearish-Extreme with a score of 0.0 percent. The commercials are Bullish-Extreme with a score of 97.2 percent and the small traders (not shown in chart) are Bearish with a score of 40.4 percent.

MSCI Emerging Mkts Mini Futures StatisticsSPECULATORSCOMMERCIALSSMALL TRADERS
– Percent of Open Interest Longs:14.382.22.4
– Percent of Open Interest Shorts:11.086.51.3
– Net Position:38,211-49,88611,675
– Gross Longs:165,150950,68527,250
– Gross Shorts:126,9391,000,57115,575
– Long to Short Ratio:1.3 to 11.0 to 11.7 to 1
NET POSITION TREND:
– COT Index Score (3 Year Range Pct):0.097.240.4
– COT Index Reading (3 Year Range):Bearish-ExtremeBullish-ExtremeBearish
NET POSITION MOVEMENT INDEX:
– 6-Week Change in Strength Index:-11.06.87.3


Article By CountingPips.comReceive our weekly COT Reports by Email

*COT Report: The COT data, released weekly to the public each Friday, is updated through the most recent Tuesday (data is 3 days old) and shows a quick view of how large speculators or non-commercials (for-profit traders) were positioned in the futures markets.

The CFTC categorizes trader positions according to commercial hedgers (traders who use futures contracts for hedging as part of the business), non-commercials (large traders who speculate to realize trading profits) and nonreportable traders (usually small traders/speculators).

Find CFTC criteria here: (http://www.cftc.gov/MarketReports/CommitmentsofTraders/ExplanatoryNotes/index.htm).

COT Energy Futures Charts: Brent Crude Oil Last Day, Natural Gas, Heating Oil NY-Harbor

By CountingPips.com COT Home | Data Tables | Data Downloads | Newsletter

Here are the latest charts and statistics for the Commitment of Traders (COT) data published by the Commodities Futures Trading Commission (CFTC).

The latest COT data is updated through Tuesday June 22 2021 and shows a quick view of how large traders (for-profit speculators and commercial entities) were positioned in the futures markets.


WTI Crude Oil Futures :

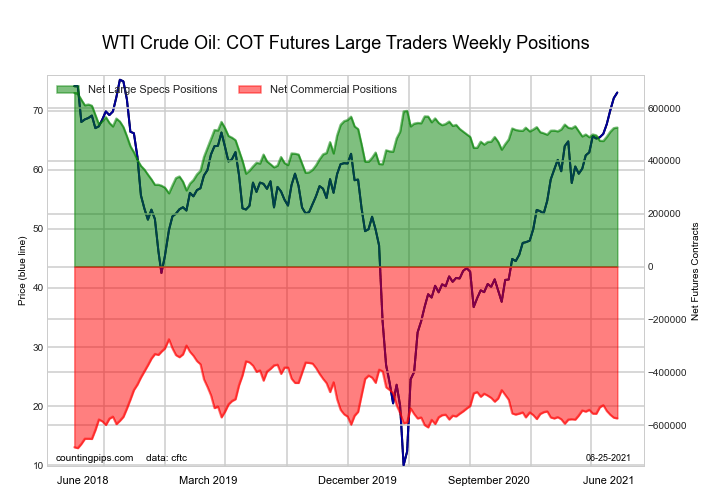
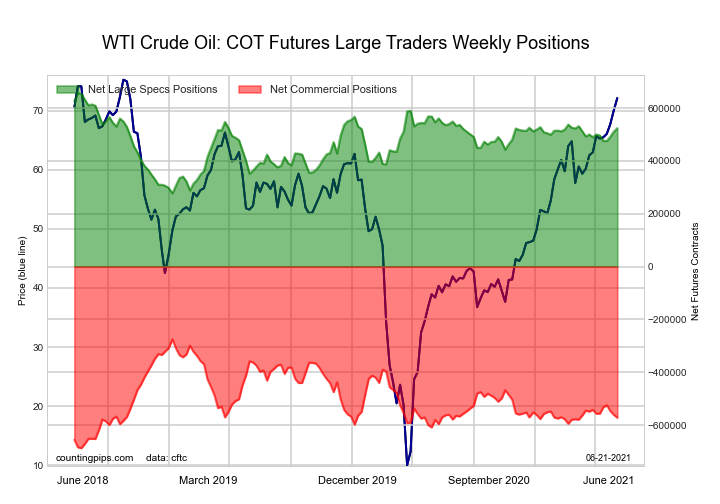
WTI Crude Oil Futures COT ChartThe WTI Crude Oil Futures large speculator standing this week came in at a net position of 526,161 contracts in the data reported through Tuesday. This was a weekly rise of 2,205 contracts from the previous week which had a total of 523,956 net contracts.

This week’s current strength score (the trader positioning range over the past three years, measured from 0 to 100) shows the speculators are currently Bullish with a score of 65.6 percent. The commercials are Bearish with a score of 27.4 percent and the small traders (not shown in chart) are Bullish-Extreme with a score of 83.1 percent.

WTI Crude Oil Futures StatisticsSPECULATORSCOMMERCIALSSMALL TRADERS
– Percent of Open Interest Longs:28.532.44.4
– Percent of Open Interest Shorts:6.156.82.3
– Net Position:526,161-574,43848,277
– Gross Longs:669,980759,883102,600
– Gross Shorts:143,8191,334,32154,323
– Long to Short Ratio:4.7 to 10.6 to 11.9 to 1
NET POSITION TREND:
– COT Index Score (3 Year Range Pct):65.627.483.1
– COT Index Reading (3 Year Range):BullishBearishBullish-Extreme
NET POSITION MOVEMENT INDEX:
– 6-Week Change in Strength Index:7.8-4.3-16.9


Brent Crude Oil Futures :

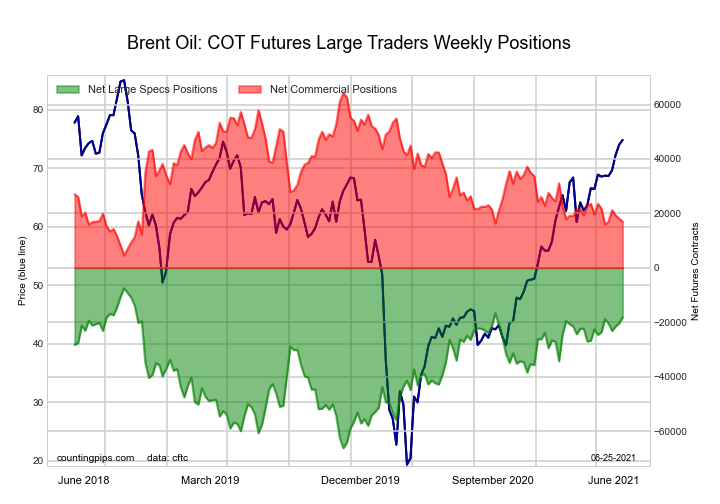
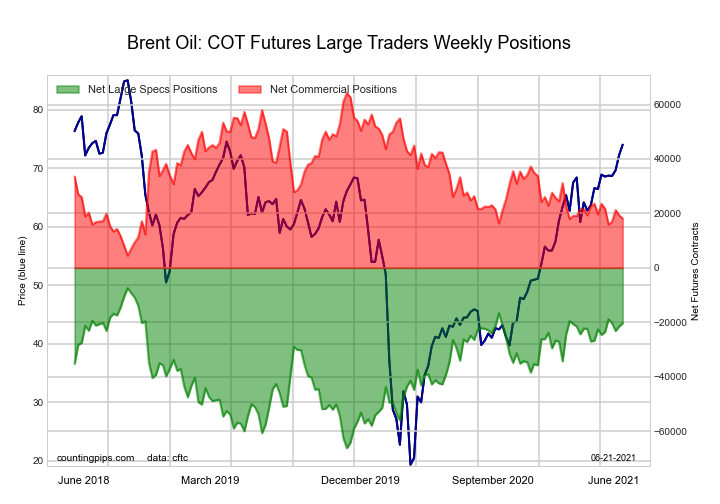
Brent Last Day Crude Oil Futures COT ChartThe Brent Crude Oil Futures large speculator standing this week came in at a net position of -18,167 contracts in the data reported through Tuesday. This was a weekly increase of 2,187 contracts from the previous week which had a total of -20,354 net contracts.

This week’s current strength score (the trader positioning range over the past three years, measured from 0 to 100) shows the speculators are currently Bullish-Extreme with a score of 81.7 percent. The commercials are Bearish with a score of 20.8 percent and the small traders (not shown in chart) are Bearish with a score of 46.0 percent.

Brent Crude Oil Futures StatisticsSPECULATORSCOMMERCIALSSMALL TRADERS
– Percent of Open Interest Longs:18.847.93.9
– Percent of Open Interest Shorts:27.639.63.3
– Net Position:-18,16716,9581,209
– Gross Longs:38,71298,7138,069
– Gross Shorts:56,87981,7556,860
– Long to Short Ratio:0.7 to 11.2 to 11.2 to 1
NET POSITION TREND:
– COT Index Score (3 Year Range Pct):81.720.846.0
– COT Index Reading (3 Year Range):Bullish-ExtremeBearishBearish
NET POSITION MOVEMENT INDEX:
– 6-Week Change in Strength Index:9.2-8.0-5.4


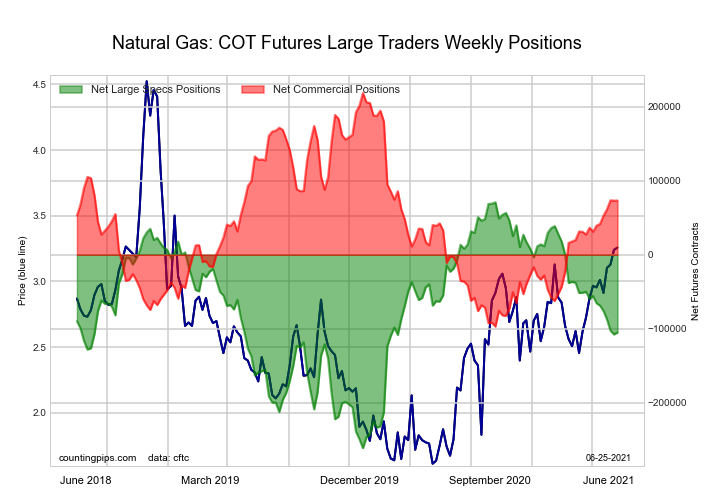
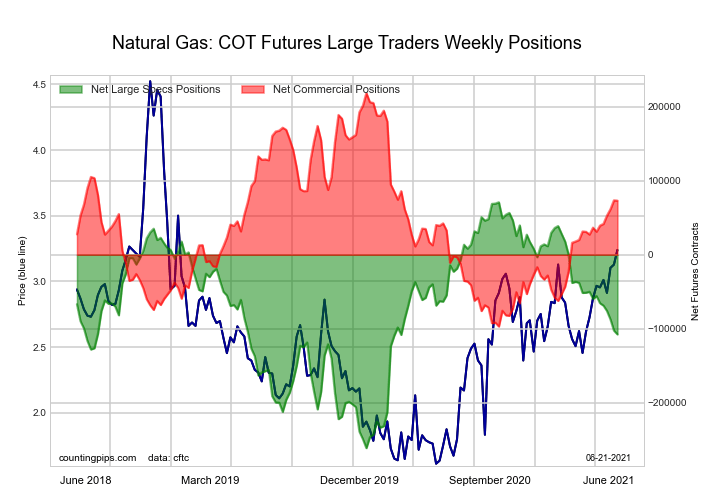
Natural Gas Futures :

Natural Gas Futures COT ChartThe Natural Gas Futures large speculator standing this week came in at a net position of -105,098 contracts in the data reported through Tuesday. This was a weekly advance of 2,598 contracts from the previous week which had a total of -107,696 net contracts.

This week’s current strength score (the trader positioning range over the past three years, measured from 0 to 100) shows the speculators are currently Bearish with a score of 47.0 percent. The commercials are Bullish with a score of 54.0 percent and the small traders (not shown in chart) are Bearish with a score of 48.9 percent.

Natural Gas Futures StatisticsSPECULATORSCOMMERCIALSSMALL TRADERS
– Percent of Open Interest Longs:26.641.74.7
– Percent of Open Interest Shorts:34.736.12.3
– Net Position:-105,09873,34131,757
– Gross Longs:345,041540,92961,081
– Gross Shorts:450,139467,58829,324
– Long to Short Ratio:0.8 to 11.2 to 12.1 to 1
NET POSITION TREND:
– COT Index Score (3 Year Range Pct):47.054.048.9
– COT Index Reading (3 Year Range):BearishBullishBearish
NET POSITION MOVEMENT INDEX:
– 6-Week Change in Strength Index:-11.910.718.0


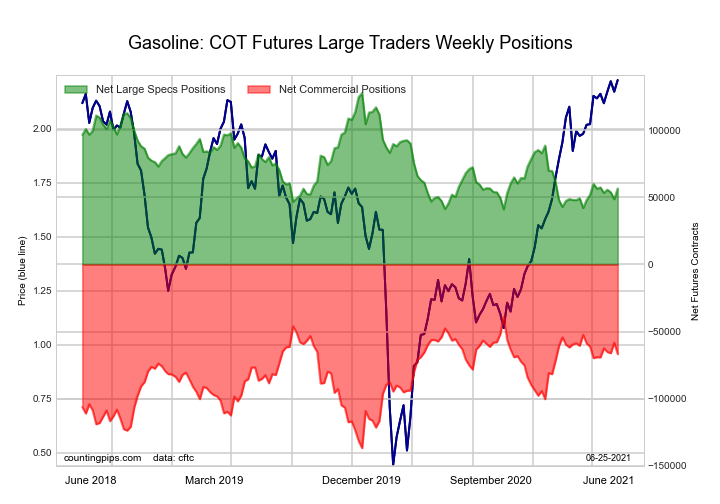
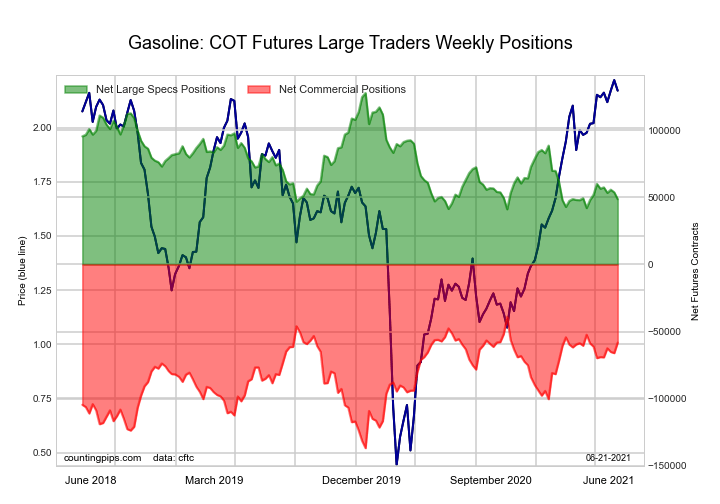
Gasoline Blendstock Futures :

RBOB Gasoline Energy Futures COT ChartThe Gasoline Blendstock Futures large speculator standing this week came in at a net position of 56,558 contracts in the data reported through Tuesday. This was a weekly increase of 7,915 contracts from the previous week which had a total of 48,643 net contracts.

This week’s current strength score (the trader positioning range over the past three years, measured from 0 to 100) shows the speculators are currently Bearish-Extreme with a score of 17.8 percent. The commercials are Bullish with a score of 71.8 percent and the small traders (not shown in chart) are Bullish with a score of 72.9 percent.

Nasdaq Mini Futures StatisticsSPECULATORSCOMMERCIALSSMALL TRADERS
– Percent of Open Interest Longs:22.950.85.7
– Percent of Open Interest Shorts:9.566.73.3
– Net Position:56,558-66,81910,261
– Gross Longs:96,346213,27724,140
– Gross Shorts:39,788280,09613,879
– Long to Short Ratio:2.4 to 10.8 to 11.7 to 1
NET POSITION TREND:
– COT Index Score (3 Year Range Pct):17.871.872.9
– COT Index Reading (3 Year Range):Bearish-ExtremeBullishBullish
NET POSITION MOVEMENT INDEX:
– 6-Week Change in Strength Index:0.12.3-13.7


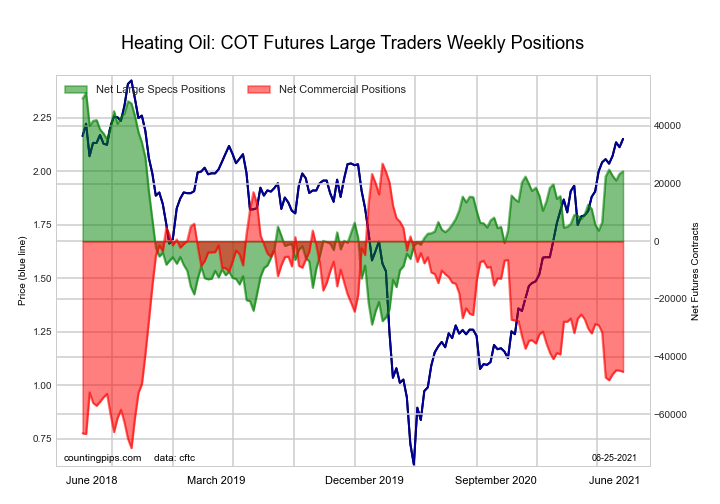
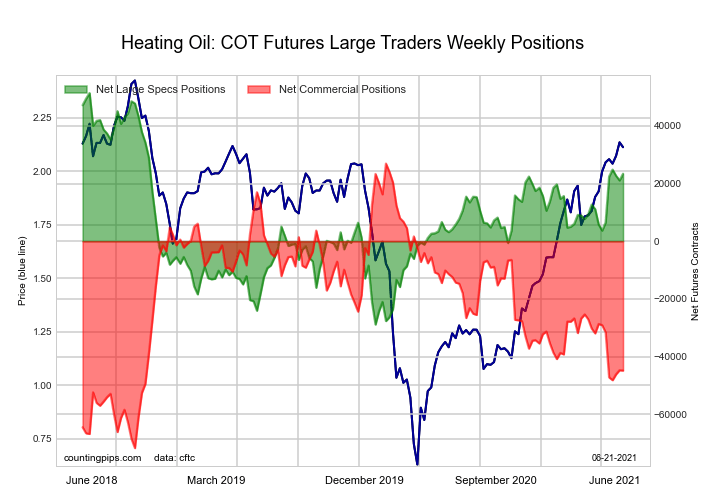
#2 Heating Oil NY-Harbor Futures :

NY Harbor Heating Oil Energy Futures COT ChartThe #2 Heating Oil NY-Harbor Futures large speculator standing this week came in at a net position of 24,219 contracts in the data reported through Tuesday. This was a weekly increase of 824 contracts from the previous week which had a total of 23,395 net contracts.

This week’s current strength score (the trader positioning range over the past three years, measured from 0 to 100) shows the speculators are currently Bullish with a score of 66.2 percent. The commercials are Bearish with a score of 26.8 percent and the small traders (not shown in chart) are Bullish-Extreme with a score of 82.4 percent.

Heating Oil Futures StatisticsSPECULATORSCOMMERCIALSSMALL TRADERS
– Percent of Open Interest Longs:16.850.411.5
– Percent of Open Interest Shorts:11.260.96.6
– Net Position:24,219-45,20120,982
– Gross Longs:72,337216,81549,487
– Gross Shorts:48,118262,01628,505
– Long to Short Ratio:1.5 to 10.8 to 11.7 to 1
NET POSITION TREND:
– COT Index Score (3 Year Range Pct):66.226.882.4
– COT Index Reading (3 Year Range):BullishBearishBullish-Extreme
NET POSITION MOVEMENT INDEX:
– 6-Week Change in Strength Index:22.1-13.8-16.3


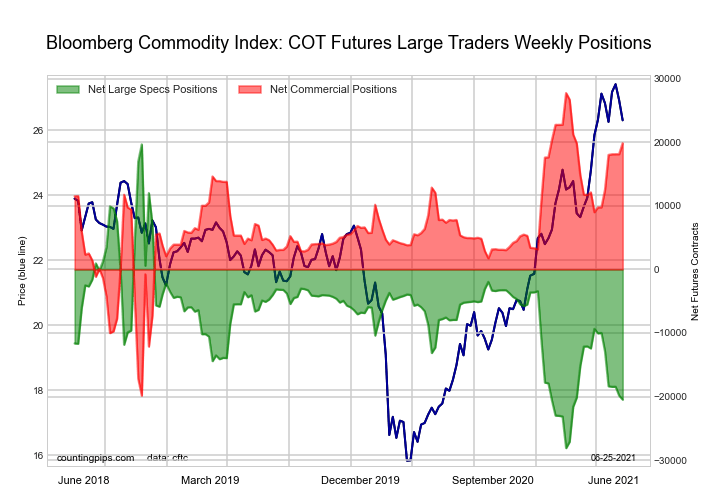
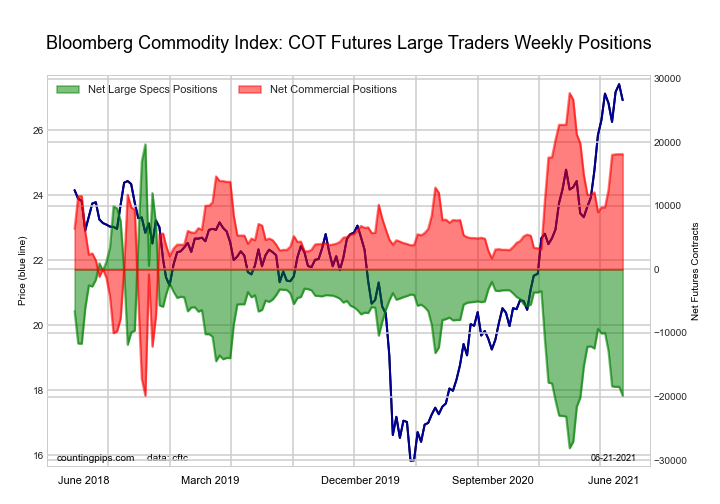
Bloomberg Commodity Index Futures :

Bloomberg Commodity Index Futures COT ChartThe Bloomberg Commodity Index Futures large speculator standing this week came in at a net position of -20,482 contracts in the data reported through Tuesday. This was a weekly decrease of -633 contracts from the previous week which had a total of -19,849 net contracts.

This week’s current strength score (the trader positioning range over the past three years, measured from 0 to 100) shows the speculators are currently Bearish-Extreme with a score of 16.0 percent. The commercials are Bullish-Extreme with a score of 83.4 percent and the small traders (not shown in chart) are Bullish with a score of 51.8 percent.

Bloomberg Index Futures StatisticsSPECULATORSCOMMERCIALSSMALL TRADERS
– Percent of Open Interest Longs:48.050.41.6
– Percent of Open Interest Shorts:92.47.40.2
– Net Position:-20,48219,856626
– Gross Longs:22,16323,256729
– Gross Shorts:42,6453,400103
– Long to Short Ratio:0.5 to 16.8 to 17.1 to 1
NET POSITION TREND:
– COT Index Score (3 Year Range Pct):16.083.451.8
– COT Index Reading (3 Year Range):Bearish-ExtremeBullish-ExtremeBullish
NET POSITION MOVEMENT INDEX:
– 6-Week Change in Strength Index:-22.021.217.8


Article By CountingPips.comReceive our weekly COT Reports by Email

*COT Report: The COT data, released weekly to the public each Friday, is updated through the most recent Tuesday (data is 3 days old) and shows a quick view of how large speculators or non-commercials (for-profit traders) were positioned in the futures markets.

The CFTC categorizes trader positions according to commercial hedgers (traders who use futures contracts for hedging as part of the business), non-commercials (large traders who speculate to realize trading profits) and nonreportable traders (usually small traders/speculators).

Find CFTC criteria here: (http://www.cftc.gov/MarketReports/CommitmentsofTraders/ExplanatoryNotes/index.htm).

COT Soft Commodities Futures Charts: Corn, Soybean Meal, Wheat, Cattle, Hogs, Sugar and Coffee

By CountingPips.com COT Home | Data Tables | Data Downloads | Newsletter

Here are the latest charts and statistics for the Commitment of Traders (COT) data published by the Commodities Futures Trading Commission (CFTC).

The latest COT data is updated through Tuesday June 22 2021 and shows a quick view of how large traders (for-profit speculators and commercial entities) were positioned in the futures markets.


CORN Futures:

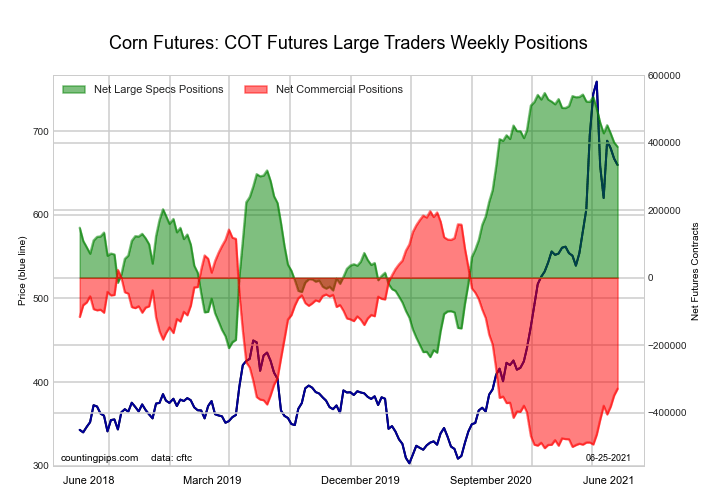
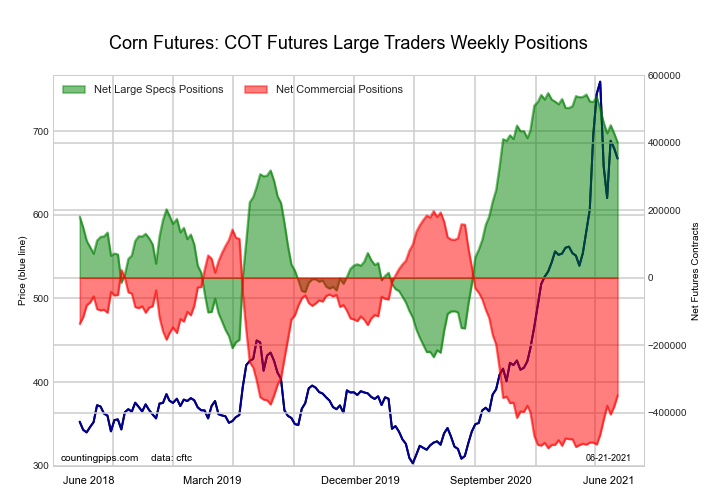
Federal Funds 30-Day Bonds Futures COT ChartThe CORN large speculator standing this week totaled a net position of 388,411 contracts in the data reported through Tuesday. This was a weekly fall of -12,965 contracts from the previous week which had a total of 401,376 net contracts.

This week’s current strength score (the trader positioning range over the past three years, measured from 0 to 100) shows the speculators are currently Bullish with a score of 79.7 percent. The commercials are Bearish with a score of 25.1 percent and the small traders (not shown in chart) are Bearish-Extreme with a score of 2.0 percent.

CORN Futures StatisticsSPECULATORSCOMMERCIALSSMALL TRADERS
– Percent of Open Interest Longs:29.348.58.2
– Percent of Open Interest Shorts:5.568.711.9
– Net Position:388,411-328,959-59,452
– Gross Longs:478,631791,994134,086
– Gross Shorts:90,2201,120,953193,538
– Long to Short Ratio:5.3 to 10.7 to 10.7 to 1
NET POSITION TREND:
– COT Index Score (3 Year Range Pct):79.725.12.0
– COT Index Reading (3 Year Range):BullishBearishBearish-Extreme
NET POSITION MOVEMENT INDEX:
– 6-Week Change in Strength Index:-14.419.3-14.4


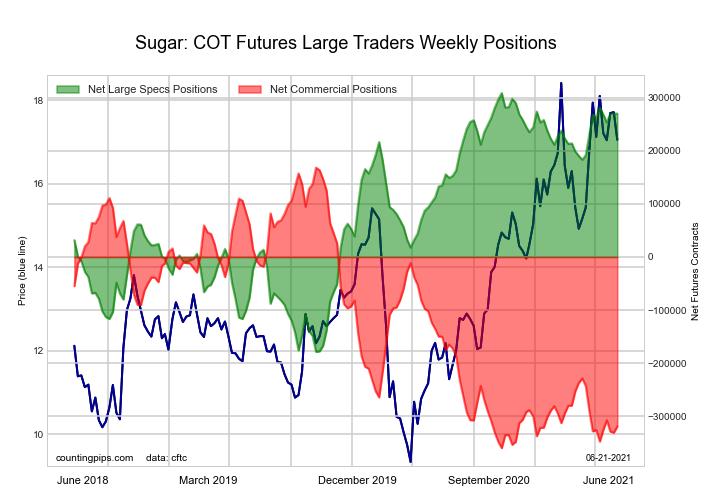
SUGAR Futures:

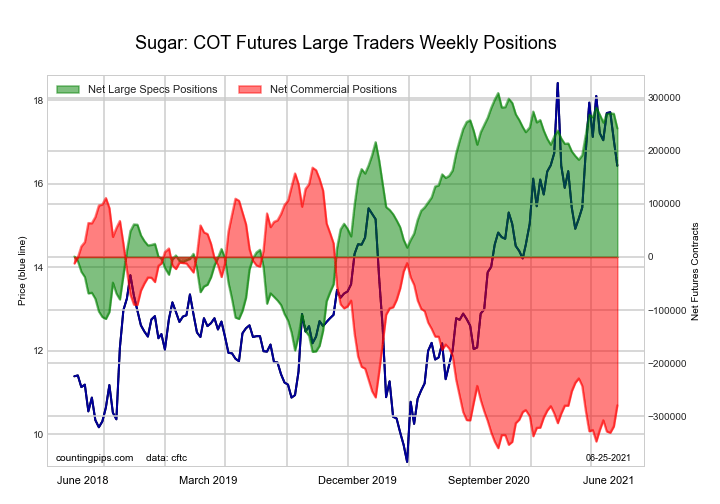
2-Year Treasury Bonds Futures COT ChartThe SUGAR large speculator standing this week totaled a net position of 241,991 contracts in the data reported through Tuesday. This was a weekly decrease of -27,670 contracts from the previous week which had a total of 269,661 net contracts.

This week’s current strength score (the trader positioning range over the past three years, measured from 0 to 100) shows the speculators are currently Bullish-Extreme with a score of 86.3 percent. The commercials are Bearish-Extreme with a score of 15.3 percent and the small traders (not shown in chart) are Bullish with a score of 53.7 percent.

SUGAR Futures StatisticsSPECULATORSCOMMERCIALSSMALL TRADERS
– Percent of Open Interest Longs:30.545.99.0
– Percent of Open Interest Shorts:4.376.15.0
– Net Position:241,991-279,03537,044
– Gross Longs:282,164425,05483,620
– Gross Shorts:40,173704,08946,576
– Long to Short Ratio:7.0 to 10.6 to 11.8 to 1
NET POSITION TREND:
– COT Index Score (3 Year Range Pct):86.315.353.7
– COT Index Reading (3 Year Range):Bullish-ExtremeBearish-ExtremeBullish
NET POSITION MOVEMENT INDEX:
– 6-Week Change in Strength Index:-8.112.9-35.6


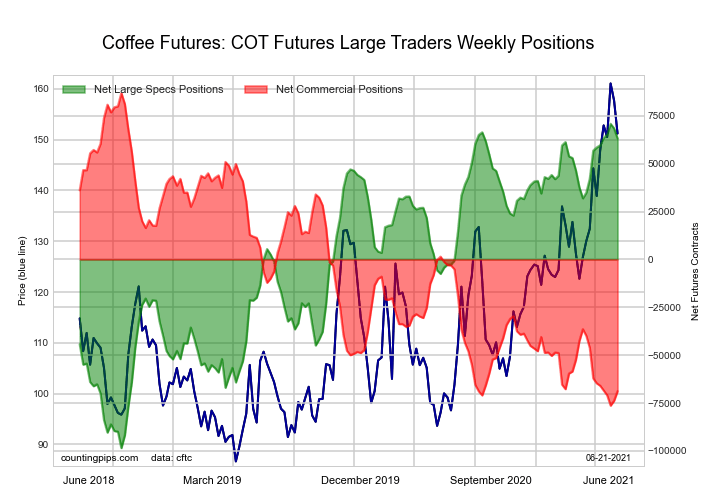
COFFEE Futures:

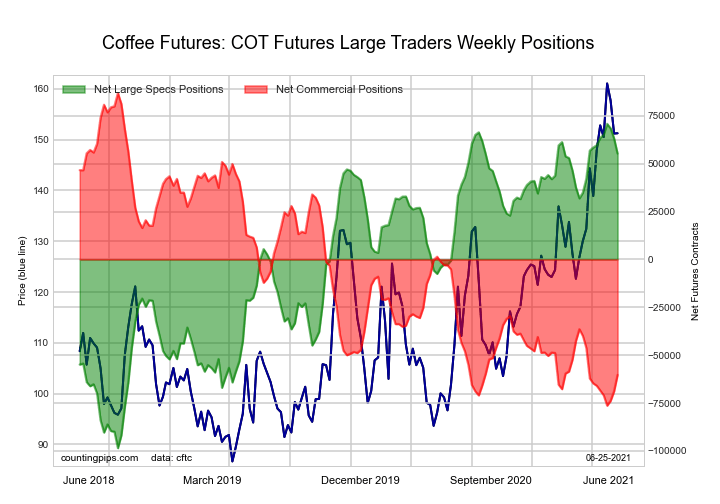
5-Year Treasury Bonds Futures COT ChartThe COFFEE large speculator standing this week totaled a net position of 55,220 contracts in the data reported through Tuesday. This was a weekly fall of -7,932 contracts from the previous week which had a total of 63,152 net contracts.

This week’s current strength score (the trader positioning range over the past three years, measured from 0 to 100) shows the speculators are currently Bullish-Extreme with a score of 90.8 percent. The commercials are Bearish-Extreme with a score of 9.8 percent and the small traders (not shown in chart) are Bearish with a score of 23.4 percent.

COFFEE Futures StatisticsSPECULATORSCOMMERCIALSSMALL TRADERS
– Percent of Open Interest Longs:30.946.94.5
– Percent of Open Interest Shorts:10.269.52.6
– Net Position:55,220-60,2905,070
– Gross Longs:82,447125,02012,103
– Gross Shorts:27,227185,3107,033
– Long to Short Ratio:3.0 to 10.7 to 11.7 to 1
NET POSITION TREND:
– COT Index Score (3 Year Range Pct):90.89.823.4
– COT Index Reading (3 Year Range):Bullish-ExtremeBearish-ExtremeBearish
NET POSITION MOVEMENT INDEX:
– 6-Week Change in Strength Index:-2.63.5-8.9


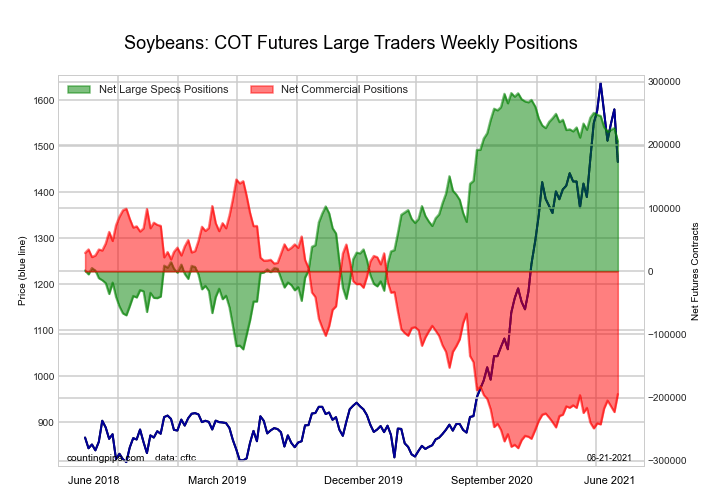
SOYBEANS Futures:

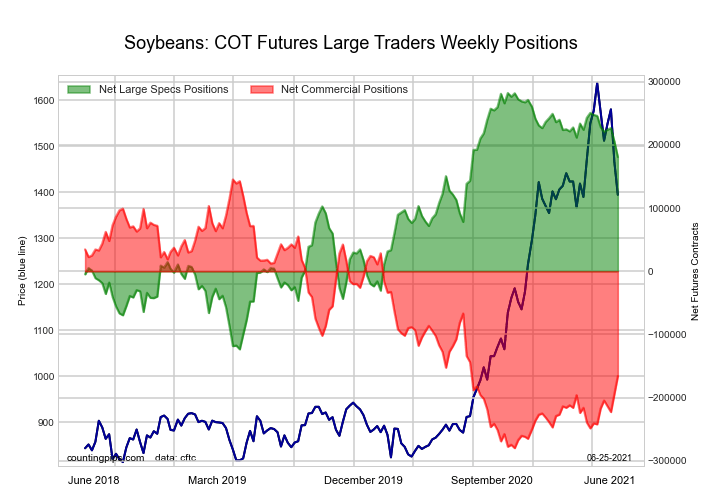
10-Year Treasury Notes Bonds Futures COT ChartThe SOYBEANS large speculator standing this week totaled a net position of 180,948 contracts in the data reported through Tuesday. This was a weekly fall of -24,445 contracts from the previous week which had a total of 205,393 net contracts.

This week’s current strength score (the trader positioning range over the past three years, measured from 0 to 100) shows the speculators are currently Bullish with a score of 75.1 percent. The commercials are Bearish with a score of 26.8 percent and the small traders (not shown in chart) are Bearish with a score of 46.9 percent.

SOYBEANS Futures StatisticsSPECULATORSCOMMERCIALSSMALL TRADERS
– Percent of Open Interest Longs:31.548.46.8
– Percent of Open Interest Shorts:7.770.38.8
– Net Position:180,948-165,947-15,001
– Gross Longs:238,976366,56951,734
– Gross Shorts:58,028532,51666,735
– Long to Short Ratio:4.1 to 10.7 to 10.8 to 1
NET POSITION TREND:
– COT Index Score (3 Year Range Pct):75.126.846.9
– COT Index Reading (3 Year Range):BullishBearishBearish
NET POSITION MOVEMENT INDEX:
– 6-Week Change in Strength Index:-16.017.9-18.6


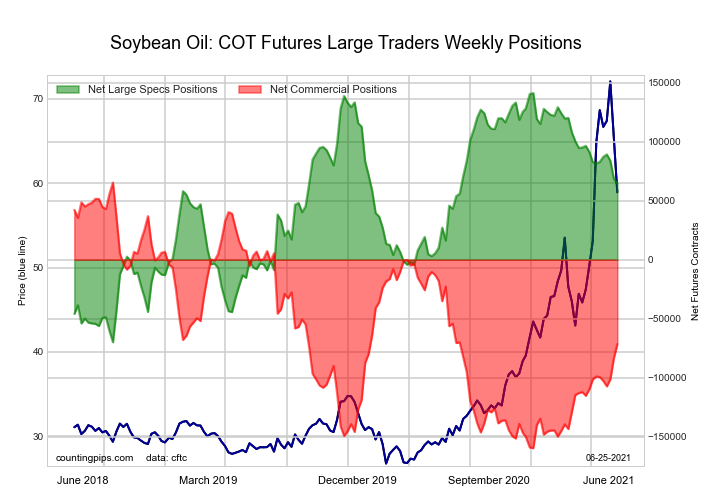
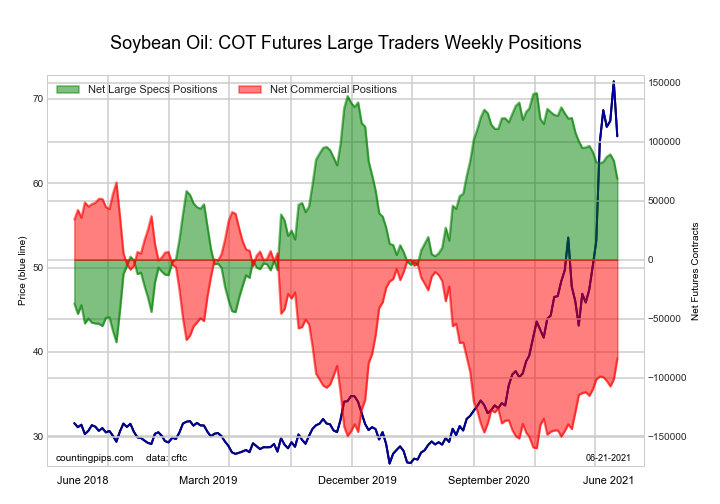
SOYBEAN OIL Futures:

Ultra 10-Year Treasury Notes Bonds Futures COT ChartThe SOYBEAN OIL large speculator standing this week totaled a net position of 64,908 contracts in the data reported through Tuesday. This was a weekly reduction of -3,683 contracts from the previous week which had a total of 68,591 net contracts.

This week’s current strength score (the trader positioning range over the past three years, measured from 0 to 100) shows the speculators are currently Bullish with a score of 63.9 percent. The commercials are Bearish with a score of 39.2 percent and the small traders (not shown in chart) are Bearish with a score of 37.8 percent.

SOYBEAN OIL Futures StatisticsSPECULATORSCOMMERCIALSSMALL TRADERS
– Percent of Open Interest Longs:19.950.87.0
– Percent of Open Interest Shorts:7.164.85.7
– Net Position:64,908-71,4396,531
– Gross Longs:101,398259,44835,732
– Gross Shorts:36,490330,88729,201
– Long to Short Ratio:2.8 to 10.8 to 11.2 to 1
NET POSITION TREND:
– COT Index Score (3 Year Range Pct):63.939.237.8
– COT Index Reading (3 Year Range):BullishBearishBearish
NET POSITION MOVEMENT INDEX:
– 6-Week Change in Strength Index:-8.012.2-39.6


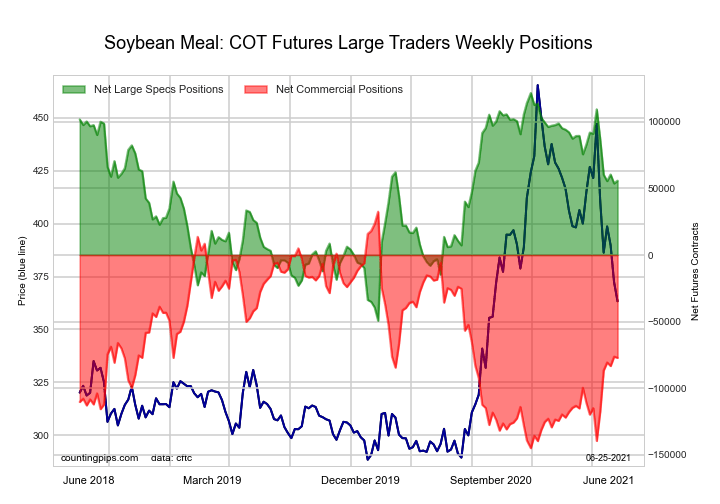
SOYBEAN MEAL Futures:

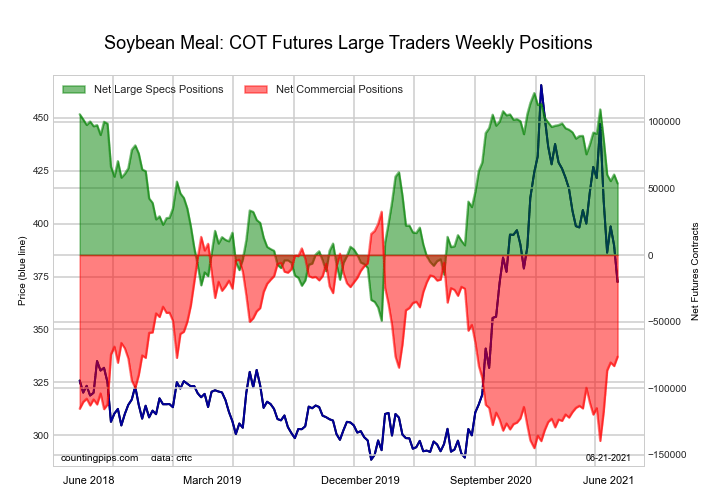
US Year Treasury Notes Long Bonds Futures COT ChartThe SOYBEAN MEAL large speculator standing this week totaled a net position of 55,794 contracts in the data reported through Tuesday. This was a weekly advance of 2,023 contracts from the previous week which had a total of 53,771 net contracts.

This week’s current strength score (the trader positioning range over the past three years, measured from 0 to 100) shows the speculators are currently Bullish with a score of 61.5 percent. The commercials are Bearish with a score of 38.2 percent and the small traders (not shown in chart) are Bullish with a score of 56.5 percent.

SOYBEAN MEAL Futures StatisticsSPECULATORSCOMMERCIALSSMALL TRADERS
– Percent of Open Interest Longs:22.652.512.0
– Percent of Open Interest Shorts:8.671.96.6
– Net Position:55,794-77,20921,415
– Gross Longs:89,916209,52447,835
– Gross Shorts:34,122286,73326,420
– Long to Short Ratio:2.6 to 10.7 to 11.8 to 1
NET POSITION TREND:
– COT Index Score (3 Year Range Pct):61.538.256.5
– COT Index Reading (3 Year Range):BullishBearishBullish
NET POSITION MOVEMENT INDEX:
– 6-Week Change in Strength Index:-31.435.1-35.3


LIVE CATTLE Futures:

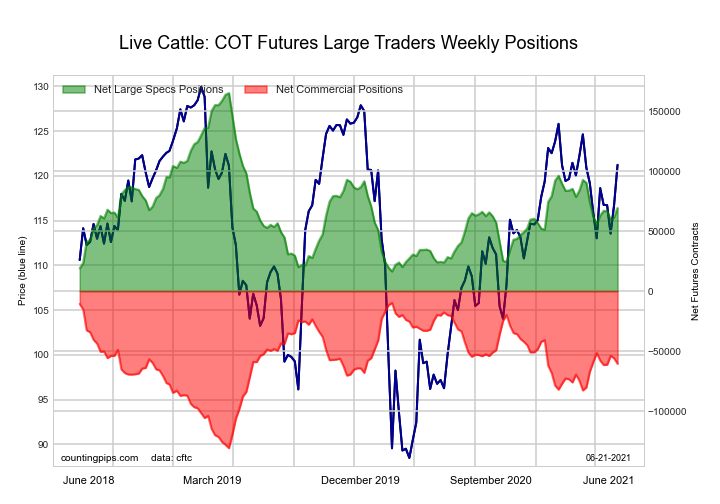
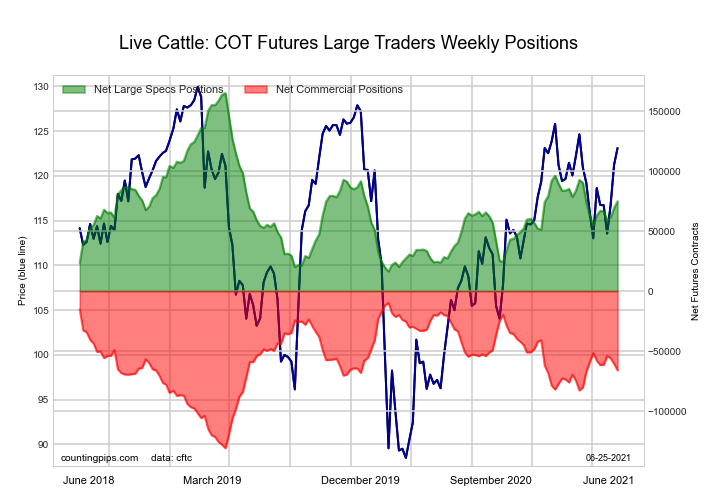
Ultra US Year Treasury Notes Long Bonds Futures COT ChartThe LIVE CATTLE large speculator standing this week totaled a net position of 74,914 contracts in the data reported through Tuesday. This was a weekly gain of 5,593 contracts from the previous week which had a total of 69,321 net contracts.

This week’s current strength score (the trader positioning range over the past three years, measured from 0 to 100) shows the speculators are currently Bearish with a score of 39.3 percent. The commercials are Bullish with a score of 53.6 percent and the small traders (not shown in chart) are Bullish with a score of 65.4 percent.

LIVE CATTLE Futures StatisticsSPECULATORSCOMMERCIALSSMALL TRADERS
– Percent of Open Interest Longs:39.438.09.1
– Percent of Open Interest Shorts:14.460.012.0
– Net Position:74,914-65,988-8,926
– Gross Longs:118,184113,90627,178
– Gross Shorts:43,270179,89436,104
– Long to Short Ratio:2.7 to 10.6 to 10.8 to 1
NET POSITION TREND:
– COT Index Score (3 Year Range Pct):39.353.665.4
– COT Index Reading (3 Year Range):BearishBullishBullish
NET POSITION MOVEMENT INDEX:
– 6-Week Change in Strength Index:7.9-6.7-8.8


LEAN HOGS Futures:

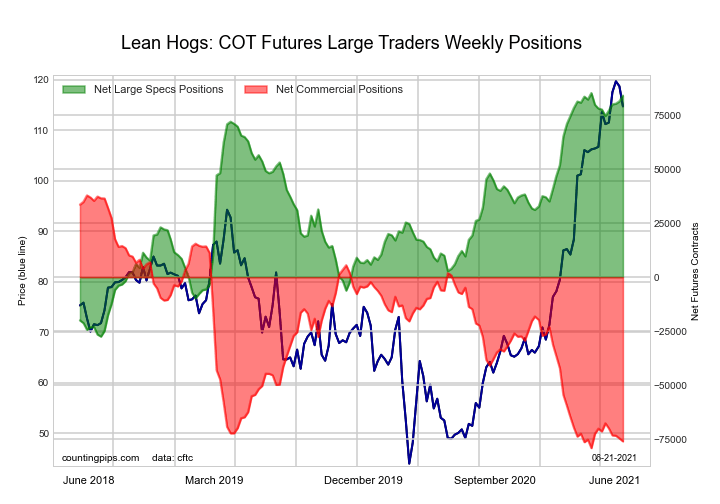
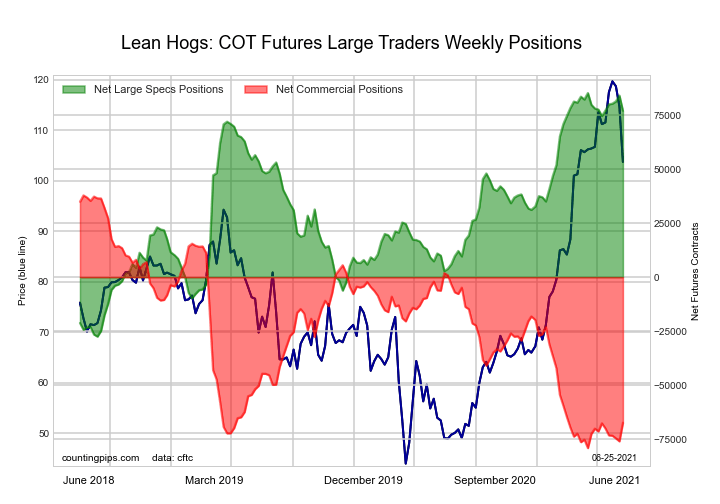
Eurodollar Bonds Futures COT ChartThe LEAN HOGS large speculator standing this week totaled a net position of 76,976 contracts in the data reported through Tuesday. This was a weekly decrease of -7,077 contracts from the previous week which had a total of 84,053 net contracts.

This week’s current strength score (the trader positioning range over the past three years, measured from 0 to 100) shows the speculators are currently Bullish-Extreme with a score of 92.7 percent. The commercials are Bearish-Extreme with a score of 10.0 percent and the small traders (not shown in chart) are Bearish with a score of 32.2 percent.

LEAN HOGS Futures StatisticsSPECULATORSCOMMERCIALSSMALL TRADERS
– Percent of Open Interest Longs:40.630.27.9
– Percent of Open Interest Shorts:13.653.811.2
– Net Position:76,976-67,377-9,599
– Gross Longs:115,93586,34422,515
– Gross Shorts:38,959153,72132,114
– Long to Short Ratio:3.0 to 10.6 to 10.7 to 1
NET POSITION TREND:
– COT Index Score (3 Year Range Pct):92.710.032.2
– COT Index Reading (3 Year Range):Bullish-ExtremeBearish-ExtremeBearish
NET POSITION MOVEMENT INDEX:
– 6-Week Change in Strength Index:2.10.2-12.5


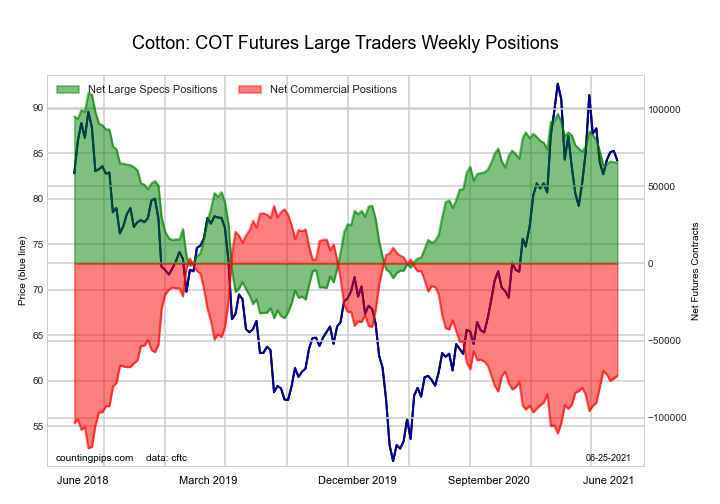
COTTON Futures:

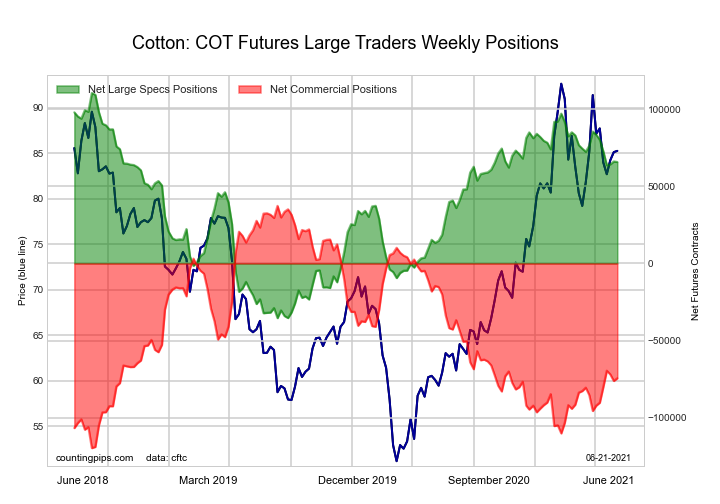
Ultra 10-Year Treasury Notes Bonds Futures COT ChartThe COTTON large speculator standing this week totaled a net position of 65,170 contracts in the data reported through Tuesday. This was a weekly fall of -534 contracts from the previous week which had a total of 65,704 net contracts.

This week’s current strength score (the trader positioning range over the past three years, measured from 0 to 100) shows the speculators are currently Bullish with a score of 69.0 percent. The commercials are Bearish with a score of 29.8 percent and the small traders (not shown in chart) are Bullish with a score of 62.1 percent.

COTTON Futures StatisticsSPECULATORSCOMMERCIALSSMALL TRADERS
– Percent of Open Interest Longs:36.544.87.1
– Percent of Open Interest Shorts:5.279.83.4
– Net Position:65,170-72,8147,644
– Gross Longs:75,91493,02114,702
– Gross Shorts:10,744165,8357,058
– Long to Short Ratio:7.1 to 10.6 to 12.1 to 1
NET POSITION TREND:
– COT Index Score (3 Year Range Pct):69.029.862.1
– COT Index Reading (3 Year Range):BullishBearishBullish
NET POSITION MOVEMENT INDEX:
– 6-Week Change in Strength Index:-10.311.1-15.4


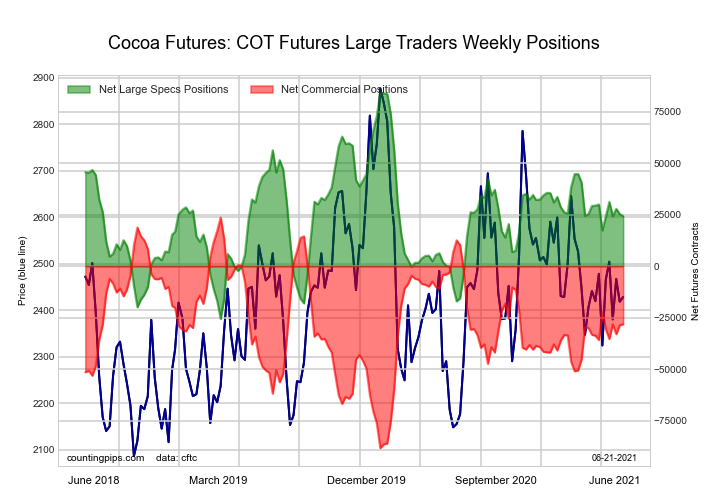
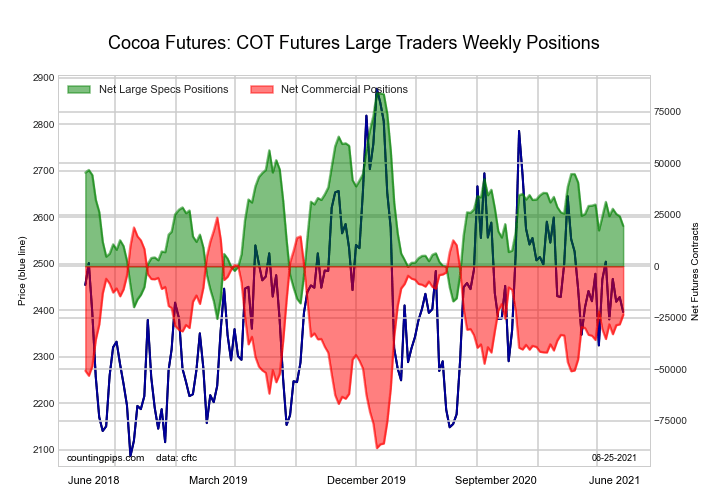
COCOA Futures:

US Year Treasury Notes Long Bonds Futures COT ChartThe COCOA large speculator standing this week totaled a net position of 19,604 contracts in the data reported through Tuesday. This was a weekly decrease of -4,673 contracts from the previous week which had a total of 24,277 net contracts.

This week’s current strength score (the trader positioning range over the past three years, measured from 0 to 100) shows the speculators are currently Bearish with a score of 41.2 percent. The commercials are Bullish with a score of 57.8 percent and the small traders (not shown in chart) are Bullish with a score of 53.7 percent.

COCOA Futures StatisticsSPECULATORSCOMMERCIALSSMALL TRADERS
– Percent of Open Interest Longs:28.346.75.4
– Percent of Open Interest Shorts:19.557.23.7
– Net Position:19,604-23,5813,977
– Gross Longs:63,381104,65612,213
– Gross Shorts:43,777128,2378,236
– Long to Short Ratio:1.4 to 10.8 to 11.5 to 1
NET POSITION TREND:
– COT Index Score (3 Year Range Pct):41.257.853.7
– COT Index Reading (3 Year Range):BearishBullishBullish
NET POSITION MOVEMENT INDEX:
– 6-Week Change in Strength Index:-4.26.3-28.2


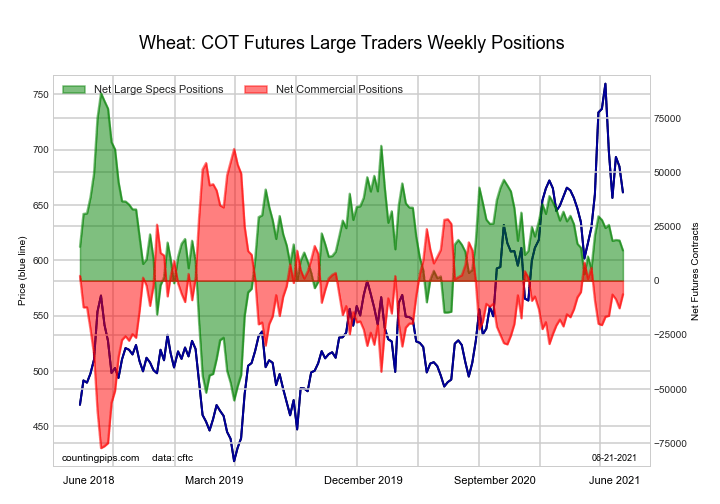
WHEAT Futures:

Ultra US Year Treasury Notes Long Bonds Futures COT ChartThe WHEAT large speculator standing this week totaled a net position of 25,806 contracts in the data reported through Tuesday. This was a weekly gain of 11,858 contracts from the previous week which had a total of 13,948 net contracts.

This week’s current strength score (the trader positioning range over the past three years, measured from 0 to 100) shows the speculators are currently Bullish with a score of 57.1 percent. The commercials are Bearish with a score of 45.0 percent and the small traders (not shown in chart) are Bullish with a score of 50.5 percent.

WHEAT Futures StatisticsSPECULATORSCOMMERCIALSSMALL TRADERS
– Percent of Open Interest Longs:29.037.27.2
– Percent of Open Interest Shorts:22.341.110.0
– Net Position:25,806-15,106-10,700
– Gross Longs:112,624144,49928,005
– Gross Shorts:86,818159,60538,705
– Long to Short Ratio:1.3 to 10.9 to 10.7 to 1
NET POSITION TREND:
– COT Index Score (3 Year Range Pct):57.145.050.5
– COT Index Reading (3 Year Range):BullishBearishBullish
NET POSITION MOVEMENT INDEX:
– 6-Week Change in Strength Index:1.01.1-14.4


Article By CountingPips.comReceive our weekly COT Reports by Email

*COT Report: The COT data, released weekly to the public each Friday, is updated through the most recent Tuesday (data is 3 days old) and shows a quick view of how large speculators or non-commercials (for-profit traders) were positioned in the futures markets.

The CFTC categorizes trader positions according to commercial hedgers (traders who use futures contracts for hedging as part of the business), non-commercials (large traders who speculate to realize trading profits) and nonreportable traders (usually small traders/speculators).

Find CFTC criteria here: (http://www.cftc.gov/MarketReports/CommitmentsofTraders/ExplanatoryNotes/index.htm).

COT Currency Futures Charts: US Dollar, Euro, Yen, Pound, Swiss Franc, Peso, Bitcoin

By CountingPips.com COT Home | Data Tables | Data Downloads | Newsletter

Here are the latest charts and statistics for the Commitment of Traders (COT) data published by the Commodities Futures Trading Commission (CFTC).

The latest COT data is updated through Tuesday June 15 2021 and shows a quick view of how large traders (for-profit speculators and commercial entities) were positioned in the futures markets. All currency positions are in direct relation to the US dollar where, for example, a bet for the euro is a bet that the euro will rise versus the dollar while a bet against the euro will be a bet that the euro will decline versus the dollar.


US Dollar Index Futures:
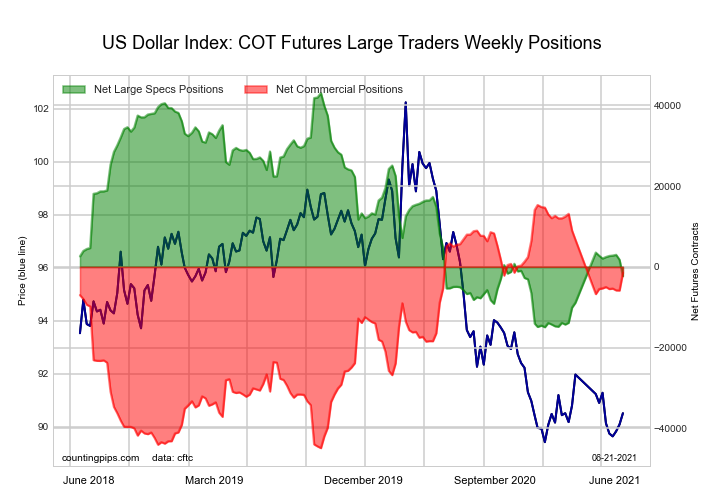
Federal Funds 30-Day Bonds Futures COT ChartThe US Dollar Index large speculator standing this week recorded a net position of -2,303 contracts in the data reported through Tuesday. This was a weekly fall of -4,054 contracts from the previous week which had a total of 1,751 net contracts.

This week’s current strength score (the trader positioning range over the past three years, measured from 0 to 100) shows the speculators are currently Bearish with a score of 21.8 percent. The commercials are Bullish with a score of 72.1 percent and the small traders (not shown in chart) are Bullish with a score of 68.5 percent.

US DOLLAR INDEX StatisticsSPECULATORSCOMMERCIALSSMALL TRADERS
– Percent of Open Interest Longs:68.48.317.6
– Percent of Open Interest Shorts:74.512.37.4
– Net Position:-2,303-1,4953,798
– Gross Longs:25,6183,1206,577
– Gross Shorts:27,9214,6152,779
– Long to Short Ratio:0.9 to 10.7 to 12.4 to 1
NET POSITION TREND:
– COT Index Score (3 Year Range Pct):21.872.168.5
– COT Index Reading (3 Year Range):BearishBullishBullish
NET POSITION MOVEMENT INDEX:
– 6-Week Change in Strength Index:-7.56.46.6


Euro Currency Futures:

2-Year Treasury Bonds Futures COT ChartThe Euro Currency large speculator standing this week recorded a net position of 118,186 contracts in the data reported through Tuesday. This was a weekly gain of 10,973 contracts from the previous week which had a total of 107,213 net contracts.

This week’s current strength score (the trader positioning range over the past three years, measured from 0 to 100) shows the speculators are currently Bullish with a score of 71.3 percent. The commercials are Bearish with a score of 24.3 percent and the small traders (not shown in chart) are Bullish-Extreme with a score of 83.0 percent.

EURO Currency StatisticsSPECULATORSCOMMERCIALSSMALL TRADERS
– Percent of Open Interest Longs:30.354.914.4
– Percent of Open Interest Shorts:13.381.15.2
– Net Position:118,186-182,09163,905
– Gross Longs:210,816381,40999,890
– Gross Shorts:92,630563,50035,985
– Long to Short Ratio:2.3 to 10.7 to 12.8 to 1
NET POSITION TREND:
– COT Index Score (3 Year Range Pct):71.324.383.0
– COT Index Reading (3 Year Range):BullishBearishBullish-Extreme
NET POSITION MOVEMENT INDEX:
– 6-Week Change in Strength Index:10.2-11.39.3


British Pound Sterling Futures:

5-Year Treasury Bonds Futures COT ChartThe British Pound Sterling large speculator standing this week recorded a net position of 32,170 contracts in the data reported through Tuesday. This was a weekly lift of 4,456 contracts from the previous week which had a total of 27,714 net contracts.

This week’s current strength score (the trader positioning range over the past three years, measured from 0 to 100) shows the speculators are currently Bullish-Extreme with a score of 97.2 percent. The commercials are Bearish-Extreme with a score of 0.2 percent and the small traders (not shown in chart) are Bullish-Extreme with a score of 92.4 percent.

BRITISH POUND StatisticsSPECULATORSCOMMERCIALSSMALL TRADERS
– Percent of Open Interest Longs:35.439.224.4
– Percent of Open Interest Shorts:14.871.113.0
– Net Position:32,170-49,88317,713
– Gross Longs:55,20361,12338,047
– Gross Shorts:23,033111,00620,334
– Long to Short Ratio:2.4 to 10.6 to 11.9 to 1
NET POSITION TREND:
– COT Index Score (3 Year Range Pct):97.20.292.4
– COT Index Reading (3 Year Range):Bullish-ExtremeBearish-ExtremeBullish-Extreme
NET POSITION MOVEMENT INDEX:
– 6-Week Change in Strength Index:8.9-7.0-0.9


Japanese Yen Futures:

10-Year Treasury Notes Bonds Futures COT ChartThe Japanese Yen large speculator standing this week recorded a net position of -46,850 contracts in the data reported through Tuesday. This was a weekly reduction of -9,536 contracts from the previous week which had a total of -37,314 net contracts.

This week’s current strength score (the trader positioning range over the past three years, measured from 0 to 100) shows the speculators are currently Bearish with a score of 41.2 percent. The commercials are Bullish with a score of 65.5 percent and the small traders (not shown in chart) are Bearish with a score of 20.9 percent.

JAPANESE YEN StatisticsSPECULATORSCOMMERCIALSSMALL TRADERS
– Percent of Open Interest Longs:14.872.612.2
– Percent of Open Interest Shorts:44.930.624.0
– Net Position:-46,85065,317-18,467
– Gross Longs:22,974112,79818,879
– Gross Shorts:69,82447,48137,346
– Long to Short Ratio:0.3 to 12.4 to 10.5 to 1
NET POSITION TREND:
– COT Index Score (3 Year Range Pct):41.265.520.9
– COT Index Reading (3 Year Range):BearishBullishBearish
NET POSITION MOVEMENT INDEX:
– 6-Week Change in Strength Index:-3.25.2-10.8


Swiss Franc Futures:

Ultra 10-Year Treasury Notes Bonds Futures COT ChartThe Swiss Franc large speculator standing this week recorded a net position of 9,387 contracts in the data reported through Tuesday. This was a weekly rise of 8,311 contracts from the previous week which had a total of 1,076 net contracts.

This week’s current strength score (the trader positioning range over the past three years, measured from 0 to 100) shows the speculators are currently Bullish-Extreme with a score of 87.9 percent. The commercials are Bearish with a score of 20.0 percent and the small traders (not shown in chart) are Bullish with a score of 61.9 percent.

SWISS FRANC StatisticsSPECULATORSCOMMERCIALSSMALL TRADERS
– Percent of Open Interest Longs:40.119.540.3
– Percent of Open Interest Shorts:14.842.243.0
– Net Position:9,387-8,396-991
– Gross Longs:14,8757,23114,949
– Gross Shorts:5,48815,62715,940
– Long to Short Ratio:2.7 to 10.5 to 10.9 to 1
NET POSITION TREND:
– COT Index Score (3 Year Range Pct):87.920.061.9
– COT Index Reading (3 Year Range):Bullish-ExtremeBearishBullish
NET POSITION MOVEMENT INDEX:
– 6-Week Change in Strength Index:14.5-17.119.1


Canadian Dollar Futures:

US Year Treasury Notes Long Bonds Futures COT ChartThe Canadian Dollar large speculator standing this week recorded a net position of 44,254 contracts in the data reported through Tuesday. This was a weekly reduction of -1,027 contracts from the previous week which had a total of 45,281 net contracts.

This week’s current strength score (the trader positioning range over the past three years, measured from 0 to 100) shows the speculators are currently Bullish-Extreme with a score of 91.9 percent. The commercials are Bearish-Extreme with a score of 6.0 percent and the small traders (not shown in chart) are Bullish-Extreme with a score of 90.0 percent.

CANADIAN DOLLAR StatisticsSPECULATORSCOMMERCIALSSMALL TRADERS
– Percent of Open Interest Longs:28.951.119.0
– Percent of Open Interest Shorts:11.479.97.6
– Net Position:44,254-72,92128,667
– Gross Longs:73,071129,18548,013
– Gross Shorts:28,817202,10619,346
– Long to Short Ratio:2.5 to 10.6 to 12.5 to 1
NET POSITION TREND:
– COT Index Score (3 Year Range Pct):91.96.090.0
– COT Index Reading (3 Year Range):Bullish-ExtremeBearish-ExtremeBullish-Extreme
NET POSITION MOVEMENT INDEX:
– 6-Week Change in Strength Index:15.3-7.6-9.2


Australian Dollar Futures:

Ultra US Year Treasury Notes Long Bonds Futures COT ChartThe Australian Dollar large speculator standing this week recorded a net position of -17,880 contracts in the data reported through Tuesday. This was a weekly decrease of -8,443 contracts from the previous week which had a total of -9,437 net contracts.

This week’s current strength score (the trader positioning range over the past three years, measured from 0 to 100) shows the speculators are currently Bullish with a score of 61.8 percent. The commercials are Bearish with a score of 29.9 percent and the small traders (not shown in chart) are Bullish with a score of 73.7 percent.

AUSTRALIAN DOLLAR StatisticsSPECULATORSCOMMERCIALSSMALL TRADERS
– Percent of Open Interest Longs:32.345.821.2
– Percent of Open Interest Shorts:46.737.515.1
– Net Position:-17,88010,3567,524
– Gross Longs:40,13956,90226,262
– Gross Shorts:58,01946,54618,738
– Long to Short Ratio:0.7 to 11.2 to 11.4 to 1
NET POSITION TREND:
– COT Index Score (3 Year Range Pct):61.829.973.7
– COT Index Reading (3 Year Range):BullishBearishBullish
NET POSITION MOVEMENT INDEX:
– 6-Week Change in Strength Index:-21.621.4-13.6


New Zealand Dollar Futures:

Eurodollar Bonds Futures COT ChartThe New Zealand Dollar large speculator standing this week recorded a net position of 3,265 contracts in the data reported through Tuesday. This was a weekly fall of -2,241 contracts from the previous week which had a total of 5,506 net contracts.

This week’s current strength score (the trader positioning range over the past three years, measured from 0 to 100) shows the speculators are currently Bullish with a score of 76.7 percent. The commercials are Bearish with a score of 21.7 percent and the small traders (not shown in chart) are Bullish with a score of 79.9 percent.

NEW ZEALAND DOLLAR StatisticsSPECULATORSCOMMERCIALSSMALL TRADERS
– Percent of Open Interest Longs:48.734.215.3
– Percent of Open Interest Shorts:40.149.19.0
– Net Position:3,265-5,6572,392
– Gross Longs:18,46612,9625,787
– Gross Shorts:15,20118,6193,395
– Long to Short Ratio:1.2 to 10.7 to 11.7 to 1
NET POSITION TREND:
– COT Index Score (3 Year Range Pct):76.721.779.9
– COT Index Reading (3 Year Range):BullishBearishBullish
NET POSITION MOVEMENT INDEX:
– 6-Week Change in Strength Index:-8.97.64.6


Mexican Peso Futures:

Ultra 10-Year Treasury Notes Bonds Futures COT ChartThe Mexican Peso large speculator standing this week recorded a net position of -23,930 contracts in the data reported through Tuesday. This was a weekly decrease of -17,369 contracts from the previous week which had a total of -6,561 net contracts.

This week’s current strength score (the trader positioning range over the past three years, measured from 0 to 100) shows the speculators are currently Bearish-Extreme with a score of 2.8 percent. The commercials are Bullish-Extreme with a score of 96.2 percent and the small traders (not shown in chart) are Bullish with a score of 58.0 percent.

MEXICAN PESO StatisticsSPECULATORSCOMMERCIALSSMALL TRADERS
– Percent of Open Interest Longs:47.447.24.6
– Percent of Open Interest Shorts:64.033.12.2
– Net Position:-23,93020,3973,533
– Gross Longs:68,67568,3076,669
– Gross Shorts:92,60547,9103,136
– Long to Short Ratio:0.7 to 11.4 to 12.1 to 1
NET POSITION TREND:
– COT Index Score (3 Year Range Pct):2.896.258.0
– COT Index Reading (3 Year Range):Bearish-ExtremeBullish-ExtremeBullish
NET POSITION MOVEMENT INDEX:
– 6-Week Change in Strength Index:-9.810.1-3.7


Brazilian Real Futures:

US Year Treasury Notes Long Bonds Futures COT ChartThe Brazilian Real large speculator standing this week recorded a net position of 18,659 contracts in the data reported through Tuesday. This was a weekly reduction of -1,389 contracts from the previous week which had a total of 20,048 net contracts.

This week’s current strength score (the trader positioning range over the past three years, measured from 0 to 100) shows the speculators are currently Bullish-Extreme with a score of 98.1 percent. The commercials are Bearish-Extreme with a score of 1.6 percent and the small traders (not shown in chart) are Bullish-Extreme with a score of 98.9 percent.

BRAZIL REAL StatisticsSPECULATORSCOMMERCIALSSMALL TRADERS
– Percent of Open Interest Longs:68.620.410.5
– Percent of Open Interest Shorts:22.272.25.1
– Net Position:18,659-20,8092,150
– Gross Longs:27,5648,2094,209
– Gross Shorts:8,90529,0182,059
– Long to Short Ratio:3.1 to 10.3 to 12.0 to 1
NET POSITION TREND:
– COT Index Score (3 Year Range Pct):98.11.698.9
– COT Index Reading (3 Year Range):Bullish-ExtremeBearish-ExtremeBullish-Extreme
NET POSITION MOVEMENT INDEX:
– 6-Week Change in Strength Index:40.0-41.012.0


Russian Ruble Futures:

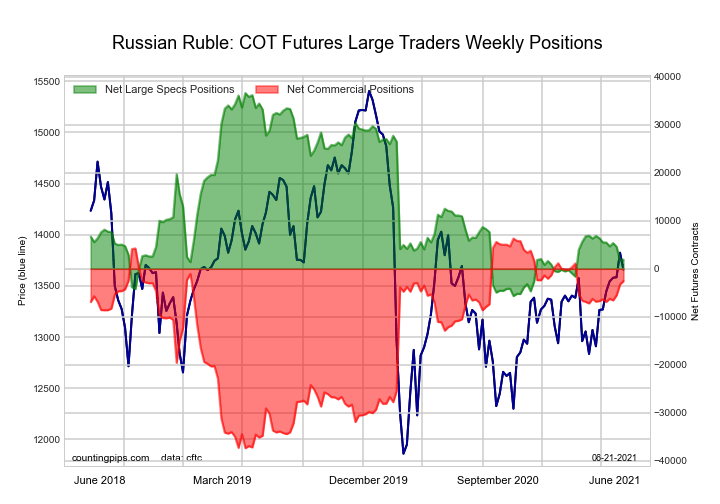
Ultra US Year Treasury Notes Long Bonds Futures COT ChartThe Russian Ruble large speculator standing this week recorded a net position of 1,904 contracts in the data reported through Tuesday. This was a weekly advance of 164 contracts from the previous week which had a total of 1,740 net contracts.

This week’s current strength score (the trader positioning range over the past three years, measured from 0 to 100) shows the speculators are currently Bearish-Extreme with a score of 17.9 percent. The commercials are Bullish with a score of 79.7 percent and the small traders (not shown in chart) are Bullish with a score of 63.9 percent.

RUSSIAN RUBLE StatisticsSPECULATORSCOMMERCIALSSMALL TRADERS
– Percent of Open Interest Longs:26.767.45.5
– Percent of Open Interest Shorts:22.872.64.2
– Net Position:1,904-2,540636
– Gross Longs:13,08933,0592,691
– Gross Shorts:11,18535,5992,055
– Long to Short Ratio:1.2 to 10.9 to 11.3 to 1
NET POSITION TREND:
– COT Index Score (3 Year Range Pct):17.979.763.9
– COT Index Reading (3 Year Range):Bearish-ExtremeBullishBullish
NET POSITION MOVEMENT INDEX:
– 6-Week Change in Strength Index:-8.58.7-6.3


Bitcoin Futures:

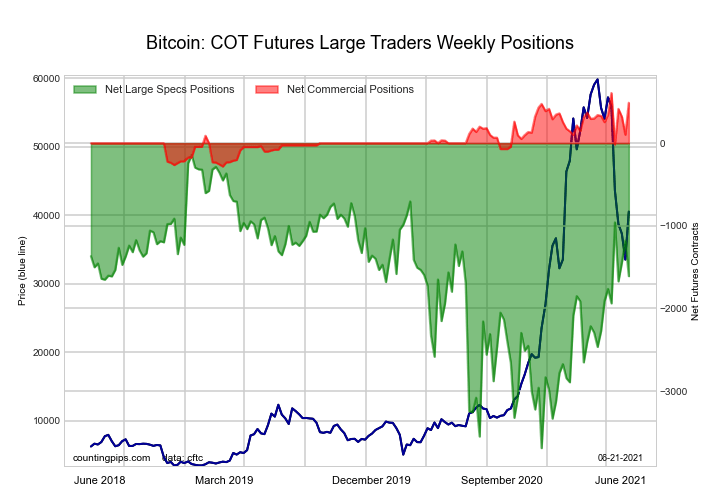
Eurodollar Bonds Futures COT ChartThe Bitcoin large speculator standing this week recorded a net position of -1,609 contracts in the data reported through Tuesday. This was a weekly reduction of -428 contracts from the previous week which had a total of -1,181 net contracts.

This week’s current strength score (the trader positioning range over the past three years, measured from 0 to 100) shows the speculators are currently Bullish with a score of 58.7 percent. The commercials are Bullish-Extreme with a score of 86.7 percent and the small traders (not shown in chart) are Bearish with a score of 26.5 percent.

BITCOIN StatisticsSPECULATORSCOMMERCIALSSMALL TRADERS
– Percent of Open Interest Longs:57.48.424.6
– Percent of Open Interest Shorts:78.81.99.7
– Net Position:-1,6094891,120
– Gross Longs:4,3206311,851
– Gross Shorts:5,929142731
– Long to Short Ratio:0.7 to 14.4 to 12.5 to 1
NET POSITION TREND:
– COT Index Score (3 Year Range Pct):58.786.726.5
– COT Index Reading (3 Year Range):BullishBullish-ExtremeBearish
NET POSITION MOVEMENT INDEX:
– 6-Week Change in Strength Index:4.416.1-9.8


Article By CountingPips.comReceive our weekly COT Reports by Email

*COT Report: The COT data, released weekly to the public each Friday, is updated through the most recent Tuesday (data is 3 days old) and shows a quick view of how large speculators or non-commercials (for-profit traders) were positioned in the futures markets.

The CFTC categorizes trader positions according to commercial hedgers (traders who use futures contracts for hedging as part of the business), non-commercials (large traders who speculate to realize trading profits) and nonreportable traders (usually small traders/speculators).

Find CFTC criteria here: (http://www.cftc.gov/MarketReports/CommitmentsofTraders/ExplanatoryNotes/index.htm).
COT Stock Market Futures Charts: VIX, Dow, Nasdaq, SP500, Russell-2000, Emerging Markets

By CountingPips.com COT Home | Data Tables | Data Downloads | Newsletter

Here are the latest charts and statistics for the Commitment of Traders (COT) data published by the Commodities Futures Trading Commission (CFTC).

The latest COT data is updated through Tuesday June 15 2021 and shows a quick view of how large traders (for-profit speculators and commercial entities) were positioned in the futures markets.


VIX Volatility Futures Futures:

Federal Funds 30-Day Bonds Futures COT ChartThe VIX Volatility Futures large speculator standing this week equaled a net position of -68,747 contracts in the data reported through Tuesday. This was a weekly decline of -6,598 contracts from the previous week which had a total of -62,149 net contracts.

This week’s current strength score (the trader positioning range over the past three years, measured from 0 to 100) shows the speculators are currently Bullish with a score of 57.0 percent. The commercials are Bearish with a score of 43.2 percent and the small traders (not shown in chart) are Bearish with a score of 41.7 percent.

VIX Volatility Futures StatisticsSPECULATORSCOMMERCIALSSMALL TRADERS
– Percent of Open Interest Longs:22.251.06.0
– Percent of Open Interest Shorts:41.530.67.1
– Net Position:-68,74772,626-3,879
– Gross Longs:79,298181,87821,568
– Gross Shorts:148,045109,25225,447
– Long to Short Ratio:0.5 to 11.7 to 10.8 to 1
NET POSITION TREND:
– COT Index Score (3 Year Range Pct):57.043.241.7
– COT Index Reading (3 Year Range):BullishBearishBearish
NET POSITION MOVEMENT INDEX:
– 6-Week Change in Strength Index:10.6-12.725.8


S&P500 Mini Futures Futures:

2-Year Treasury Bonds Futures COT ChartThe S&P500 Mini Futures large speculator standing this week equaled a net position of -16,663 contracts in the data reported through Tuesday. This was a weekly fall of -1,983 contracts from the previous week which had a total of -14,680 net contracts.

This week’s current strength score (the trader positioning range over the past three years, measured from 0 to 100) shows the speculators are currently Bullish with a score of 50.6 percent. The commercials are Bearish with a score of 40.5 percent and the small traders (not shown in chart) are Bullish with a score of 59.6 percent.

S&P500 Mini Futures StatisticsSPECULATORSCOMMERCIALSSMALL TRADERS
– Percent of Open Interest Longs:12.769.413.3
– Percent of Open Interest Shorts:13.274.08.2
– Net Position:-16,663-141,945158,608
– Gross Longs:395,5612,164,980414,259
– Gross Shorts:412,2242,306,925255,651
– Long to Short Ratio:1.0 to 10.9 to 11.6 to 1
NET POSITION TREND:
– COT Index Score (3 Year Range Pct):50.640.559.6
– COT Index Reading (3 Year Range):BullishBearishBullish
NET POSITION MOVEMENT INDEX:
– 6-Week Change in Strength Index:3.0-22.422.7


Dow Jones Mini Futures Futures:

5-Year Treasury Bonds Futures COT ChartThe Dow Jones Mini Futures large speculator standing this week equaled a net position of -10,089 contracts in the data reported through Tuesday. This was a weekly fall of -1,269 contracts from the previous week which had a total of -8,820 net contracts.

This week’s current strength score (the trader positioning range over the past three years, measured from 0 to 100) shows the speculators are currently Bearish with a score of 22.3 percent. The commercials are Bullish with a score of 63.4 percent and the small traders (not shown in chart) are Bullish-Extreme with a score of 100.0 percent.

Dow Jones Mini Futures StatisticsSPECULATORSCOMMERCIALSSMALL TRADERS
– Percent of Open Interest Longs:25.747.320.2
– Percent of Open Interest Shorts:34.148.510.5
– Net Position:-10,089-1,41811,507
– Gross Longs:30,65556,50524,067
– Gross Shorts:40,74457,92312,560
– Long to Short Ratio:0.8 to 11.0 to 11.9 to 1
NET POSITION TREND:
– COT Index Score (3 Year Range Pct):22.363.4100.0
– COT Index Reading (3 Year Range):BearishBullishBullish-Extreme
NET POSITION MOVEMENT INDEX:
– 6-Week Change in Strength Index:-5.7-0.528.1


Nasdaq Mini Futures Futures:

10-Year Treasury Notes Bonds Futures COT ChartThe Nasdaq Mini Futures large speculator standing this week equaled a net position of -11,034 contracts in the data reported through Tuesday. This was a weekly reduction of -2,534 contracts from the previous week which had a total of -8,500 net contracts.

This week’s current strength score (the trader positioning range over the past three years, measured from 0 to 100) shows the speculators are currently Bullish with a score of 68.9 percent. The commercials are Bearish with a score of 40.5 percent and the small traders (not shown in chart) are Bearish-Extreme with a score of 17.7 percent.

Nasdaq Mini Futures StatisticsSPECULATORSCOMMERCIALSSMALL TRADERS
– Percent of Open Interest Longs:22.858.613.5
– Percent of Open Interest Shorts:26.650.717.6
– Net Position:-11,03422,768-11,734
– Gross Longs:65,892169,18938,994
– Gross Shorts:76,926146,42150,728
– Long to Short Ratio:0.9 to 11.2 to 10.8 to 1
NET POSITION TREND:
– COT Index Score (3 Year Range Pct):68.940.517.7
– COT Index Reading (3 Year Range):BullishBearishBearish-Extreme
NET POSITION MOVEMENT INDEX:
– 6-Week Change in Strength Index:3.2-1.0-9.3


Russell 2000 Mini Futures Futures:

Ultra 10-Year Treasury Notes Bonds Futures COT ChartThe Russell 2000 Mini Futures large speculator standing this week equaled a net position of -49,967 contracts in the data reported through Tuesday. This was a weekly decline of -6,558 contracts from the previous week which had a total of -43,409 net contracts.

This week’s current strength score (the trader positioning range over the past three years, measured from 0 to 100) shows the speculators are currently Bearish with a score of 25.7 percent. The commercials are Bullish with a score of 73.3 percent and the small traders (not shown in chart) are Bearish with a score of 49.3 percent.

Russell 2000 Mini Futures StatisticsSPECULATORSCOMMERCIALSSMALL TRADERS
– Percent of Open Interest Longs:11.282.05.8
– Percent of Open Interest Shorts:21.273.14.7
– Net Position:-49,96744,2095,758
– Gross Longs:55,412406,76028,825
– Gross Shorts:105,379362,55123,067
– Long to Short Ratio:0.5 to 11.1 to 11.2 to 1
NET POSITION TREND:
– COT Index Score (3 Year Range Pct):25.773.349.3
– COT Index Reading (3 Year Range):BearishBullishBearish
NET POSITION MOVEMENT INDEX:
– 6-Week Change in Strength Index:-17.817.8-3.0


Nikkei Stock Average (USD) Futures Futures:

US Year Treasury Notes Long Bonds Futures COT ChartThe Nikkei Stock Average (USD) Futures large speculator standing this week equaled a net position of -4,848 contracts in the data reported through Tuesday. This was a weekly decline of -291 contracts from the previous week which had a total of -4,557 net contracts.

This week’s current strength score (the trader positioning range over the past three years, measured from 0 to 100) shows the speculators are currently Bearish with a score of 37.5 percent. The commercials are Bullish with a score of 75.0 percent and the small traders (not shown in chart) are Bearish-Extreme with a score of 0.0 percent.

Nikkei Stock Average Futures StatisticsSPECULATORSCOMMERCIALSSMALL TRADERS
– Percent of Open Interest Longs:16.259.624.1
– Percent of Open Interest Shorts:47.118.534.4
– Net Position:-4,8486,464-1,616
– Gross Longs:2,5549,3783,787
– Gross Shorts:7,4022,9145,403
– Long to Short Ratio:0.3 to 13.2 to 10.7 to 1
NET POSITION TREND:
– COT Index Score (3 Year Range Pct):37.575.00.0
– COT Index Reading (3 Year Range):BearishBullishBearish-Extreme
NET POSITION MOVEMENT INDEX:
– 6-Week Change in Strength Index:-4.712.1-26.2


MSCI EAFE Mini Futures Futures:

Ultra US Year Treasury Notes Long Bonds Futures COT ChartThe MSCI EAFE Mini Futures large speculator standing this week equaled a net position of 14,930 contracts in the data reported through Tuesday. This was a weekly lowering of -11,875 contracts from the previous week which had a total of 26,805 net contracts.

This week’s current strength score (the trader positioning range over the past three years, measured from 0 to 100) shows the speculators are currently Bearish with a score of 30.2 percent. The commercials are Bullish with a score of 59.1 percent and the small traders (not shown in chart) are Bullish-Extreme with a score of 90.0 percent.

MSCI EAFE Mini Futures StatisticsSPECULATORSCOMMERCIALSSMALL TRADERS
– Percent of Open Interest Longs:7.688.92.5
– Percent of Open Interest Shorts:4.494.00.7
– Net Position:14,930-23,0848,154
– Gross Longs:35,002408,21411,453
– Gross Shorts:20,072431,2983,299
– Long to Short Ratio:1.7 to 10.9 to 13.5 to 1
NET POSITION TREND:
– COT Index Score (3 Year Range Pct):30.259.190.0
– COT Index Reading (3 Year Range):BearishBullishBullish-Extreme
NET POSITION MOVEMENT INDEX:
– 6-Week Change in Strength Index:-14.69.329.1


MSCI Emerging Mkts Mini Futures Futures:

Eurodollar Bonds Futures COT ChartThe MSCI Emerging Mkts Mini Futures large speculator standing this week equaled a net position of 38,211 contracts in the data reported through Tuesday. This was a weekly lowering of -2,219 contracts from the previous week which had a total of 40,430 net contracts.

This week’s current strength score (the trader positioning range over the past three years, measured from 0 to 100) shows the speculators are currently Bearish-Extreme with a score of 0.0 percent. The commercials are Bullish-Extreme with a score of 97.2 percent and the small traders (not shown in chart) are Bearish with a score of 40.4 percent.

MSCI Emerging Mkts Mini Futures StatisticsSPECULATORSCOMMERCIALSSMALL TRADERS
– Percent of Open Interest Longs:14.382.22.4
– Percent of Open Interest Shorts:11.086.51.3
– Net Position:38,211-49,88611,675
– Gross Longs:165,150950,68527,250
– Gross Shorts:126,9391,000,57115,575
– Long to Short Ratio:1.3 to 11.0 to 11.7 to 1
NET POSITION TREND:
– COT Index Score (3 Year Range Pct):0.097.240.4
– COT Index Reading (3 Year Range):Bearish-ExtremeBullish-ExtremeBearish
NET POSITION MOVEMENT INDEX:
– 6-Week Change in Strength Index:-11.06.87.3


Article By CountingPips.comReceive our weekly COT Reports by Email

*COT Report: The COT data, released weekly to the public each Friday, is updated through the most recent Tuesday (data is 3 days old) and shows a quick view of how large speculators or non-commercials (for-profit traders) were positioned in the futures markets.

The CFTC categorizes trader positions according to commercial hedgers (traders who use futures contracts for hedging as part of the business), non-commercials (large traders who speculate to realize trading profits) and nonreportable traders (usually small traders/speculators).

Find CFTC criteria here: (http://www.cftc.gov/MarketReports/CommitmentsofTraders/ExplanatoryNotes/index.htm).

COT Bonds Futures Charts: Fed Funds, 10-Year Treasuries, 2-Year, 5-Year Treasury Notes, Eurodollars

By CountingPips.com COT Home | Data Tables | Data Downloads | Newsletter

Here are the latest charts and statistics for the Commitment of Traders (COT) data published by the Commodities Futures Trading Commission (CFTC).

The latest COT data is updated through Tuesday June 15 2021 and shows a quick view of how large traders (for-profit speculators and commercial entities) were positioned in the futures markets.


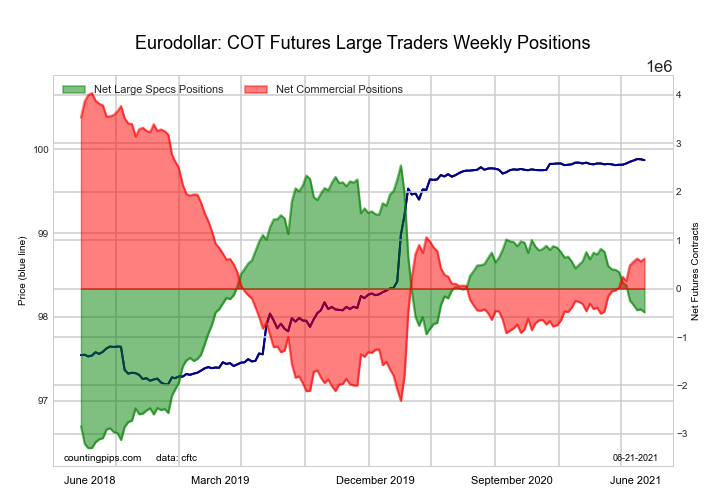
3-Month Eurodollars Futures:

Eurodollar Bonds Futures COT ChartThe 3-Month Eurodollars large speculator standing this week was a net position of -488,309 contracts in the data reported through Tuesday. This was a weekly decrease of -62,031 contracts from the previous week which had a total of -426,278 net contracts.

This week’s current strength score (the trader positioning range over the past three years, measured from 0 to 100) shows the speculators are currently Bearish with a score of 48.0 percent. The commercials are Bearish with a score of 46.2 percent and the small traders (not shown in chart) are Bullish-Extreme with a score of 86.1 percent.

3-Month Eurodollars StatisticsSPECULATORSCOMMERCIALSSMALL TRADERS
– Percent of Open Interest Longs:18.252.85.5
– Percent of Open Interest Shorts:22.247.86.6
– Net Position:-488,309616,176-127,867
– Gross Longs:2,215,9556,424,614672,185
– Gross Shorts:2,704,2645,808,438800,052
– Long to Short Ratio:0.8 to 11.1 to 10.8 to 1
NET POSITION TREND:
– COT Index Score (3 Year Range Pct):48.046.286.1
– COT Index Reading (3 Year Range):BearishBearishBullish-Extreme
NET POSITION MOVEMENT INDEX:
– 6-Week Change in Strength Index:-10.55.931.0


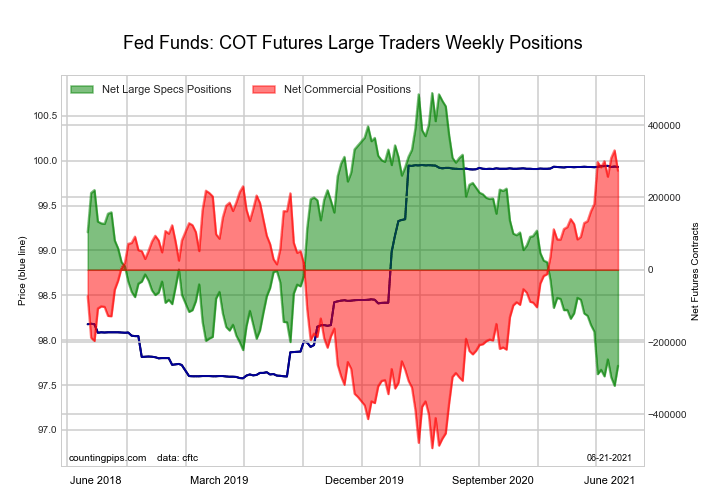
30-Day Federal Funds Futures:

Federal Funds 30-Day Bonds Futures COT Chart
The 30-Day Federal Funds large speculator standing this week was a net position of -265,679 contracts in the data reported through Tuesday. This was a weekly lift of 55,238 contracts from the previous week which had a total of -320,917 net contracts.

This week’s current strength score (the trader positioning range over the past three years, measured from 0 to 100) shows the speculators are currently Bearish-Extreme with a score of 6.8 percent. The commercials are Bullish-Extreme with a score of 93.2 percent and the small traders (not shown in chart) are Bullish with a score of 55.6 percent.

30-Day Federal Funds StatisticsSPECULATORSCOMMERCIALSSMALL TRADERS
– Percent of Open Interest Longs:2.777.62.2
– Percent of Open Interest Shorts:28.151.53.0
– Net Position:-265,679274,190-8,511
– Gross Longs:28,685813,94123,258
– Gross Shorts:294,364539,75131,769
– Long to Short Ratio:0.1 to 11.5 to 10.7 to 1
NET POSITION TREND:
– COT Index Score (3 Year Range Pct):6.893.255.6
– COT Index Reading (3 Year Range):Bearish-ExtremeBullish-ExtremeBullish
NET POSITION MOVEMENT INDEX:
– 6-Week Change in Strength Index:2.8-2.91.7


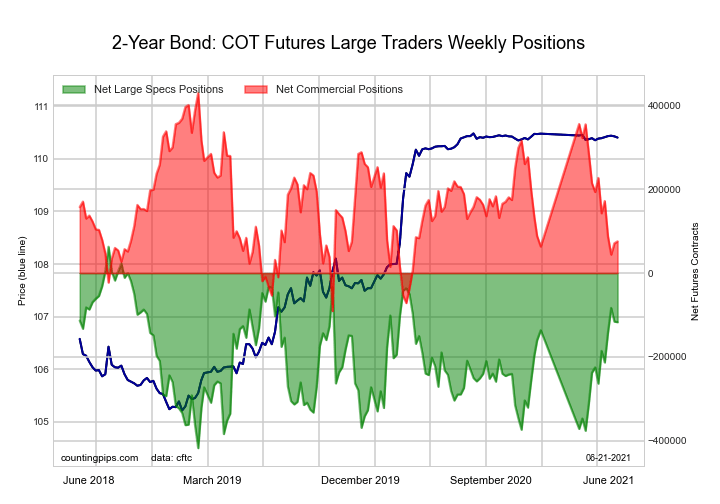
2-Year Treasury Note Futures:

2-Year Treasury Bonds Futures COT ChartThe 2-Year Treasury Note large speculator standing this week was a net position of -116,940 contracts in the data reported through Tuesday. This was a weekly fall of -1,407 contracts from the previous week which had a total of -115,533 net contracts.
This week’s current strength score (the trader positioning range over the past three years, measured from 0 to 100) shows the speculators are currently Bullish with a score of 68.1 percent. The commercials are Bearish with a score of 32.0 percent and the small traders (not shown in chart) are Bullish with a score of 56.6 percent.

2-Year Treasury Note StatisticsSPECULATORSCOMMERCIALSSMALL TRADERS
– Percent of Open Interest Longs:23.766.97.6
– Percent of Open Interest Shorts:29.263.35.6
– Net Position:-116,94075,76941,171
– Gross Longs:502,2381,419,278160,879
– Gross Shorts:619,1781,343,509119,708
– Long to Short Ratio:0.8 to 11.1 to 11.3 to 1
NET POSITION TREND:
– COT Index Score (3 Year Range Pct):68.132.056.6
– COT Index Reading (3 Year Range):BullishBearishBullish
NET POSITION MOVEMENT INDEX:
– 6-Week Change in Strength Index:33.2-29.12.5


5-Year Treasury Note Futures:

5-Year Treasury Bonds Futures COT ChartThe 5-Year Treasury Note large speculator standing this week was a net position of -111,018 contracts in the data reported through Tuesday. This was a weekly lift of 27,160 contracts from the previous week which had a total of -138,178 net contracts.
This week’s current strength score (the trader positioning range over the past three years, measured from 0 to 100) shows the speculators are currently Bullish with a score of 78.6 percent. The commercials are Bearish with a score of 25.9 percent and the small traders (not shown in chart) are Bearish with a score of 38.0 percent.

5-Year Treasury Note StatisticsSPECULATORSCOMMERCIALSSMALL TRADERS
– Percent of Open Interest Longs:13.675.98.7
– Percent of Open Interest Shorts:16.770.710.7
– Net Position:-111,018182,709-71,691
– Gross Longs:480,6592,685,328307,631
– Gross Shorts:591,6772,502,619379,322
– Long to Short Ratio:0.8 to 11.1 to 10.8 to 1
NET POSITION TREND:
– COT Index Score (3 Year Range Pct):78.625.938.0
– COT Index Reading (3 Year Range):BullishBearishBearish
NET POSITION MOVEMENT INDEX:
– 6-Week Change in Strength Index:-0.1-1.79.2


10-Year Treasury Note Futures:

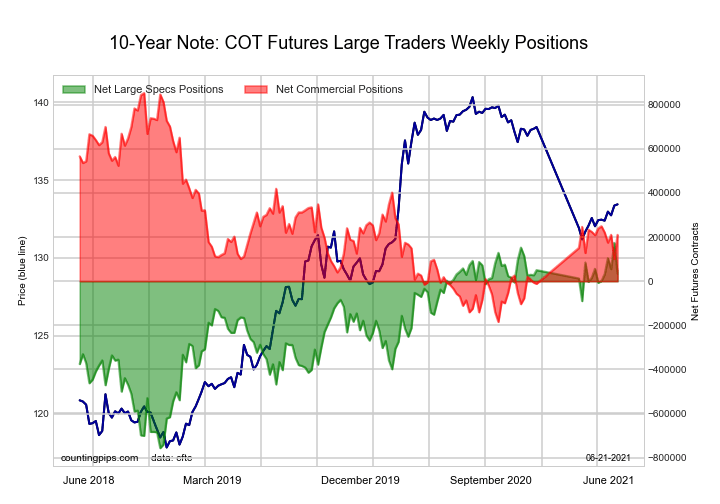
10-Year Treasury Notes Bonds Futures COT ChartThe 10-Year Treasury Note large speculator standing this week was a net position of 34,336 contracts in the data reported through Tuesday. This was a weekly fall of -139,084 contracts from the previous week which had a total of 173,420 net contracts.
This week’s current strength score (the trader positioning range over the past three years, measured from 0 to 100) shows the speculators are currently Bullish-Extreme with a score of 85.0 percent. The commercials are Bearish with a score of 38.0 percent and the small traders (not shown in chart) are Bearish-Extreme with a score of 9.4 percent.

10-Year Treasury Note StatisticsSPECULATORSCOMMERCIALSSMALL TRADERS
– Percent of Open Interest Longs:21.669.67.2
– Percent of Open Interest Shorts:20.864.912.8
– Net Position:34,336209,999-244,335
– Gross Longs:951,4233,062,847318,298
– Gross Shorts:917,0872,852,848562,633
– Long to Short Ratio:1.0 to 11.1 to 10.6 to 1
NET POSITION TREND:
– COT Index Score (3 Year Range Pct):85.038.09.4
– COT Index Reading (3 Year Range):Bullish-ExtremeBearishBearish-Extreme
NET POSITION MOVEMENT INDEX:
– 6-Week Change in Strength Index:4.5-2.8-3.3


Ultra 10-Year Notes Futures:

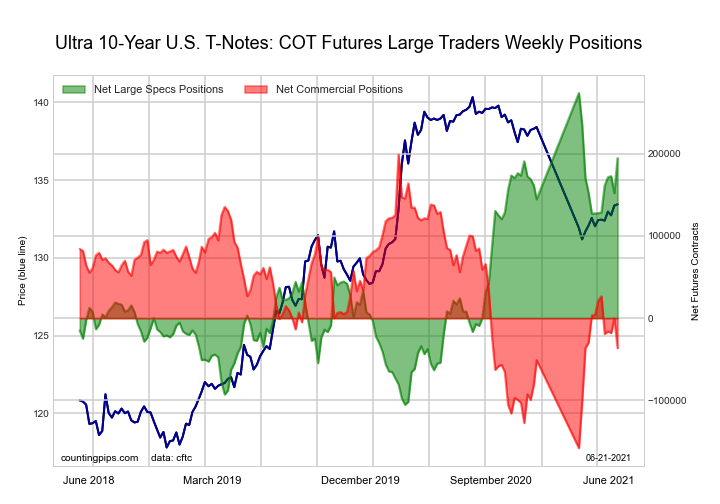
Ultra 10-Year Treasury Notes Bonds Futures COT ChartThe Ultra 10-Year Notes large speculator standing this week was a net position of 194,607 contracts in the data reported through Tuesday. This was a weekly lift of 42,572 contracts from the previous week which had a total of 152,035 net contracts.
This week’s current strength score (the trader positioning range over the past three years, measured from 0 to 100) shows the speculators are currently Bullish with a score of 79.1 percent. The commercials are Bearish with a score of 34.1 percent and the small traders (not shown in chart) are Bearish-Extreme with a score of 0.0 percent.

Ultra 10-Year Notes StatisticsSPECULATORSCOMMERCIALSSMALL TRADERS
– Percent of Open Interest Longs:19.372.27.2
– Percent of Open Interest Shorts:6.874.617.3
– Net Position:194,607-36,358-158,249
– Gross Longs:300,0681,124,350111,282
– Gross Shorts:105,4611,160,708269,531
– Long to Short Ratio:2.8 to 11.0 to 10.4 to 1
NET POSITION TREND:
– COT Index Score (3 Year Range Pct):79.134.10.0
– COT Index Reading (3 Year Range):BullishBearishBearish-Extreme
NET POSITION MOVEMENT INDEX:
– 6-Week Change in Strength Index:17.7-16.1-7.1


US Treasury Bonds Futures:

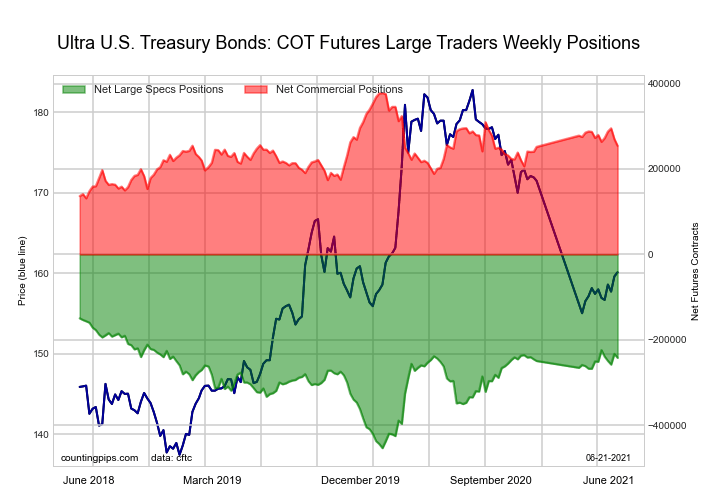
US Year Treasury Notes Long Bonds Futures COT ChartThe US Treasury Bonds large speculator standing this week was a net position of -56,687 contracts in the data reported through Tuesday. This was a weekly rise of 13,901 contracts from the previous week which had a total of -70,588 net contracts.
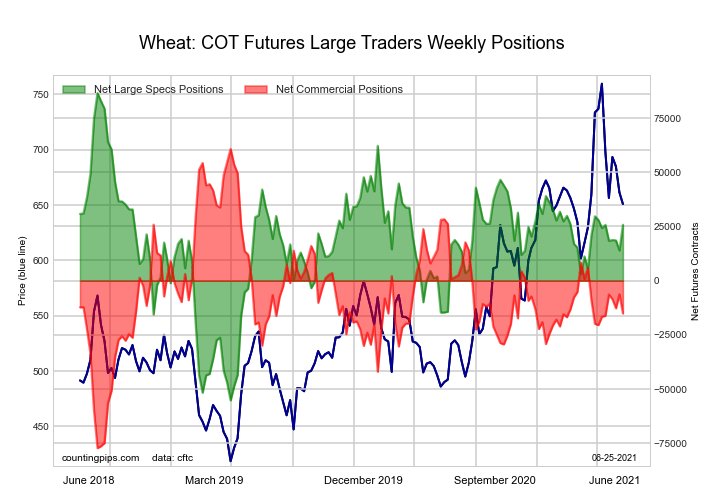
This week’s current strength score (the trader positioning range over the past three years, measured from 0 to 100) shows the speculators are currently Bullish with a score of 73.1 percent. The commercials are Bullish with a score of 50.1 percent and the small traders (not shown in chart) are Bearish with a score of 22.9 percent.

US Treasury Bonds StatisticsSPECULATORSCOMMERCIALSSMALL TRADERS
– Percent of Open Interest Longs:9.774.313.9
– Percent of Open Interest Shorts:14.466.517.1
– Net Position:-56,68794,046-37,359
– Gross Longs:116,862893,891167,707
– Gross Shorts:173,549799,845205,066
– Long to Short Ratio:0.7 to 11.1 to 10.8 to 1
NET POSITION TREND:
– COT Index Score (3 Year Range Pct):73.150.122.9
– COT Index Reading (3 Year Range):BullishBullishBearish
NET POSITION MOVEMENT INDEX:
– 6-Week Change in Strength Index:27.0-28.912.4


Ultra US Treasury Bonds Futures:

Ultra US Year Treasury Notes Long Bonds Futures COT ChartThe Ultra US Treasury Bonds large speculator standing this week was a net position of -242,409 contracts in the data reported through Tuesday. This was a weekly decline of -9,145 contracts from the previous week which had a total of -233,264 net contracts.

This week’s current strength score (the trader positioning range over the past three years, measured from 0 to 100) shows the speculators are currently Bullish with a score of 78.9 percent. The commercials are Bearish with a score of 45.8 percent and the small traders (not shown in chart) are Bearish-Extreme with a score of 19.7 percent.

Ultra US Treasury Bonds StatisticsSPECULATORSCOMMERCIALSSMALL TRADERS
– Percent of Open Interest Longs:7.779.811.7
– Percent of Open Interest Shorts:27.758.912.6
– Net Position:-242,409254,315-11,906
– Gross Longs:94,134971,081141,913
– Gross Shorts:336,543716,766153,819
– Long to Short Ratio:0.3 to 11.4 to 10.9 to 1
NET POSITION TREND:
– COT Index Score (3 Year Range Pct):78.945.819.7
– COT Index Reading (3 Year Range):BullishBearishBearish-Extreme
NET POSITION MOVEMENT INDEX:
– 6-Week Change in Strength Index:3.4-11.211.8


Article By CountingPips.comReceive our weekly COT Reports by Email

*COT Report: The COT data, released weekly to the public each Friday, is updated through the most recent Tuesday (data is 3 days old) and shows a quick view of how large speculators or non-commercials (for-profit traders) were positioned in the futures markets.

The CFTC categorizes trader positions according to commercial hedgers (traders who use futures contracts for hedging as part of the business), non-commercials (large traders who speculate to realize trading profits) and nonreportable traders (usually small traders/speculators).

Find CFTC criteria here: (http://www.cftc.gov/MarketReports/CommitmentsofTraders/ExplanatoryNotes/index.htm).

COT Soft Commodities Futures Charts: Corn, Soybeans, Wheat, Cattle, Hogs, Sugar, Coffee, Cotton

By CountingPips.com COT Home | Data Tables | Data Downloads | Newsletter

Here are the latest charts and statistics for the Commitment of Traders (COT) data published by the Commodities Futures Trading Commission (CFTC).

The latest COT data is updated through Tuesday June 15 2021 and shows a quick view of how large traders (for-profit speculators and commercial entities) were positioned in the futures markets.


CORN Futures:

Federal Funds 30-Day Bonds Futures COT ChartThe CORN large speculator standing this week reached a net position of 401,376 contracts in the data reported through Tuesday. This was a weekly decrease of -27,052 contracts from the previous week which had a total of 428,428 net contracts.

This week’s current strength score (the trader positioning range over the past three years, measured from 0 to 100) shows the speculators are currently Bullish-Extreme with a score of 81.3 percent. The commercials are Bearish with a score of 22.2 percent and the small traders (not shown in chart) are Bearish-Extreme with a score of 6.3 percent.

CORN Futures StatisticsSPECULATORSCOMMERCIALSSMALL TRADERS
– Percent of Open Interest Longs:28.849.38.1
– Percent of Open Interest Shorts:5.569.611.1
– Net Position:401,376-348,905-52,471
– Gross Longs:496,763850,374138,860
– Gross Shorts:95,3871,199,279191,331
– Long to Short Ratio:5.2 to 10.7 to 10.7 to 1
NET POSITION TREND:
– COT Index Score (3 Year Range Pct):81.322.26.3
– COT Index Reading (3 Year Range):Bullish-ExtremeBearishBearish-Extreme
NET POSITION MOVEMENT INDEX:
– 6-Week Change in Strength Index:-17.220.7-6.5


SUGAR Futures:

2-Year Treasury Bonds Futures COT ChartThe SUGAR large speculator standing this week reached a net position of 269,661 contracts in the data reported through Tuesday. This was a weekly decrease of -448 contracts from the previous week which had a total of 270,109 net contracts.
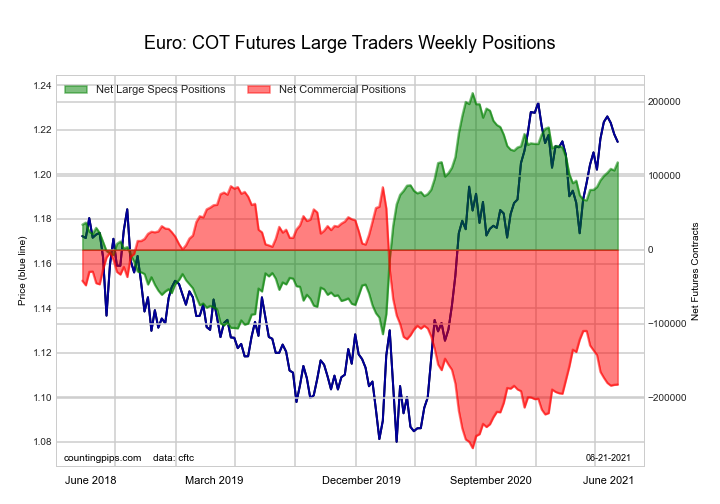
This week’s current strength score (the trader positioning range over the past three years, measured from 0 to 100) shows the speculators are currently Bullish-Extreme with a score of 92.0 percent. The commercials are Bearish-Extreme with a score of 7.7 percent and the small traders (not shown in chart) are Bullish with a score of 68.5 percent.

SUGAR Futures StatisticsSPECULATORSCOMMERCIALSSMALL TRADERS
– Percent of Open Interest Longs:30.745.49.3
– Percent of Open Interest Shorts:3.877.14.5
– Net Position:269,661-318,74449,083
– Gross Longs:308,086454,80293,721
– Gross Shorts:38,425773,54644,638
– Long to Short Ratio:8.0 to 10.6 to 12.1 to 1
NET POSITION TREND:
– COT Index Score (3 Year Range Pct):92.07.768.5
– COT Index Reading (3 Year Range):Bullish-ExtremeBearish-ExtremeBullish
NET POSITION MOVEMENT INDEX:
– 6-Week Change in Strength Index:1.41.2-16.3


COFFEE Futures:

5-Year Treasury Bonds Futures COT ChartThe COFFEE large speculator standing this week reached a net position of 63,152 contracts in the data reported through Tuesday. This was a weekly decline of -5,252 contracts from the previous week which had a total of 68,404 net contracts.
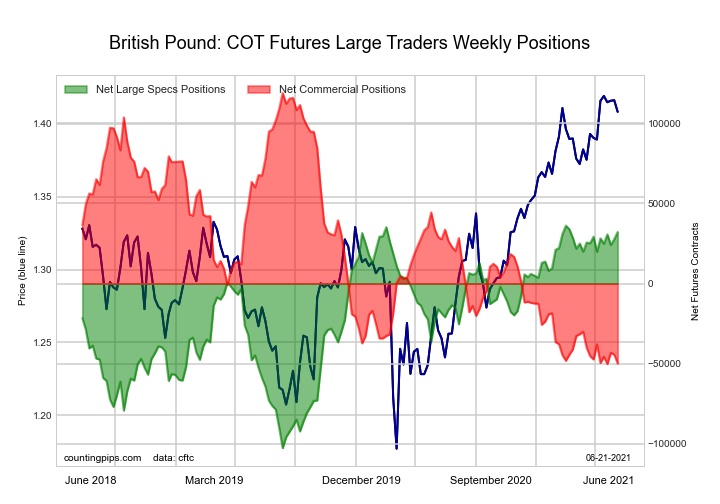
This week’s current strength score (the trader positioning range over the past three years, measured from 0 to 100) shows the speculators are currently Bullish-Extreme with a score of 95.5 percent. The commercials are Bearish-Extreme with a score of 4.6 percent and the small traders (not shown in chart) are Bearish with a score of 27.4 percent.

COFFEE Futures StatisticsSPECULATORSCOMMERCIALSSMALL TRADERS
– Percent of Open Interest Longs:30.846.64.6
– Percent of Open Interest Shorts:8.471.02.6
– Net Position:63,152-68,7945,642
– Gross Longs:86,836131,30412,846
– Gross Shorts:23,684200,0987,204
– Long to Short Ratio:3.7 to 10.7 to 11.8 to 1
NET POSITION TREND:
– COT Index Score (3 Year Range Pct):95.54.627.4
– COT Index Reading (3 Year Range):Bullish-ExtremeBearish-ExtremeBearish
NET POSITION MOVEMENT INDEX:
– 6-Week Change in Strength Index:2.8-2.5-4.2


SOYBEANS Futures:

10-Year Treasury Notes Bonds Futures COT ChartThe SOYBEANS large speculator standing this week reached a net position of 205,393 contracts in the data reported through Tuesday. This was a weekly lowering of -21,295 contracts from the previous week which had a total of 226,688 net contracts.
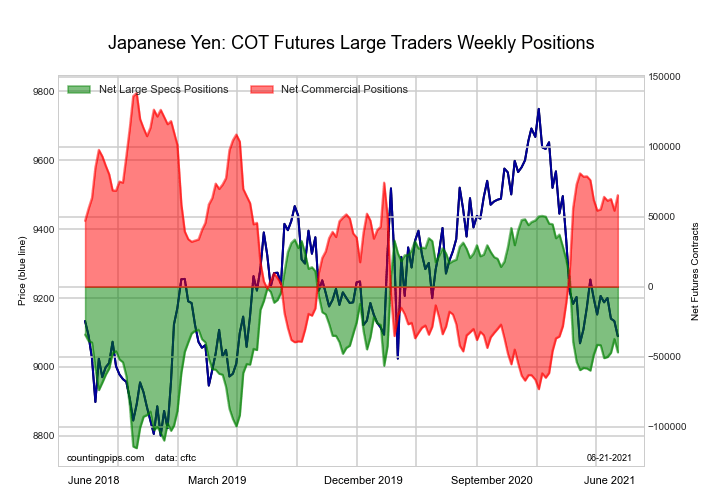
This week’s current strength score (the trader positioning range over the past three years, measured from 0 to 100) shows the speculators are currently Bullish-Extreme with a score of 81.1 percent. The commercials are Bearish with a score of 20.1 percent and the small traders (not shown in chart) are Bullish with a score of 53.4 percent.

SOYBEANS Futures StatisticsSPECULATORSCOMMERCIALSSMALL TRADERS
– Percent of Open Interest Longs:33.346.07.1
– Percent of Open Interest Shorts:7.470.68.5
– Net Position:205,393-194,308-11,085
– Gross Longs:263,867364,25256,004
– Gross Shorts:58,474558,56067,089
– Long to Short Ratio:4.5 to 10.7 to 10.8 to 1
NET POSITION TREND:
– COT Index Score (3 Year Range Pct):81.120.153.4
– COT Index Reading (3 Year Range):Bullish-ExtremeBearishBullish
NET POSITION MOVEMENT INDEX:
– 6-Week Change in Strength Index:-10.410.9-6.9


SOYBEAN OIL Futures:

Ultra 10-Year Treasury Notes Bonds Futures COT ChartThe SOYBEAN OIL large speculator standing this week reached a net position of 68,591 contracts in the data reported through Tuesday. This was a weekly decline of -15,300 contracts from the previous week which had a total of 83,891 net contracts.
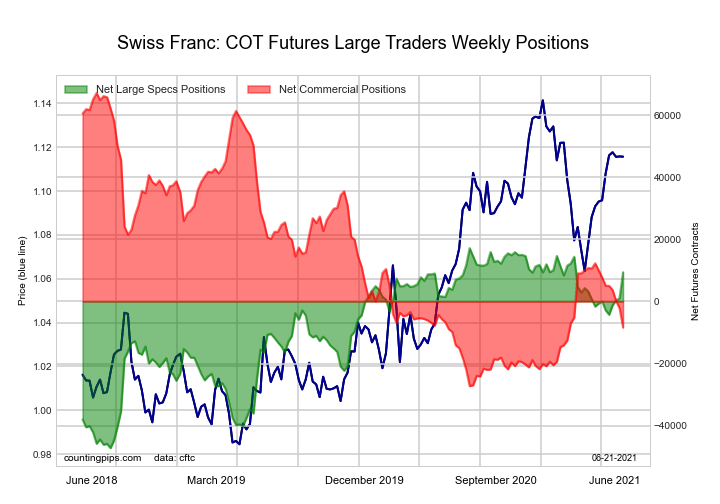
This week’s current strength score (the trader positioning range over the past three years, measured from 0 to 100) shows the speculators are currently Bullish with a score of 65.6 percent. The commercials are Bearish with a score of 33.8 percent and the small traders (not shown in chart) are Bullish with a score of 68.9 percent.

SOYBEAN OIL Futures StatisticsSPECULATORSCOMMERCIALSSMALL TRADERS
– Percent of Open Interest Longs:20.149.87.7
– Percent of Open Interest Shorts:7.465.25.0
– Net Position:68,591-83,44914,858
– Gross Longs:108,486268,91341,639
– Gross Shorts:39,895352,36226,781
– Long to Short Ratio:2.7 to 10.8 to 11.6 to 1
NET POSITION TREND:
– COT Index Score (3 Year Range Pct):65.633.868.9
– COT Index Reading (3 Year Range):BullishBearishBullish
NET POSITION MOVEMENT INDEX:
– 6-Week Change in Strength Index:-6.67.9-14.3


SOYBEAN MEAL Futures:

US Year Treasury Notes Long Bonds Futures COT ChartThe SOYBEAN MEAL large speculator standing this week reached a net position of 53,771 contracts in the data reported through Tuesday. This was a weekly decrease of -6,651 contracts from the previous week which had a total of 60,422 net contracts.
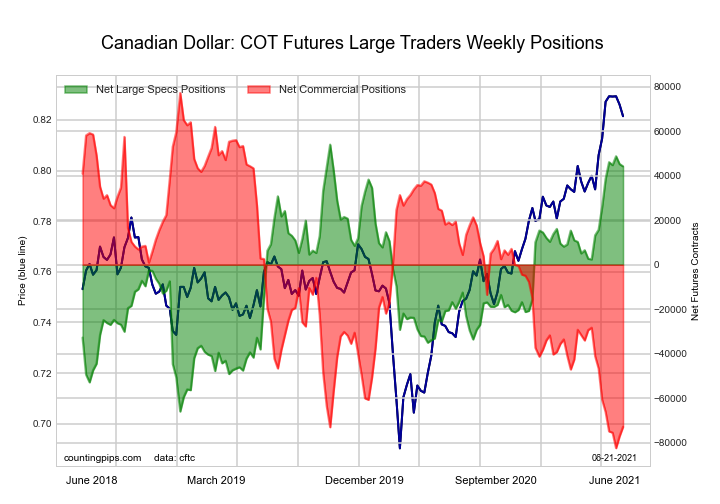
This week’s current strength score (the trader positioning range over the past three years, measured from 0 to 100) shows the speculators are currently Bullish with a score of 60.3 percent. The commercials are Bearish with a score of 38.7 percent and the small traders (not shown in chart) are Bullish with a score of 61.2 percent.

SOYBEAN MEAL Futures StatisticsSPECULATORSCOMMERCIALSSMALL TRADERS
– Percent of Open Interest Longs:21.552.512.3
– Percent of Open Interest Shorts:8.371.36.7
– Net Position:53,771-76,35822,587
– Gross Longs:87,485214,10250,004
– Gross Shorts:33,714290,46027,417
– Long to Short Ratio:2.6 to 10.7 to 11.8 to 1
NET POSITION TREND:
– COT Index Score (3 Year Range Pct):60.338.761.2
– COT Index Reading (3 Year Range):BullishBearishBullish
NET POSITION MOVEMENT INDEX:
– 6-Week Change in Strength Index:-21.821.8-5.2


LIVE CATTLE Futures:

Ultra US Year Treasury Notes Long Bonds Futures COT ChartThe LIVE CATTLE large speculator standing this week reached a net position of 69,321 contracts in the data reported through Tuesday. This was a weekly rise of 7,833 contracts from the previous week which had a total of 61,488 net contracts.
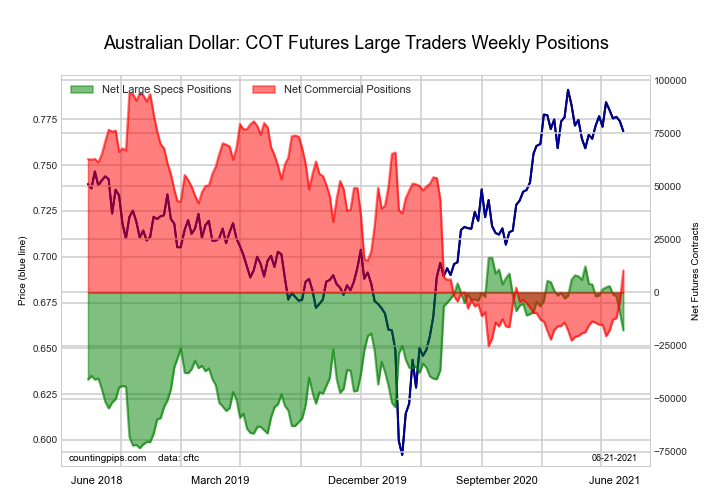
This week’s current strength score (the trader positioning range over the past three years, measured from 0 to 100) shows the speculators are currently Bearish with a score of 35.6 percent. The commercials are Bullish with a score of 58.1 percent and the small traders (not shown in chart) are Bullish with a score of 65.6 percent.

LIVE CATTLE Futures StatisticsSPECULATORSCOMMERCIALSSMALL TRADERS
– Percent of Open Interest Longs:39.539.59.2
– Percent of Open Interest Shorts:16.259.812.1
– Net Position:69,321-60,492-8,829
– Gross Longs:117,766117,94927,397
– Gross Shorts:48,445178,44136,226
– Long to Short Ratio:2.4 to 10.7 to 10.8 to 1
NET POSITION TREND:
– COT Index Score (3 Year Range Pct):35.658.165.6
– COT Index Reading (3 Year Range):BearishBullishBullish
NET POSITION MOVEMENT INDEX:
– 6-Week Change in Strength Index:9.3-7.4-12.0


LEAN HOGS Futures:

Eurodollar Bonds Futures COT ChartThe LEAN HOGS large speculator standing this week reached a net position of 84,053 contracts in the data reported through Tuesday. This was a weekly increase of 2,690 contracts from the previous week which had a total of 81,363 net contracts.

This week’s current strength score (the trader positioning range over the past three years, measured from 0 to 100) shows the speculators are currently Bullish-Extreme with a score of 99.0 percent. The commercials are Bearish-Extreme with a score of 2.7 percent and the small traders (not shown in chart) are Bearish with a score of 39.4 percent.

LEAN HOGS Futures StatisticsSPECULATORSCOMMERCIALSSMALL TRADERS
– Percent of Open Interest Longs:42.529.08.7
– Percent of Open Interest Shorts:15.253.811.3
– Net Position:84,053-75,962-8,091
– Gross Longs:130,60789,14526,564
– Gross Shorts:46,554165,10734,655
– Long to Short Ratio:2.8 to 10.5 to 10.8 to 1
NET POSITION TREND:
– COT Index Score (3 Year Range Pct):99.02.739.4
– COT Index Reading (3 Year Range):Bullish-ExtremeBearish-ExtremeBearish
NET POSITION MOVEMENT INDEX:
– 6-Week Change in Strength Index:5.7-3.9-8.9


COTTON Futures:

Ultra 10-Year Treasury Notes Bonds Futures COT ChartThe COTTON large speculator standing this week reached a net position of 65,704 contracts in the data reported through Tuesday. This was a weekly decline of -375 contracts from the previous week which had a total of 66,079 net contracts.
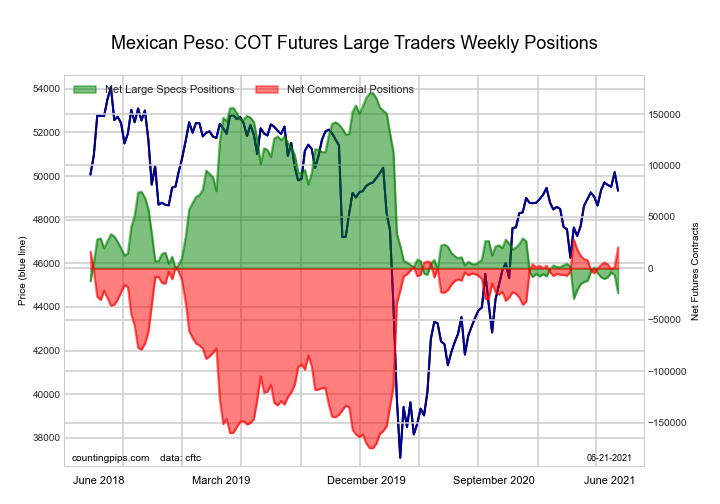
This week’s current strength score (the trader positioning range over the past three years, measured from 0 to 100) shows the speculators are currently Bullish with a score of 69.4 percent. The commercials are Bearish with a score of 28.8 percent and the small traders (not shown in chart) are Bullish with a score of 68.7 percent.
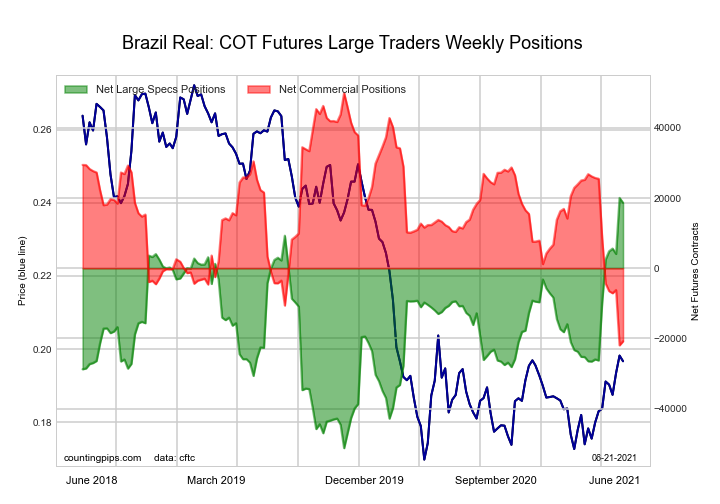
COTTON Futures StatisticsSPECULATORSCOMMERCIALSSMALL TRADERS
– Percent of Open Interest Longs:35.545.67.6
– Percent of Open Interest Shorts:5.180.03.6
– Net Position:65,704-74,3908,686
– Gross Longs:76,70898,60516,395
– Gross Shorts:11,004172,9957,709
– Long to Short Ratio:7.0 to 10.6 to 12.1 to 1
NET POSITION TREND:
– COT Index Score (3 Year Range Pct):69.428.868.7
– COT Index Reading (3 Year Range):BullishBearishBullish
NET POSITION MOVEMENT INDEX:
– 6-Week Change in Strength Index:-12.111.3-0.5


COCOA Futures:

US Year Treasury Notes Long Bonds Futures COT ChartThe COCOA large speculator standing this week reached a net position of 24,277 contracts in the data reported through Tuesday. This was a weekly decrease of -1,092 contracts from the previous week which had a total of 25,369 net contracts.

This week’s current strength score (the trader positioning range over the past three years, measured from 0 to 100) shows the speculators are currently Bearish with a score of 45.5 percent. The commercials are Bullish with a score of 53.7 percent and the small traders (not shown in chart) are Bullish with a score of 52.9 percent.

COCOA Futures StatisticsSPECULATORSCOMMERCIALSSMALL TRADERS
– Percent of Open Interest Longs:29.646.35.3
– Percent of Open Interest Shorts:18.459.33.4
– Net Position:24,277-28,1863,909
– Gross Longs:63,96599,90211,346
– Gross Shorts:39,688128,0887,437
– Long to Short Ratio:1.6 to 10.8 to 11.5 to 1
NET POSITION TREND:
– COT Index Score (3 Year Range Pct):45.553.752.9
– COT Index Reading (3 Year Range):BearishBullishBullish
NET POSITION MOVEMENT INDEX:
– 6-Week Change in Strength Index:6.3-5.4-9.1


WHEAT Futures:

Ultra US Year Treasury Notes Long Bonds Futures COT ChartThe WHEAT large speculator standing this week reached a net position of 13,948 contracts in the data reported through Tuesday. This was a weekly lowering of -4,669 contracts from the previous week which had a total of 18,617 net contracts.

This week’s current strength score (the trader positioning range over the past three years, measured from 0 to 100) shows the speculators are currently Bearish with a score of 48.8 percent. The commercials are Bullish with a score of 51.4 percent and the small traders (not shown in chart) are Bullish with a score of 64.8 percent.

WHEAT Futures StatisticsSPECULATORSCOMMERCIALSSMALL TRADERS
– Percent of Open Interest Longs:25.738.57.3
– Percent of Open Interest Shorts:22.440.09.1
– Net Position:13,948-6,244-7,704
– Gross Longs:108,694162,74530,804
– Gross Shorts:94,746168,98938,508
– Long to Short Ratio:1.1 to 11.0 to 10.8 to 1
NET POSITION TREND:
– COT Index Score (3 Year Range Pct):48.851.464.8
– COT Index Reading (3 Year Range):BearishBullishBullish
NET POSITION MOVEMENT INDEX:
– 6-Week Change in Strength Index:-9.910.3-0.5


Article By CountingPips.comReceive our weekly COT Reports by Email

*COT Report: The COT data, released weekly to the public each Friday, is updated through the most recent Tuesday (data is 3 days old) and shows a quick view of how large speculators or non-commercials (for-profit traders) were positioned in the futures markets.

The CFTC categorizes trader positions according to commercial hedgers (traders who use futures contracts for hedging as part of the business), non-commercials (large traders who speculate to realize trading profits) and nonreportable traders (usually small traders/speculators).

Find CFTC criteria here: (http://www.cftc.gov/MarketReports/CommitmentsofTraders/ExplanatoryNotes/index.htm).

COT Futures Metals Charts: Comex Gold, Silver, Copper, Platinum & Palladium

By CountingPips.com COT Home | Data Tables | Data Downloads | Newsletter

Here are the latest charts and statistics for the Commitment of Traders (COT) data published by the Commodities Futures Trading Commission (CFTC).

The latest COT data is updated through Tuesday June 15 2021 and shows a quick view of how large traders (for-profit speculators and commercial entities) were positioned in the futures markets.


Gold Comex Futures:

Federal Funds 30-Day Bonds Futures COT ChartThe Gold Comex Futures large speculator standing this week reached a net position of 192,036 contracts in the data reported through Tuesday. This was a weekly decrease of -17,351 contracts from the previous week which had a total of 209,387 net contracts.

This week’s current strength score (the trader positioning range over the past three years, measured from 0 to 100) shows the speculators are currently Bullish with a score of 58.8 percent. The commercials are Bearish with a score of 37.5 percent and the small traders (not shown in chart) are Bullish with a score of 78.9 percent.

Gold Futures StatisticsSPECULATORSCOMMERCIALSSMALL TRADERS
– Percent of Open Interest Longs:57.122.111.7
– Percent of Open Interest Shorts:17.170.33.6
– Net Position:192,036-231,22639,190
– Gross Longs:273,947106,32356,320
– Gross Shorts:81,911337,54917,130
– Long to Short Ratio:3.3 to 10.3 to 13.3 to 1
NET POSITION TREND:
– COT Index Score (3 Year Range Pct):58.837.578.9
– COT Index Reading (3 Year Range):BullishBearishBullish
NET POSITION MOVEMENT INDEX:
– 6-Week Change in Strength Index:5.4-7.119.6


Silver Comex Futures:

2-Year Treasury Bonds Futures COT ChartThe Silver Comex Futures large speculator standing this week reached a net position of 52,064 contracts in the data reported through Tuesday. This was a weekly lift of 2,258 contracts from the previous week which had a total of 49,806 net contracts.

This week’s current strength score (the trader positioning range over the past three years, measured from 0 to 100) shows the speculators are currently Bullish with a score of 75.8 percent. The commercials are Bearish with a score of 25.8 percent and the small traders (not shown in chart) are Bullish with a score of 51.4 percent.

Silver Futures StatisticsSPECULATORSCOMMERCIALSSMALL TRADERS
– Percent of Open Interest Longs:45.631.616.2
– Percent of Open Interest Shorts:18.868.26.5
– Net Position:52,064-71,00418,940
– Gross Longs:88,59161,39931,524
– Gross Shorts:36,527132,40312,584
– Long to Short Ratio:2.4 to 10.5 to 12.5 to 1
NET POSITION TREND:
– COT Index Score (3 Year Range Pct):75.825.851.4
– COT Index Reading (3 Year Range):BullishBearishBullish
NET POSITION MOVEMENT INDEX:
– 6-Week Change in Strength Index:3.9-2.1-10.5


Copper Grade #1 Futures:

5-Year Treasury Bonds Futures COT ChartThe Copper Grade #1 Futures large speculator standing this week reached a net position of 10,771 contracts in the data reported through Tuesday. This was a weekly fall of -3,864 contracts from the previous week which had a total of 14,635 net contracts.

This week’s current strength score (the trader positioning range over the past three years, measured from 0 to 100) shows the speculators are currently Bullish with a score of 50.1 percent. The commercials are Bearish with a score of 43.4 percent and the small traders (not shown in chart) are Bullish-Extreme with a score of 98.4 percent.

Copper Futures StatisticsSPECULATORSCOMMERCIALSSMALL TRADERS
– Percent of Open Interest Longs:39.234.511.9
– Percent of Open Interest Shorts:34.644.76.4
– Net Position:10,771-23,41712,646
– Gross Longs:90,20979,27227,369
– Gross Shorts:79,438102,68914,723
– Long to Short Ratio:1.1 to 10.8 to 11.9 to 1
NET POSITION TREND:
– COT Index Score (3 Year Range Pct):50.143.498.4
– COT Index Reading (3 Year Range):BullishBearishBullish-Extreme
NET POSITION MOVEMENT INDEX:
– 6-Week Change in Strength Index:-31.027.715.4


Platinum Futures:

10-Year Treasury Notes Bonds Futures COT ChartThe Platinum Futures large speculator standing this week reached a net position of 20,057 contracts in the data reported through Tuesday. This was a weekly decline of -107 contracts from the previous week which had a total of 20,164 net contracts.

This week’s current strength score (the trader positioning range over the past three years, measured from 0 to 100) shows the speculators are currently Bearish with a score of 40.2 percent. The commercials are Bullish with a score of 57.9 percent and the small traders (not shown in chart) are Bullish-Extreme with a score of 84.1 percent.

Platinum Futures StatisticsSPECULATORSCOMMERCIALSSMALL TRADERS
– Percent of Open Interest Longs:56.521.717.3
– Percent of Open Interest Shorts:25.766.03.8
– Net Position:20,057-28,7998,742
– Gross Longs:36,74514,11311,233
– Gross Shorts:16,68842,9122,491
– Long to Short Ratio:2.2 to 10.3 to 14.5 to 1
NET POSITION TREND:
– COT Index Score (3 Year Range Pct):40.257.984.1
– COT Index Reading (3 Year Range):BearishBullishBullish-Extreme
NET POSITION MOVEMENT INDEX:
– 6-Week Change in Strength Index:-10.39.90.9


Palladium Futures:

Ultra 10-Year Treasury Notes Bonds Futures COT ChartThe Palladium Futures large speculator standing this week reached a net position of 2,403 contracts in the data reported through Tuesday. This was a weekly lowering of -72 contracts from the previous week which had a total of 2,475 net contracts.

This week’s current strength score (the trader positioning range over the past three years, measured from 0 to 100) shows the speculators are currently Bearish-Extreme with a score of 14.4 percent. The commercials are Bullish with a score of 79.7 percent and the small traders (not shown in chart) are Bullish-Extreme with a score of 96.1 percent.

Palladium Futures StatisticsSPECULATORSCOMMERCIALSSMALL TRADERS
– Percent of Open Interest Longs:57.025.815.0
– Percent of Open Interest Shorts:34.756.26.9
– Net Position:2,403-3,276873
– Gross Longs:6,1312,7701,617
– Gross Shorts:3,7286,046744
– Long to Short Ratio:1.6 to 10.5 to 12.2 to 1
NET POSITION TREND:
– COT Index Score (3 Year Range Pct):14.479.796.1
– COT Index Reading (3 Year Range):Bearish-ExtremeBullishBullish-Extreme
NET POSITION MOVEMENT INDEX:
– 6-Week Change in Strength Index:-4.63.95.7


Article By CountingPips.comReceive our weekly COT Reports by Email

*COT Report: The COT data, released weekly to the public each Friday, is updated through the most recent Tuesday (data is 3 days old) and shows a quick view of how large speculators or non-commercials (for-profit traders) were positioned in the futures markets.

The CFTC categorizes trader positions according to commercial hedgers (traders who use futures contracts for hedging as part of the business), non-commercials (large traders who speculate to realize trading profits) and nonreportable traders (usually small traders/speculators).

Find CFTC criteria here: (http://www.cftc.gov/MarketReports/CommitmentsofTraders/ExplanatoryNotes/index.htm).

COT Energy Futures Charts: WTI & Brent Crude Oil, Natural Gas, Bloomberg Index, Heating Oil

By CountingPips.com COT Home | Data Tables | Data Downloads | Newsletter

Here are the latest charts and statistics for the Commitment of Traders (COT) data published by the Commodities Futures Trading Commission (CFTC).

The latest COT data is updated through Tuesday June 15 2021 and shows a quick view of how large traders (for-profit speculators and commercial entities) were positioned in the futures markets.


WTI Crude Oil Futures :

WTI Crude Oil Futures COT ChartThe WTI Crude Oil Futures large speculator standing this week equaled a net position of 523,956 contracts in the data reported through Tuesday. This was a weekly boost of 13,457 contracts from the previous week which had a total of 510,499 net contracts.

This week’s current strength score (the trader positioning range over the past three years, measured from 0 to 100) shows the speculators are currently Bullish with a score of 65.0 percent. The commercials are Bearish with a score of 28.0 percent and the small traders (not shown in chart) are Bullish-Extreme with a score of 82.6 percent.

WTI Crude Oil Futures StatisticsSPECULATORSCOMMERCIALSSMALL TRADERS
– Percent of Open Interest Longs:26.835.14.4
– Percent of Open Interest Shorts:5.758.22.5
– Net Position:523,956-571,90047,944
– Gross Longs:664,365868,390110,012
– Gross Shorts:140,4091,440,29062,068
– Long to Short Ratio:4.7 to 10.6 to 11.8 to 1
NET POSITION TREND:
– COT Index Score (3 Year Range Pct):65.028.082.6
– COT Index Reading (3 Year Range):BullishBearishBullish-Extreme
NET POSITION MOVEMENT INDEX:
– 6-Week Change in Strength Index:6.3-3.7-12.0


Brent Crude Oil Futures :

Brent Last Day Crude Oil Futures COT ChartThe Brent Crude Oil Futures large speculator standing this week equaled a net position of -20,354 contracts in the data reported through Tuesday. This was a weekly boost of 1,153 contracts from the previous week which had a total of -21,507 net contracts.

This week’s current strength score (the trader positioning range over the past three years, measured from 0 to 100) shows the speculators are currently Bullish with a score of 78.0 percent. The commercials are Bearish with a score of 22.7 percent and the small traders (not shown in chart) are Bullish with a score of 55.4 percent.

Brent Crude Oil Futures StatisticsSPECULATORSCOMMERCIALSSMALL TRADERS
– Percent of Open Interest Longs:19.549.84.1
– Percent of Open Interest Shorts:29.840.73.0
– Net Position:-20,35418,0752,279
– Gross Longs:38,57898,5008,199
– Gross Shorts:58,93280,4255,920
– Long to Short Ratio:0.7 to 11.2 to 11.4 to 1
NET POSITION TREND:
– COT Index Score (3 Year Range Pct):78.022.755.4
– COT Index Reading (3 Year Range):BullishBearishBullish
NET POSITION MOVEMENT INDEX:
– 6-Week Change in Strength Index:7.2-9.210.7


Natural Gas Futures :

Natural Gas Futures COT ChartThe Natural Gas Futures large speculator standing this week equaled a net position of -107,696 contracts in the data reported through Tuesday. This was a weekly lowering of -5,188 contracts from the previous week which had a total of -102,508 net contracts.

This week’s current strength score (the trader positioning range over the past three years, measured from 0 to 100) shows the speculators are currently Bearish with a score of 46.3 percent. The commercials are Bullish with a score of 53.9 percent and the small traders (not shown in chart) are Bullish with a score of 57.7 percent.

Natural Gas Futures StatisticsSPECULATORSCOMMERCIALSSMALL TRADERS
– Percent of Open Interest Longs:25.441.54.8
– Percent of Open Interest Shorts:33.436.12.2
– Net Position:-107,69673,17534,521
– Gross Longs:340,670557,26364,058
– Gross Shorts:448,366484,08829,537
– Long to Short Ratio:0.8 to 11.2 to 12.2 to 1
NET POSITION TREND:
– COT Index Score (3 Year Range Pct):46.353.957.7
– COT Index Reading (3 Year Range):BearishBullishBullish
NET POSITION MOVEMENT INDEX:
– 6-Week Change in Strength Index:-15.613.331.4


Gasoline Blendstock Futures :

RBOB Gasoline Energy Futures COT ChartThe Gasoline Blendstock Futures large speculator standing this week equaled a net position of 48,643 contracts in the data reported through Tuesday. This was a weekly decline of -5,109 contracts from the previous week which had a total of 53,752 net contracts.

This week’s current strength score (the trader positioning range over the past three years, measured from 0 to 100) shows the speculators are currently Bearish-Extreme with a score of 8.7 percent. The commercials are Bullish-Extreme with a score of 80.5 percent and the small traders (not shown in chart) are Bullish with a score of 69.3 percent.

Nasdaq Mini Futures StatisticsSPECULATORSCOMMERCIALSSMALL TRADERS
– Percent of Open Interest Longs:21.054.15.4
– Percent of Open Interest Shorts:10.067.33.3
– Net Position:48,643-58,3049,661
– Gross Longs:93,176240,05024,138
– Gross Shorts:44,533298,35414,477
– Long to Short Ratio:2.1 to 10.8 to 11.7 to 1
NET POSITION TREND:
– COT Index Score (3 Year Range Pct):8.780.569.3
– COT Index Reading (3 Year Range):Bearish-ExtremeBullish-ExtremeBullish
NET POSITION MOVEMENT INDEX:
– 6-Week Change in Strength Index:-13.111.8-0.8


#2 Heating Oil NY-Harbor Futures :

NY Harbor Heating Oil Energy Futures COT ChartThe #2 Heating Oil NY-Harbor Futures large speculator standing this week equaled a net position of 23,395 contracts in the data reported through Tuesday. This was a weekly boost of 2,308 contracts from the previous week which had a total of 21,087 net contracts.

This week’s current strength score (the trader positioning range over the past three years, measured from 0 to 100) shows the speculators are currently Bullish with a score of 65.1 percent. The commercials are Bearish with a score of 27.3 percent and the small traders (not shown in chart) are Bullish-Extreme with a score of 84.2 percent.

Heating Oil Futures StatisticsSPECULATORSCOMMERCIALSSMALL TRADERS
– Percent of Open Interest Longs:15.849.511.0
– Percent of Open Interest Shorts:10.559.66.2
– Net Position:23,395-44,80321,408
– Gross Longs:69,723218,58848,654
– Gross Shorts:46,328263,39127,246
– Long to Short Ratio:1.5 to 10.8 to 11.8 to 1
NET POSITION TREND:
– COT Index Score (3 Year Range Pct):65.127.384.2
– COT Index Reading (3 Year Range):BullishBearishBullish-Extreme
NET POSITION MOVEMENT INDEX:
– 6-Week Change in Strength Index:24.5-16.0-15.8


Bloomberg Commodity Index Futures :

Bloomberg Commodity Index Futures COT ChartThe Bloomberg Commodity Index Futures large speculator standing this week equaled a net position of -19,849 contracts in the data reported through Tuesday. This was a weekly fall of -1,398 contracts from the previous week which had a total of -18,451 net contracts.

This week’s current strength score (the trader positioning range over the past three years, measured from 0 to 100) shows the speculators are currently Bearish-Extreme with a score of 17.3 percent. The commercials are Bullish with a score of 79.8 percent and the small traders (not shown in chart) are Bullish-Extreme with a score of 100.0 percent.

Bloomberg Index Futures StatisticsSPECULATORSCOMMERCIALSSMALL TRADERS
– Percent of Open Interest Longs:40.740.83.4
– Percent of Open Interest Shorts:77.37.40.2
– Net Position:-19,84918,1291,720
– Gross Longs:22,14122,1691,848
– Gross Shorts:41,9904,040128
– Long to Short Ratio:0.5 to 15.5 to 114.4 to 1
NET POSITION TREND:
– COT Index Score (3 Year Range Pct):17.379.8100.0
– COT Index Reading (3 Year Range):Bearish-ExtremeBullishBullish-Extreme
NET POSITION MOVEMENT INDEX:
– 6-Week Change in Strength Index:-20.517.662.9


Article By CountingPips.comReceive our weekly COT Reports by Email

*COT Report: The COT data, released weekly to the public each Friday, is updated through the most recent Tuesday (data is 3 days old) and shows a quick view of how large speculators or non-commercials (for-profit traders) were positioned in the futures markets.

The CFTC categorizes trader positions according to commercial hedgers (traders who use futures contracts for hedging as part of the business), non-commercials (large traders who speculate to realize trading profits) and nonreportable traders (usually small traders/speculators).

Find CFTC criteria here: (http://www.cftc.gov/MarketReports/CommitmentsofTraders/ExplanatoryNotes/index.htm).