
By CountingPips.com COT Home | Data Tables | Data Downloads | Newsletter
Here are the latest charts and statistics for the Commitment of Traders (COT) data published by the Commodities Futures Trading Commission (CFTC).
The latest COT data is updated through Tuesday June 15 2021 and shows a quick view of how large traders (for-profit speculators and commercial entities) were positioned in the futures markets.
WTI Crude Oil Futures :
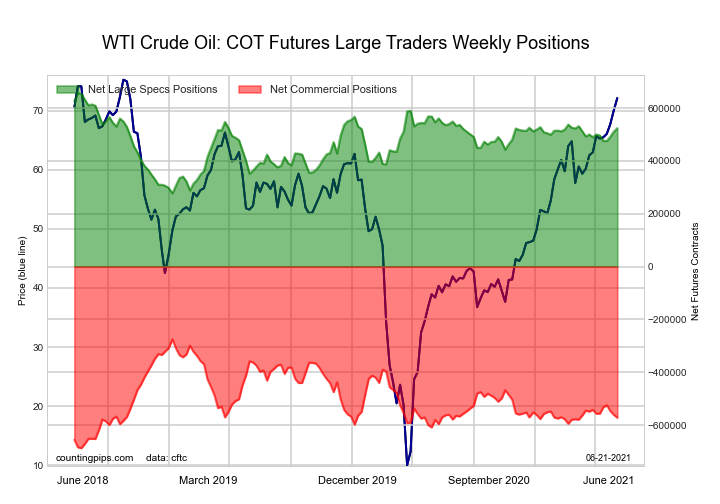 The WTI Crude Oil Futures large speculator standing this week equaled a net position of 523,956 contracts in the data reported through Tuesday. This was a weekly boost of 13,457 contracts from the previous week which had a total of 510,499 net contracts.
This week’s current strength score (the trader positioning range over the past three years, measured from 0 to 100) shows the speculators are currently Bullish with a score of 65.0 percent. The commercials are Bearish with a score of 28.0 percent and the small traders (not shown in chart) are Bullish-Extreme with a score of 82.6 percent.
| WTI Crude Oil Futures Statistics | SPECULATORS | COMMERCIALS | SMALL TRADERS |
| – Percent of Open Interest Longs: | 26.8 | 35.1 | 4.4 |
| – Percent of Open Interest Shorts: | 5.7 | 58.2 | 2.5 |
| – Net Position: | 523,956 | -571,900 | 47,944 |
| – Gross Longs: | 664,365 | 868,390 | 110,012 |
| – Gross Shorts: | 140,409 | 1,440,290 | 62,068 |
| – Long to Short Ratio: | 4.7 to 1 | 0.6 to 1 | 1.8 to 1 |
| NET POSITION TREND: | |||
| – COT Index Score (3 Year Range Pct): | 65.0 | 28.0 | 82.6 |
| – COT Index Reading (3 Year Range): | Bullish | Bearish | Bullish-Extreme |
| NET POSITION MOVEMENT INDEX: | |||
| – 6-Week Change in Strength Index: | 6.3 | -3.7 | -12.0 |
Free Reports:
 Download Our Metatrader 4 Indicators – Put Our Free MetaTrader 4 Custom Indicators on your charts when you join our Weekly Newsletter
 Get our Weekly Commitment of Traders Reports - See where the biggest traders (Hedge Funds and Commercial Hedgers) are positioned in the futures markets on a weekly basis.
Brent Crude Oil Futures :
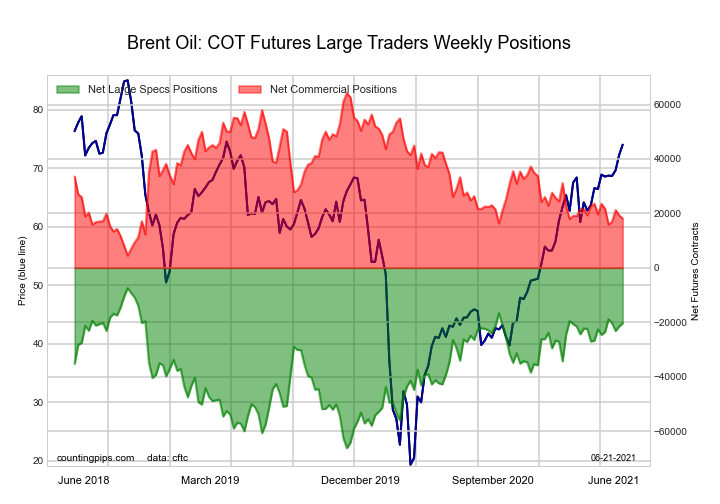 The Brent Crude Oil Futures large speculator standing this week equaled a net position of -20,354 contracts in the data reported through Tuesday. This was a weekly boost of 1,153 contracts from the previous week which had a total of -21,507 net contracts.
This week’s current strength score (the trader positioning range over the past three years, measured from 0 to 100) shows the speculators are currently Bullish with a score of 78.0 percent. The commercials are Bearish with a score of 22.7 percent and the small traders (not shown in chart) are Bullish with a score of 55.4 percent.
| Brent Crude Oil Futures Statistics | SPECULATORS | COMMERCIALS | SMALL TRADERS |
| – Percent of Open Interest Longs: | 19.5 | 49.8 | 4.1 |
| – Percent of Open Interest Shorts: | 29.8 | 40.7 | 3.0 |
| – Net Position: | -20,354 | 18,075 | 2,279 |
| – Gross Longs: | 38,578 | 98,500 | 8,199 |
| – Gross Shorts: | 58,932 | 80,425 | 5,920 |
| – Long to Short Ratio: | 0.7 to 1 | 1.2 to 1 | 1.4 to 1 |
| NET POSITION TREND: | |||
| – COT Index Score (3 Year Range Pct): | 78.0 | 22.7 | 55.4 |
| – COT Index Reading (3 Year Range): | Bullish | Bearish | Bullish |
| NET POSITION MOVEMENT INDEX: | |||
| – 6-Week Change in Strength Index: | 7.2 | -9.2 | 10.7 |
Natural Gas Futures :
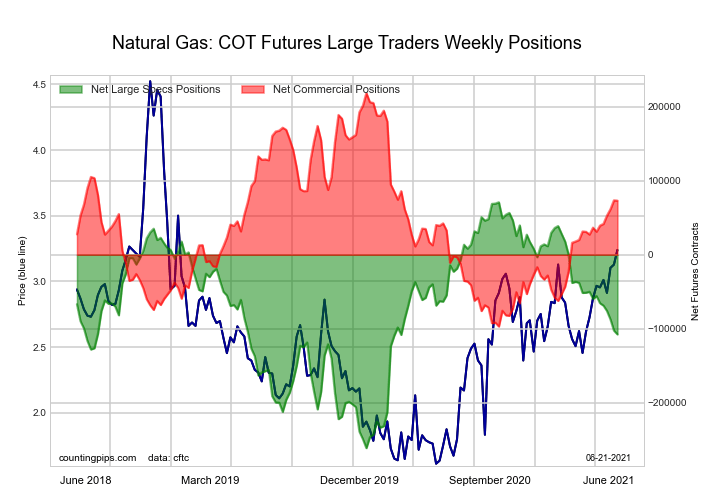 The Natural Gas Futures large speculator standing this week equaled a net position of -107,696 contracts in the data reported through Tuesday. This was a weekly lowering of -5,188 contracts from the previous week which had a total of -102,508 net contracts.
This week’s current strength score (the trader positioning range over the past three years, measured from 0 to 100) shows the speculators are currently Bearish with a score of 46.3 percent. The commercials are Bullish with a score of 53.9 percent and the small traders (not shown in chart) are Bullish with a score of 57.7 percent.
| Natural Gas Futures Statistics | SPECULATORS | COMMERCIALS | SMALL TRADERS |
| – Percent of Open Interest Longs: | 25.4 | 41.5 | 4.8 |
| – Percent of Open Interest Shorts: | 33.4 | 36.1 | 2.2 |
| – Net Position: | -107,696 | 73,175 | 34,521 |
| – Gross Longs: | 340,670 | 557,263 | 64,058 |
| – Gross Shorts: | 448,366 | 484,088 | 29,537 |
| – Long to Short Ratio: | 0.8 to 1 | 1.2 to 1 | 2.2 to 1 |
| NET POSITION TREND: | |||
| – COT Index Score (3 Year Range Pct): | 46.3 | 53.9 | 57.7 |
| – COT Index Reading (3 Year Range): | Bearish | Bullish | Bullish |
| NET POSITION MOVEMENT INDEX: | |||
| – 6-Week Change in Strength Index: | -15.6 | 13.3 | 31.4 |
Gasoline Blendstock Futures :
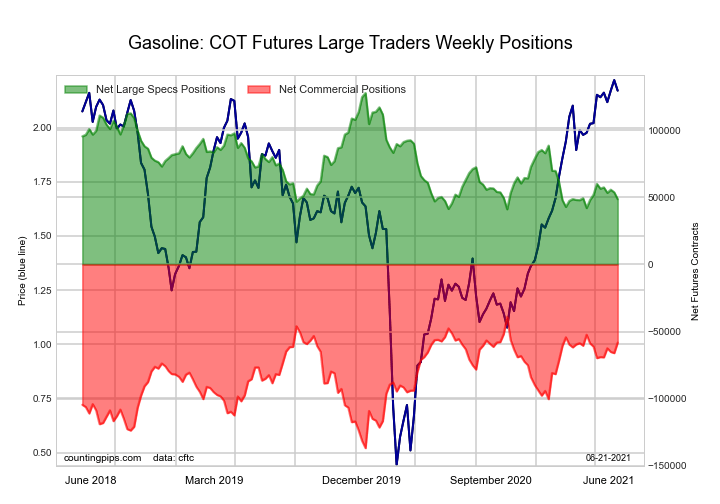 The Gasoline Blendstock Futures large speculator standing this week equaled a net position of 48,643 contracts in the data reported through Tuesday. This was a weekly decline of -5,109 contracts from the previous week which had a total of 53,752 net contracts.
This week’s current strength score (the trader positioning range over the past three years, measured from 0 to 100) shows the speculators are currently Bearish-Extreme with a score of 8.7 percent. The commercials are Bullish-Extreme with a score of 80.5 percent and the small traders (not shown in chart) are Bullish with a score of 69.3 percent.
| Nasdaq Mini Futures Statistics | SPECULATORS | COMMERCIALS | SMALL TRADERS |
| – Percent of Open Interest Longs: | 21.0 | 54.1 | 5.4 |
| – Percent of Open Interest Shorts: | 10.0 | 67.3 | 3.3 |
| – Net Position: | 48,643 | -58,304 | 9,661 |
| – Gross Longs: | 93,176 | 240,050 | 24,138 |
| – Gross Shorts: | 44,533 | 298,354 | 14,477 |
| – Long to Short Ratio: | 2.1 to 1 | 0.8 to 1 | 1.7 to 1 |
| NET POSITION TREND: | |||
| – COT Index Score (3 Year Range Pct): | 8.7 | 80.5 | 69.3 |
| – COT Index Reading (3 Year Range): | Bearish-Extreme | Bullish-Extreme | Bullish |
| NET POSITION MOVEMENT INDEX: | |||
| – 6-Week Change in Strength Index: | -13.1 | 11.8 | -0.8 |
#2 Heating Oil NY-Harbor Futures :
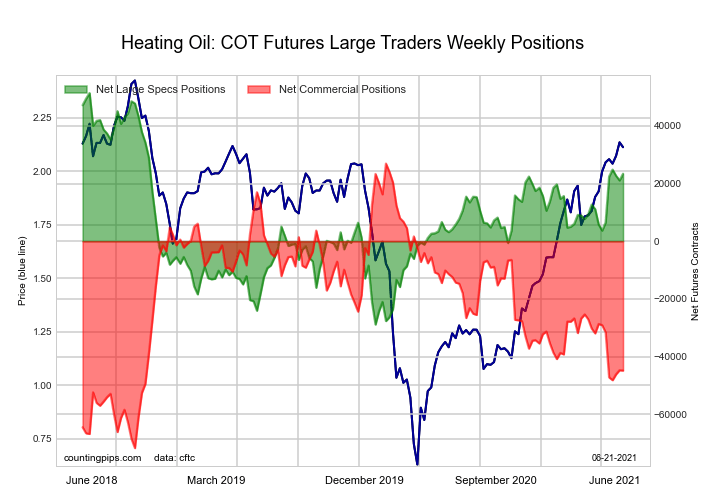 The #2 Heating Oil NY-Harbor Futures large speculator standing this week equaled a net position of 23,395 contracts in the data reported through Tuesday. This was a weekly boost of 2,308 contracts from the previous week which had a total of 21,087 net contracts.
This week’s current strength score (the trader positioning range over the past three years, measured from 0 to 100) shows the speculators are currently Bullish with a score of 65.1 percent. The commercials are Bearish with a score of 27.3 percent and the small traders (not shown in chart) are Bullish-Extreme with a score of 84.2 percent.
| Heating Oil Futures Statistics | SPECULATORS | COMMERCIALS | SMALL TRADERS |
| – Percent of Open Interest Longs: | 15.8 | 49.5 | 11.0 |
| – Percent of Open Interest Shorts: | 10.5 | 59.6 | 6.2 |
| – Net Position: | 23,395 | -44,803 | 21,408 |
| – Gross Longs: | 69,723 | 218,588 | 48,654 |
| – Gross Shorts: | 46,328 | 263,391 | 27,246 |
| – Long to Short Ratio: | 1.5 to 1 | 0.8 to 1 | 1.8 to 1 |
| NET POSITION TREND: | |||
| – COT Index Score (3 Year Range Pct): | 65.1 | 27.3 | 84.2 |
| – COT Index Reading (3 Year Range): | Bullish | Bearish | Bullish-Extreme |
| NET POSITION MOVEMENT INDEX: | |||
| – 6-Week Change in Strength Index: | 24.5 | -16.0 | -15.8 |
Bloomberg Commodity Index Futures :
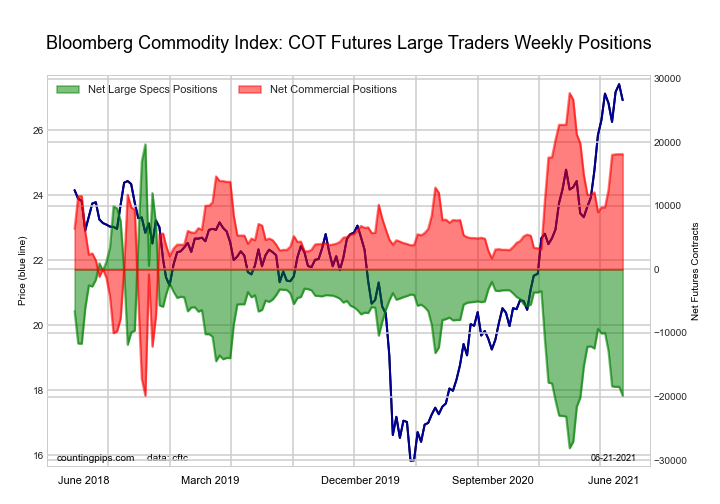 The Bloomberg Commodity Index Futures large speculator standing this week equaled a net position of -19,849 contracts in the data reported through Tuesday. This was a weekly fall of -1,398 contracts from the previous week which had a total of -18,451 net contracts.
This week’s current strength score (the trader positioning range over the past three years, measured from 0 to 100) shows the speculators are currently Bearish-Extreme with a score of 17.3 percent. The commercials are Bullish with a score of 79.8 percent and the small traders (not shown in chart) are Bullish-Extreme with a score of 100.0 percent.
| Bloomberg Index Futures Statistics | SPECULATORS | COMMERCIALS | SMALL TRADERS |
| – Percent of Open Interest Longs: | 40.7 | 40.8 | 3.4 |
| – Percent of Open Interest Shorts: | 77.3 | 7.4 | 0.2 |
| – Net Position: | -19,849 | 18,129 | 1,720 |
| – Gross Longs: | 22,141 | 22,169 | 1,848 |
| – Gross Shorts: | 41,990 | 4,040 | 128 |
| – Long to Short Ratio: | 0.5 to 1 | 5.5 to 1 | 14.4 to 1 |
| NET POSITION TREND: | |||
| – COT Index Score (3 Year Range Pct): | 17.3 | 79.8 | 100.0 |
| – COT Index Reading (3 Year Range): | Bearish-Extreme | Bullish | Bullish-Extreme |
| NET POSITION MOVEMENT INDEX: | |||
| – 6-Week Change in Strength Index: | -20.5 | 17.6 | 62.9 |
Article By CountingPips.com – Receive our weekly COT Reports by Email
*COT Report: The COT data, released weekly to the public each Friday, is updated through the most recent Tuesday (data is 3 days old) and shows a quick view of how large speculators or non-commercials (for-profit traders) were positioned in the futures markets.
The CFTC categorizes trader positions according to commercial hedgers (traders who use futures contracts for hedging as part of the business), non-commercials (large traders who speculate to realize trading profits) and nonreportable traders (usually small traders/speculators).
Find CFTC criteria here: (http://www.cftc.gov/MarketReports/CommitmentsofTraders/ExplanatoryNotes/index.htm).

- GBP/USD at Month’s Lows: The Outlook Remains Weak Jul 29, 2026
- Crude oil falls below $80 per barrel. Australia sees inflation slowdown Jul 29, 2026
- The US Tech sector hit by sell‑off. Oil prices decline on renewed negotiations Jul 28, 2026
- Gold Declines, Focus on Fed and Falling Oil Prices Jul 28, 2026
- This week will be one of the most crowded for central‑bank meetings Jul 27, 2026
- EUR/USD Ahead of a Key Week: Holding Near Lows Jul 27, 2026
- COT Metals Charts: Weekly Speculator Changes led by Copper Jul 26, 2026
- COT Bonds Charts: Speculator Bets led by SOFR 3-Months & 5-Year Bonds Jul 26, 2026
- COT Energy Charts: Weekly Speculator Bets led by WTI Crude & Natural Gas Jul 26, 2026
- COT Soft Commodities Charts: Weekly Speculator Bets led by Corn & Soybeans Jul 26, 2026