
By CountingPips.com COT Home | Data Tables | Data Downloads | Newsletter
Here are the latest charts and statistics for the Commitment of Traders (COT) data published by the Commodities Futures Trading Commission (CFTC).
The latest COT data is updated through Tuesday June 15 2021 and shows a quick view of how large traders (for-profit speculators and commercial entities) were positioned in the futures markets.
CORN Futures:
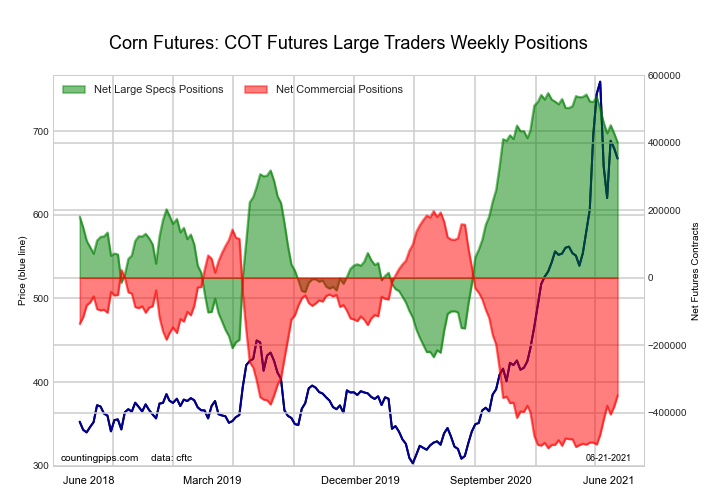 The CORN large speculator standing this week reached a net position of 401,376 contracts in the data reported through Tuesday. This was a weekly decrease of -27,052 contracts from the previous week which had a total of 428,428 net contracts.
This week’s current strength score (the trader positioning range over the past three years, measured from 0 to 100) shows the speculators are currently Bullish-Extreme with a score of 81.3 percent. The commercials are Bearish with a score of 22.2 percent and the small traders (not shown in chart) are Bearish-Extreme with a score of 6.3 percent.
| CORN Futures Statistics | SPECULATORS | COMMERCIALS | SMALL TRADERS |
| – Percent of Open Interest Longs: | 28.8 | 49.3 | 8.1 |
| – Percent of Open Interest Shorts: | 5.5 | 69.6 | 11.1 |
| – Net Position: | 401,376 | -348,905 | -52,471 |
| – Gross Longs: | 496,763 | 850,374 | 138,860 |
| – Gross Shorts: | 95,387 | 1,199,279 | 191,331 |
| – Long to Short Ratio: | 5.2 to 1 | 0.7 to 1 | 0.7 to 1 |
| NET POSITION TREND: | |||
| – COT Index Score (3 Year Range Pct): | 81.3 | 22.2 | 6.3 |
| – COT Index Reading (3 Year Range): | Bullish-Extreme | Bearish | Bearish-Extreme |
| NET POSITION MOVEMENT INDEX: | |||
| – 6-Week Change in Strength Index: | -17.2 | 20.7 | -6.5 |
Free Reports:
 Download Our Metatrader 4 Indicators – Put Our Free MetaTrader 4 Custom Indicators on your charts when you join our Weekly Newsletter
 Get our Weekly Commitment of Traders Reports - See where the biggest traders (Hedge Funds and Commercial Hedgers) are positioned in the futures markets on a weekly basis.
SUGAR Futures:
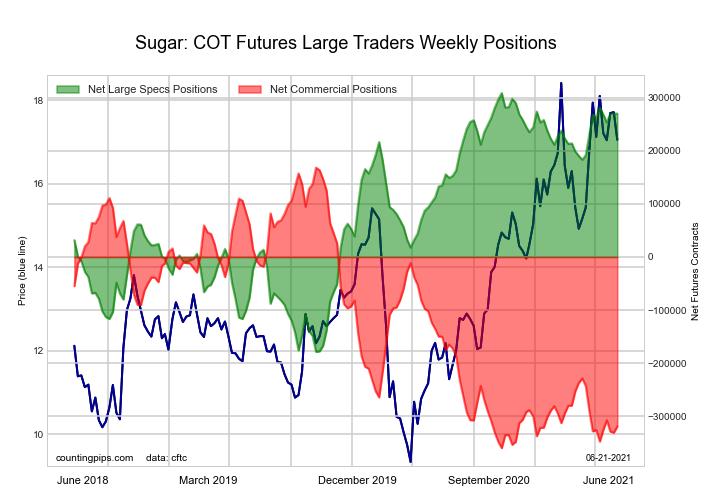 The SUGAR large speculator standing this week reached a net position of 269,661 contracts in the data reported through Tuesday. This was a weekly decrease of -448 contracts from the previous week which had a total of 270,109 net contracts.
This week’s current strength score (the trader positioning range over the past three years, measured from 0 to 100) shows the speculators are currently Bullish-Extreme with a score of 92.0 percent. The commercials are Bearish-Extreme with a score of 7.7 percent and the small traders (not shown in chart) are Bullish with a score of 68.5 percent.
| SUGAR Futures Statistics | SPECULATORS | COMMERCIALS | SMALL TRADERS |
| – Percent of Open Interest Longs: | 30.7 | 45.4 | 9.3 |
| – Percent of Open Interest Shorts: | 3.8 | 77.1 | 4.5 |
| – Net Position: | 269,661 | -318,744 | 49,083 |
| – Gross Longs: | 308,086 | 454,802 | 93,721 |
| – Gross Shorts: | 38,425 | 773,546 | 44,638 |
| – Long to Short Ratio: | 8.0 to 1 | 0.6 to 1 | 2.1 to 1 |
| NET POSITION TREND: | |||
| – COT Index Score (3 Year Range Pct): | 92.0 | 7.7 | 68.5 |
| – COT Index Reading (3 Year Range): | Bullish-Extreme | Bearish-Extreme | Bullish |
| NET POSITION MOVEMENT INDEX: | |||
| – 6-Week Change in Strength Index: | 1.4 | 1.2 | -16.3 |
COFFEE Futures:
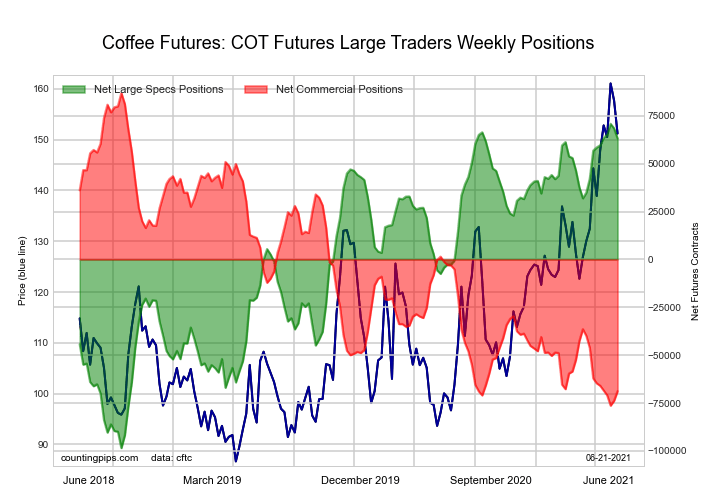 The COFFEE large speculator standing this week reached a net position of 63,152 contracts in the data reported through Tuesday. This was a weekly decline of -5,252 contracts from the previous week which had a total of 68,404 net contracts.
This week’s current strength score (the trader positioning range over the past three years, measured from 0 to 100) shows the speculators are currently Bullish-Extreme with a score of 95.5 percent. The commercials are Bearish-Extreme with a score of 4.6 percent and the small traders (not shown in chart) are Bearish with a score of 27.4 percent.
| COFFEE Futures Statistics | SPECULATORS | COMMERCIALS | SMALL TRADERS |
| – Percent of Open Interest Longs: | 30.8 | 46.6 | 4.6 |
| – Percent of Open Interest Shorts: | 8.4 | 71.0 | 2.6 |
| – Net Position: | 63,152 | -68,794 | 5,642 |
| – Gross Longs: | 86,836 | 131,304 | 12,846 |
| – Gross Shorts: | 23,684 | 200,098 | 7,204 |
| – Long to Short Ratio: | 3.7 to 1 | 0.7 to 1 | 1.8 to 1 |
| NET POSITION TREND: | |||
| – COT Index Score (3 Year Range Pct): | 95.5 | 4.6 | 27.4 |
| – COT Index Reading (3 Year Range): | Bullish-Extreme | Bearish-Extreme | Bearish |
| NET POSITION MOVEMENT INDEX: | |||
| – 6-Week Change in Strength Index: | 2.8 | -2.5 | -4.2 |
SOYBEANS Futures:
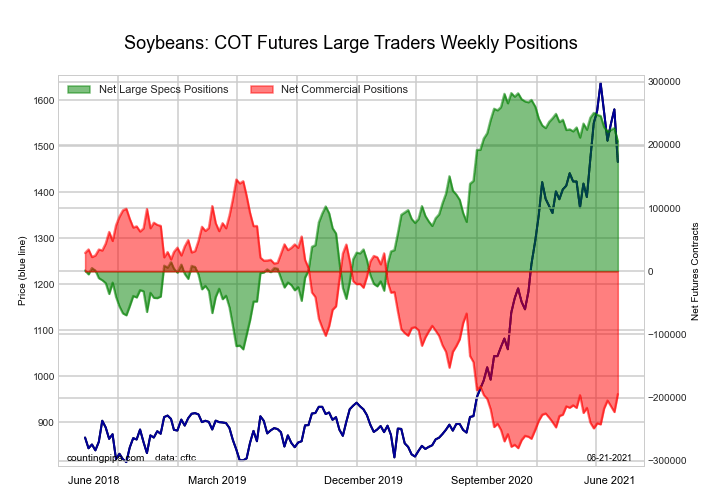 The SOYBEANS large speculator standing this week reached a net position of 205,393 contracts in the data reported through Tuesday. This was a weekly lowering of -21,295 contracts from the previous week which had a total of 226,688 net contracts.
This week’s current strength score (the trader positioning range over the past three years, measured from 0 to 100) shows the speculators are currently Bullish-Extreme with a score of 81.1 percent. The commercials are Bearish with a score of 20.1 percent and the small traders (not shown in chart) are Bullish with a score of 53.4 percent.
| SOYBEANS Futures Statistics | SPECULATORS | COMMERCIALS | SMALL TRADERS |
| – Percent of Open Interest Longs: | 33.3 | 46.0 | 7.1 |
| – Percent of Open Interest Shorts: | 7.4 | 70.6 | 8.5 |
| – Net Position: | 205,393 | -194,308 | -11,085 |
| – Gross Longs: | 263,867 | 364,252 | 56,004 |
| – Gross Shorts: | 58,474 | 558,560 | 67,089 |
| – Long to Short Ratio: | 4.5 to 1 | 0.7 to 1 | 0.8 to 1 |
| NET POSITION TREND: | |||
| – COT Index Score (3 Year Range Pct): | 81.1 | 20.1 | 53.4 |
| – COT Index Reading (3 Year Range): | Bullish-Extreme | Bearish | Bullish |
| NET POSITION MOVEMENT INDEX: | |||
| – 6-Week Change in Strength Index: | -10.4 | 10.9 | -6.9 |
SOYBEAN OIL Futures:
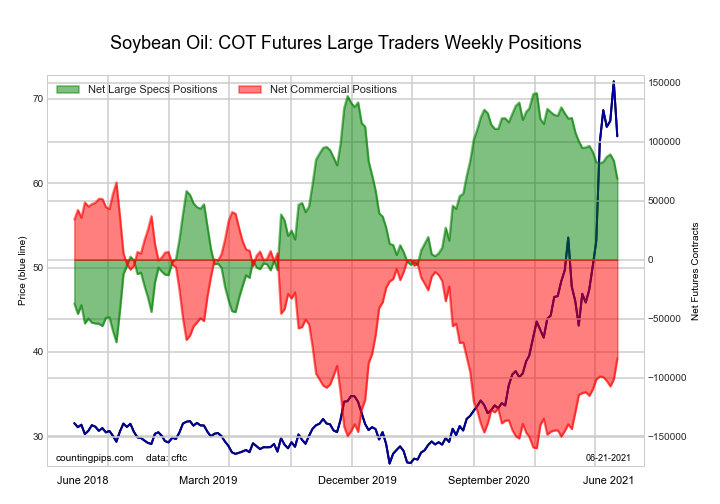 The SOYBEAN OIL large speculator standing this week reached a net position of 68,591 contracts in the data reported through Tuesday. This was a weekly decline of -15,300 contracts from the previous week which had a total of 83,891 net contracts.
This week’s current strength score (the trader positioning range over the past three years, measured from 0 to 100) shows the speculators are currently Bullish with a score of 65.6 percent. The commercials are Bearish with a score of 33.8 percent and the small traders (not shown in chart) are Bullish with a score of 68.9 percent.
| SOYBEAN OIL Futures Statistics | SPECULATORS | COMMERCIALS | SMALL TRADERS |
| – Percent of Open Interest Longs: | 20.1 | 49.8 | 7.7 |
| – Percent of Open Interest Shorts: | 7.4 | 65.2 | 5.0 |
| – Net Position: | 68,591 | -83,449 | 14,858 |
| – Gross Longs: | 108,486 | 268,913 | 41,639 |
| – Gross Shorts: | 39,895 | 352,362 | 26,781 |
| – Long to Short Ratio: | 2.7 to 1 | 0.8 to 1 | 1.6 to 1 |
| NET POSITION TREND: | |||
| – COT Index Score (3 Year Range Pct): | 65.6 | 33.8 | 68.9 |
| – COT Index Reading (3 Year Range): | Bullish | Bearish | Bullish |
| NET POSITION MOVEMENT INDEX: | |||
| – 6-Week Change in Strength Index: | -6.6 | 7.9 | -14.3 |
SOYBEAN MEAL Futures:
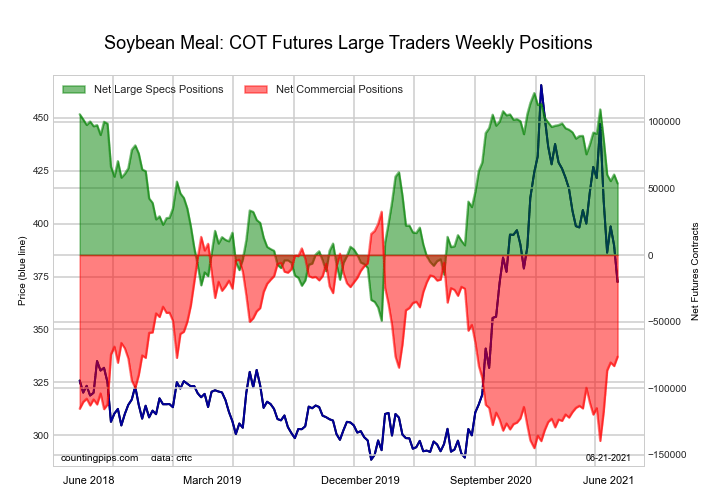 The SOYBEAN MEAL large speculator standing this week reached a net position of 53,771 contracts in the data reported through Tuesday. This was a weekly decrease of -6,651 contracts from the previous week which had a total of 60,422 net contracts.
This week’s current strength score (the trader positioning range over the past three years, measured from 0 to 100) shows the speculators are currently Bullish with a score of 60.3 percent. The commercials are Bearish with a score of 38.7 percent and the small traders (not shown in chart) are Bullish with a score of 61.2 percent.
| SOYBEAN MEAL Futures Statistics | SPECULATORS | COMMERCIALS | SMALL TRADERS |
| – Percent of Open Interest Longs: | 21.5 | 52.5 | 12.3 |
| – Percent of Open Interest Shorts: | 8.3 | 71.3 | 6.7 |
| – Net Position: | 53,771 | -76,358 | 22,587 |
| – Gross Longs: | 87,485 | 214,102 | 50,004 |
| – Gross Shorts: | 33,714 | 290,460 | 27,417 |
| – Long to Short Ratio: | 2.6 to 1 | 0.7 to 1 | 1.8 to 1 |
| NET POSITION TREND: | |||
| – COT Index Score (3 Year Range Pct): | 60.3 | 38.7 | 61.2 |
| – COT Index Reading (3 Year Range): | Bullish | Bearish | Bullish |
| NET POSITION MOVEMENT INDEX: | |||
| – 6-Week Change in Strength Index: | -21.8 | 21.8 | -5.2 |
LIVE CATTLE Futures:
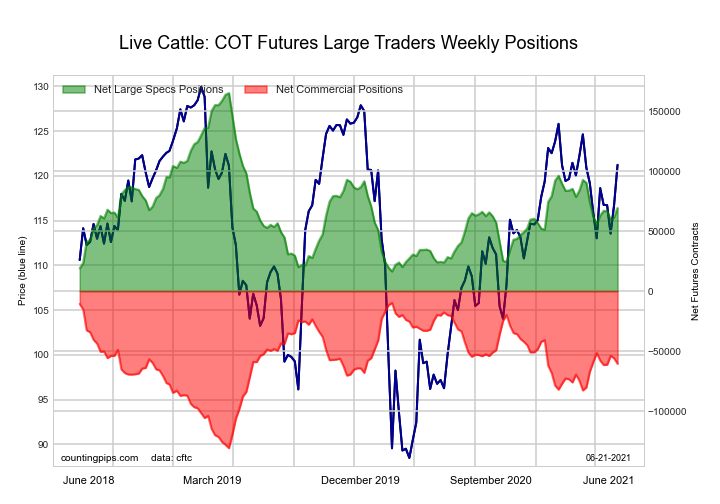 The LIVE CATTLE large speculator standing this week reached a net position of 69,321 contracts in the data reported through Tuesday. This was a weekly rise of 7,833 contracts from the previous week which had a total of 61,488 net contracts.
This week’s current strength score (the trader positioning range over the past three years, measured from 0 to 100) shows the speculators are currently Bearish with a score of 35.6 percent. The commercials are Bullish with a score of 58.1 percent and the small traders (not shown in chart) are Bullish with a score of 65.6 percent.
| LIVE CATTLE Futures Statistics | SPECULATORS | COMMERCIALS | SMALL TRADERS |
| – Percent of Open Interest Longs: | 39.5 | 39.5 | 9.2 |
| – Percent of Open Interest Shorts: | 16.2 | 59.8 | 12.1 |
| – Net Position: | 69,321 | -60,492 | -8,829 |
| – Gross Longs: | 117,766 | 117,949 | 27,397 |
| – Gross Shorts: | 48,445 | 178,441 | 36,226 |
| – Long to Short Ratio: | 2.4 to 1 | 0.7 to 1 | 0.8 to 1 |
| NET POSITION TREND: | |||
| – COT Index Score (3 Year Range Pct): | 35.6 | 58.1 | 65.6 |
| – COT Index Reading (3 Year Range): | Bearish | Bullish | Bullish |
| NET POSITION MOVEMENT INDEX: | |||
| – 6-Week Change in Strength Index: | 9.3 | -7.4 | -12.0 |
LEAN HOGS Futures:
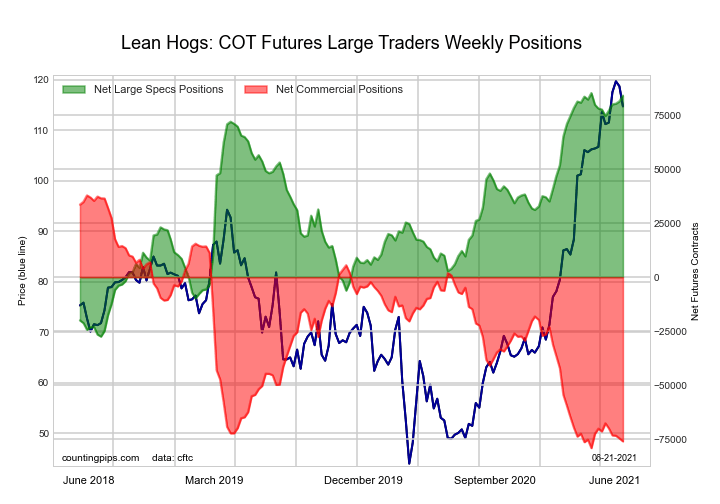 The LEAN HOGS large speculator standing this week reached a net position of 84,053 contracts in the data reported through Tuesday. This was a weekly increase of 2,690 contracts from the previous week which had a total of 81,363 net contracts.
This week’s current strength score (the trader positioning range over the past three years, measured from 0 to 100) shows the speculators are currently Bullish-Extreme with a score of 99.0 percent. The commercials are Bearish-Extreme with a score of 2.7 percent and the small traders (not shown in chart) are Bearish with a score of 39.4 percent.
| LEAN HOGS Futures Statistics | SPECULATORS | COMMERCIALS | SMALL TRADERS |
| – Percent of Open Interest Longs: | 42.5 | 29.0 | 8.7 |
| – Percent of Open Interest Shorts: | 15.2 | 53.8 | 11.3 |
| – Net Position: | 84,053 | -75,962 | -8,091 |
| – Gross Longs: | 130,607 | 89,145 | 26,564 |
| – Gross Shorts: | 46,554 | 165,107 | 34,655 |
| – Long to Short Ratio: | 2.8 to 1 | 0.5 to 1 | 0.8 to 1 |
| NET POSITION TREND: | |||
| – COT Index Score (3 Year Range Pct): | 99.0 | 2.7 | 39.4 |
| – COT Index Reading (3 Year Range): | Bullish-Extreme | Bearish-Extreme | Bearish |
| NET POSITION MOVEMENT INDEX: | |||
| – 6-Week Change in Strength Index: | 5.7 | -3.9 | -8.9 |
COTTON Futures:
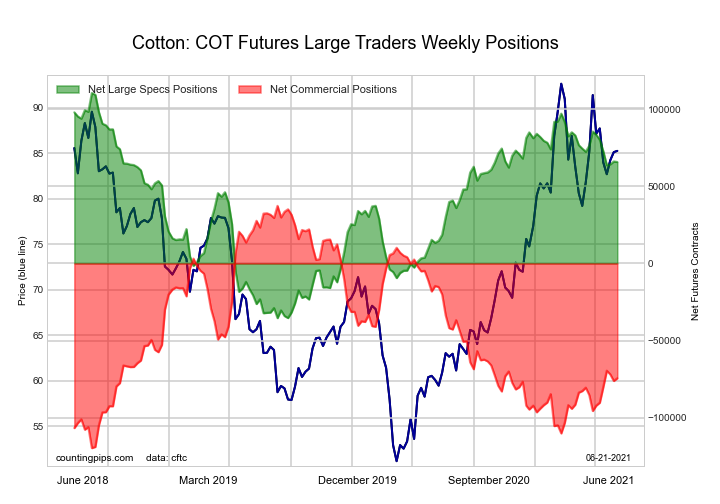 The COTTON large speculator standing this week reached a net position of 65,704 contracts in the data reported through Tuesday. This was a weekly decline of -375 contracts from the previous week which had a total of 66,079 net contracts.
This week’s current strength score (the trader positioning range over the past three years, measured from 0 to 100) shows the speculators are currently Bullish with a score of 69.4 percent. The commercials are Bearish with a score of 28.8 percent and the small traders (not shown in chart) are Bullish with a score of 68.7 percent.
| COTTON Futures Statistics | SPECULATORS | COMMERCIALS | SMALL TRADERS |
| – Percent of Open Interest Longs: | 35.5 | 45.6 | 7.6 |
| – Percent of Open Interest Shorts: | 5.1 | 80.0 | 3.6 |
| – Net Position: | 65,704 | -74,390 | 8,686 |
| – Gross Longs: | 76,708 | 98,605 | 16,395 |
| – Gross Shorts: | 11,004 | 172,995 | 7,709 |
| – Long to Short Ratio: | 7.0 to 1 | 0.6 to 1 | 2.1 to 1 |
| NET POSITION TREND: | |||
| – COT Index Score (3 Year Range Pct): | 69.4 | 28.8 | 68.7 |
| – COT Index Reading (3 Year Range): | Bullish | Bearish | Bullish |
| NET POSITION MOVEMENT INDEX: | |||
| – 6-Week Change in Strength Index: | -12.1 | 11.3 | -0.5 |
COCOA Futures:
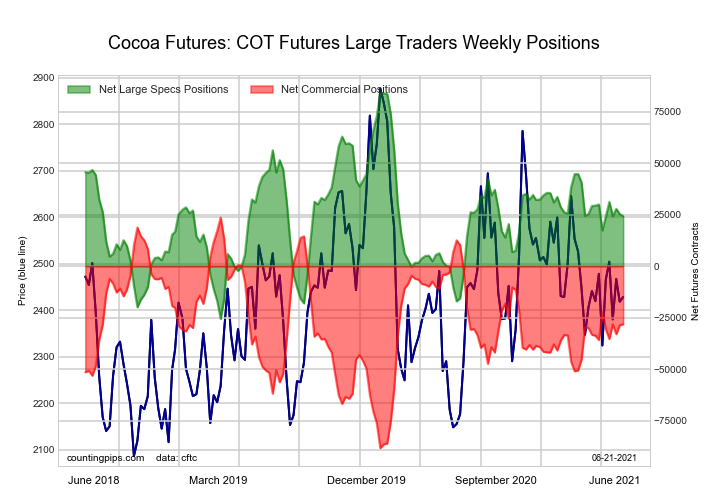 The COCOA large speculator standing this week reached a net position of 24,277 contracts in the data reported through Tuesday. This was a weekly decrease of -1,092 contracts from the previous week which had a total of 25,369 net contracts.
This week’s current strength score (the trader positioning range over the past three years, measured from 0 to 100) shows the speculators are currently Bearish with a score of 45.5 percent. The commercials are Bullish with a score of 53.7 percent and the small traders (not shown in chart) are Bullish with a score of 52.9 percent.
| COCOA Futures Statistics | SPECULATORS | COMMERCIALS | SMALL TRADERS |
| – Percent of Open Interest Longs: | 29.6 | 46.3 | 5.3 |
| – Percent of Open Interest Shorts: | 18.4 | 59.3 | 3.4 |
| – Net Position: | 24,277 | -28,186 | 3,909 |
| – Gross Longs: | 63,965 | 99,902 | 11,346 |
| – Gross Shorts: | 39,688 | 128,088 | 7,437 |
| – Long to Short Ratio: | 1.6 to 1 | 0.8 to 1 | 1.5 to 1 |
| NET POSITION TREND: | |||
| – COT Index Score (3 Year Range Pct): | 45.5 | 53.7 | 52.9 |
| – COT Index Reading (3 Year Range): | Bearish | Bullish | Bullish |
| NET POSITION MOVEMENT INDEX: | |||
| – 6-Week Change in Strength Index: | 6.3 | -5.4 | -9.1 |
WHEAT Futures:
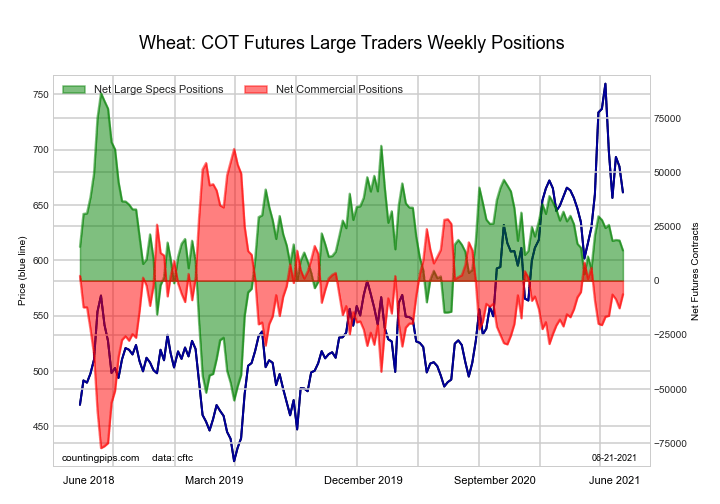 The WHEAT large speculator standing this week reached a net position of 13,948 contracts in the data reported through Tuesday. This was a weekly lowering of -4,669 contracts from the previous week which had a total of 18,617 net contracts.
This week’s current strength score (the trader positioning range over the past three years, measured from 0 to 100) shows the speculators are currently Bearish with a score of 48.8 percent. The commercials are Bullish with a score of 51.4 percent and the small traders (not shown in chart) are Bullish with a score of 64.8 percent.
| WHEAT Futures Statistics | SPECULATORS | COMMERCIALS | SMALL TRADERS |
| – Percent of Open Interest Longs: | 25.7 | 38.5 | 7.3 |
| – Percent of Open Interest Shorts: | 22.4 | 40.0 | 9.1 |
| – Net Position: | 13,948 | -6,244 | -7,704 |
| – Gross Longs: | 108,694 | 162,745 | 30,804 |
| – Gross Shorts: | 94,746 | 168,989 | 38,508 |
| – Long to Short Ratio: | 1.1 to 1 | 1.0 to 1 | 0.8 to 1 |
| NET POSITION TREND: | |||
| – COT Index Score (3 Year Range Pct): | 48.8 | 51.4 | 64.8 |
| – COT Index Reading (3 Year Range): | Bearish | Bullish | Bullish |
| NET POSITION MOVEMENT INDEX: | |||
| – 6-Week Change in Strength Index: | -9.9 | 10.3 | -0.5 |
Article By CountingPips.com – Receive our weekly COT Reports by Email
*COT Report: The COT data, released weekly to the public each Friday, is updated through the most recent Tuesday (data is 3 days old) and shows a quick view of how large speculators or non-commercials (for-profit traders) were positioned in the futures markets.
The CFTC categorizes trader positions according to commercial hedgers (traders who use futures contracts for hedging as part of the business), non-commercials (large traders who speculate to realize trading profits) and nonreportable traders (usually small traders/speculators).
Find CFTC criteria here: (http://www.cftc.gov/MarketReports/CommitmentsofTraders/ExplanatoryNotes/index.htm).

- GBP/USD at Month’s Lows: The Outlook Remains Weak Jul 29, 2026
- Crude oil falls below $80 per barrel. Australia sees inflation slowdown Jul 29, 2026
- The US Tech sector hit by sell‑off. Oil prices decline on renewed negotiations Jul 28, 2026
- Gold Declines, Focus on Fed and Falling Oil Prices Jul 28, 2026
- This week will be one of the most crowded for central‑bank meetings Jul 27, 2026
- EUR/USD Ahead of a Key Week: Holding Near Lows Jul 27, 2026
- COT Metals Charts: Weekly Speculator Changes led by Copper Jul 26, 2026
- COT Bonds Charts: Speculator Bets led by SOFR 3-Months & 5-Year Bonds Jul 26, 2026
- COT Energy Charts: Weekly Speculator Bets led by WTI Crude & Natural Gas Jul 26, 2026
- COT Soft Commodities Charts: Weekly Speculator Bets led by Corn & Soybeans Jul 26, 2026