
By CountingPips.com COT Home | Data Tables | Data Downloads | Newsletter
Here are the latest charts and statistics for the Commitment of Traders (COT) data published by the Commodities Futures Trading Commission (CFTC).
The latest COT data is updated through Tuesday June 22 2021 and shows a quick view of how large traders (for-profit speculators and commercial entities) were positioned in the futures markets.
VIX Volatility Futures Futures:
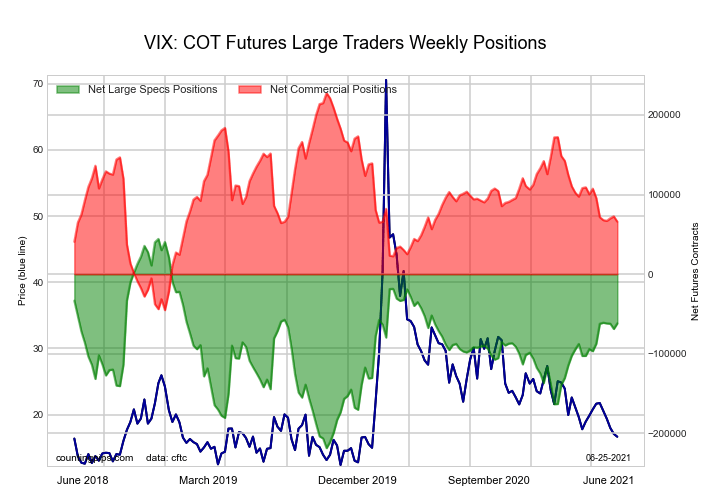 The VIX Volatility Futures large speculator standing this week totaled a net position of -61,776 contracts in the data reported through Tuesday. This was a weekly boost of 6,971 contracts from the previous week which had a total of -68,747 net contracts.
This week’s current strength score (the trader positioning range over the past three years, measured from 0 to 100) shows the speculators are currently Bullish with a score of 59.6 percent. The commercials are Bearish with a score of 40.7 percent and the small traders (not shown in chart) are Bearish with a score of 40.6 percent.
| VIX Volatility Futures Statistics | SPECULATORS | COMMERCIALS | SMALL TRADERS |
| – Percent of Open Interest Longs: | 23.1 | 49.3 | 7.0 |
| – Percent of Open Interest Shorts: | 42.5 | 28.5 | 8.3 |
| – Net Position: | -61,776 | 65,947 | -4,171 |
| – Gross Longs: | 73,154 | 156,285 | 22,256 |
| – Gross Shorts: | 134,930 | 90,338 | 26,427 |
| – Long to Short Ratio: | 0.5 to 1 | 1.7 to 1 | 0.8 to 1 |
| NET POSITION TREND: | |||
| – COT Index Score (3 Year Range Pct): | 59.6 | 40.7 | 40.6 |
| – COT Index Reading (3 Year Range): | Bullish | Bearish | Bearish |
| NET POSITION MOVEMENT INDEX: | |||
| – 6-Week Change in Strength Index: | 9.7 | -10.9 | 15.7 |
Free Reports:
 Get our Weekly Commitment of Traders Reports - See where the biggest traders (Hedge Funds and Commercial Hedgers) are positioned in the futures markets on a weekly basis.
 Sign Up for Our Stock Market Newsletter – Get updated on News, Charts & Rankings of Public Companies when you join our Stocks Newsletter
S&P500 Mini Futures Futures:
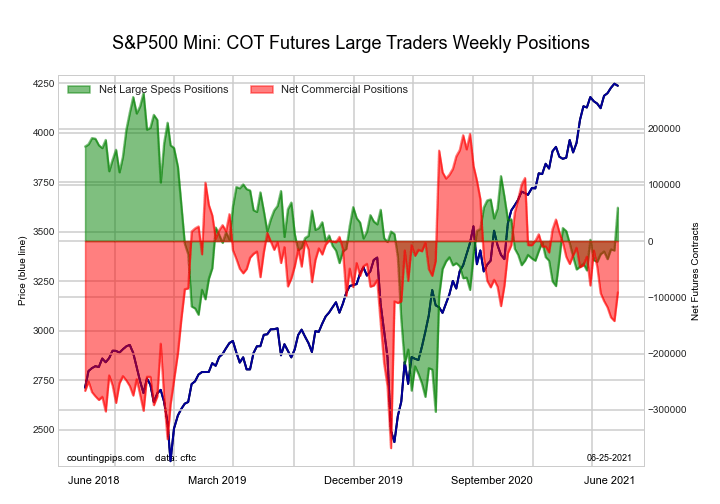 The S&P500 Mini Futures large speculator standing this week totaled a net position of 59,335 contracts in the data reported through Tuesday. This was a weekly increase of 75,998 contracts from the previous week which had a total of -16,663 net contracts.
This week’s current strength score (the trader positioning range over the past three years, measured from 0 to 100) shows the speculators are currently Bullish with a score of 64.0 percent. The commercials are Bearish with a score of 49.5 percent and the small traders (not shown in chart) are Bearish with a score of 33.1 percent.
| S&P500 Mini Futures Statistics | SPECULATORS | COMMERCIALS | SMALL TRADERS |
| – Percent of Open Interest Longs: | 14.2 | 72.9 | 10.5 |
| – Percent of Open Interest Shorts: | 11.9 | 76.5 | 9.2 |
| – Net Position: | 59,335 | -91,331 | 31,996 |
| – Gross Longs: | 364,240 | 1,869,036 | 268,915 |
| – Gross Shorts: | 304,905 | 1,960,367 | 236,919 |
| – Long to Short Ratio: | 1.2 to 1 | 1.0 to 1 | 1.1 to 1 |
| NET POSITION TREND: | |||
| – COT Index Score (3 Year Range Pct): | 64.0 | 49.5 | 33.1 |
| – COT Index Reading (3 Year Range): | Bullish | Bearish | Bearish |
| NET POSITION MOVEMENT INDEX: | |||
| – 6-Week Change in Strength Index: | 17.0 | -8.3 | -10.5 |
Dow Jones Mini Futures Futures:
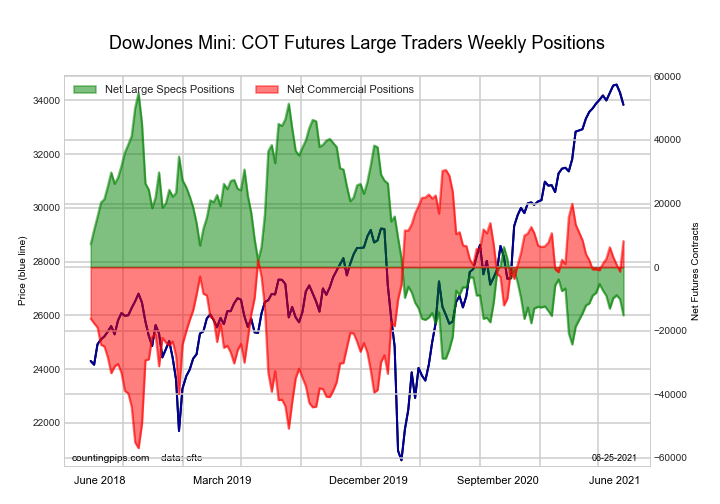 The Dow Jones Mini Futures large speculator standing this week totaled a net position of -15,147 contracts in the data reported through Tuesday. This was a weekly fall of -5,058 contracts from the previous week which had a total of -10,089 net contracts.
This week’s current strength score (the trader positioning range over the past three years, measured from 0 to 100) shows the speculators are currently Bearish-Extreme with a score of 16.3 percent. The commercials are Bullish with a score of 74.4 percent and the small traders (not shown in chart) are Bullish with a score of 75.6 percent.
| Dow Jones Mini Futures Statistics | SPECULATORS | COMMERCIALS | SMALL TRADERS |
| – Percent of Open Interest Longs: | 27.2 | 51.0 | 17.3 |
| – Percent of Open Interest Shorts: | 41.9 | 43.0 | 10.5 |
| – Net Position: | -15,147 | 8,207 | 6,940 |
| – Gross Longs: | 27,861 | 52,334 | 17,758 |
| – Gross Shorts: | 43,008 | 44,127 | 10,818 |
| – Long to Short Ratio: | 0.6 to 1 | 1.2 to 1 | 1.6 to 1 |
| NET POSITION TREND: | |||
| – COT Index Score (3 Year Range Pct): | 16.3 | 74.4 | 75.6 |
| – COT Index Reading (3 Year Range): | Bearish-Extreme | Bullish | Bullish |
| NET POSITION MOVEMENT INDEX: | |||
| – 6-Week Change in Strength Index: | -9.3 | 8.1 | 3.9 |
Nasdaq Mini Futures Futures:
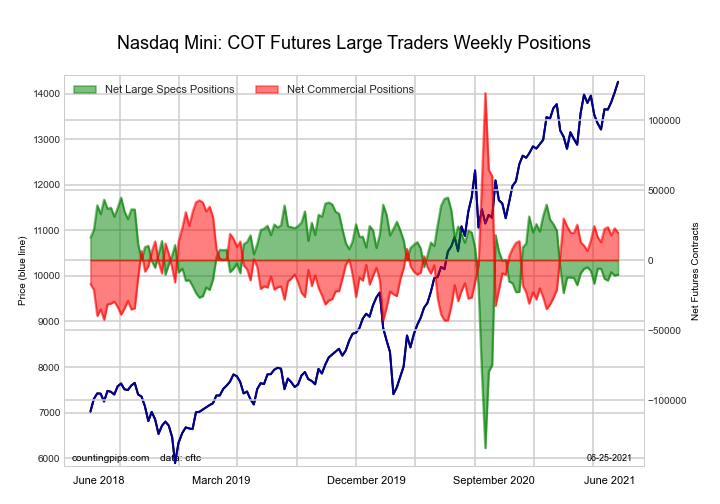 The Nasdaq Mini Futures large speculator standing this week totaled a net position of -10,365 contracts in the data reported through Tuesday. This was a weekly rise of 669 contracts from the previous week which had a total of -11,034 net contracts.
This week’s current strength score (the trader positioning range over the past three years, measured from 0 to 100) shows the speculators are currently Bullish with a score of 69.2 percent. The commercials are Bearish with a score of 38.5 percent and the small traders (not shown in chart) are Bearish with a score of 23.5 percent.
| Nasdaq Mini Futures Statistics | SPECULATORS | COMMERCIALS | SMALL TRADERS |
| – Percent of Open Interest Longs: | 26.3 | 57.1 | 15.5 |
| – Percent of Open Interest Shorts: | 30.9 | 48.4 | 19.5 |
| – Net Position: | -10,365 | 19,496 | -9,131 |
| – Gross Longs: | 58,747 | 127,857 | 34,576 |
| – Gross Shorts: | 69,112 | 108,361 | 43,707 |
| – Long to Short Ratio: | 0.9 to 1 | 1.2 to 1 | 0.8 to 1 |
| NET POSITION TREND: | |||
| – COT Index Score (3 Year Range Pct): | 69.2 | 38.5 | 23.5 |
| – COT Index Reading (3 Year Range): | Bullish | Bearish | Bearish |
| NET POSITION MOVEMENT INDEX: | |||
| – 6-Week Change in Strength Index: | -2.4 | 1.9 | 2.9 |
Russell 2000 Mini Futures Futures:
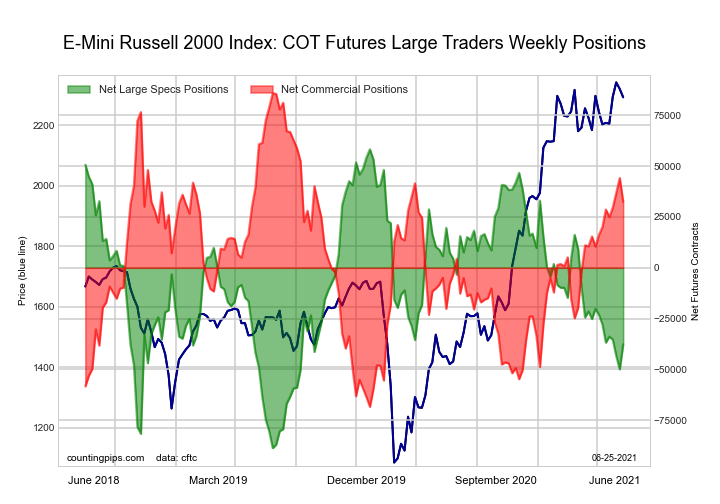 The Russell 2000 Mini Futures large speculator standing this week totaled a net position of -37,648 contracts in the data reported through Tuesday. This was a weekly gain of 12,319 contracts from the previous week which had a total of -49,967 net contracts.
This week’s current strength score (the trader positioning range over the past three years, measured from 0 to 100) shows the speculators are currently Bearish with a score of 34.7 percent. The commercials are Bullish with a score of 65.3 percent and the small traders (not shown in chart) are Bearish with a score of 47.8 percent.
| Russell 2000 Mini Futures Statistics | SPECULATORS | COMMERCIALS | SMALL TRADERS |
| – Percent of Open Interest Longs: | 12.1 | 81.0 | 6.2 |
| – Percent of Open Interest Shorts: | 21.1 | 73.1 | 5.0 |
| – Net Position: | -37,648 | 32,439 | 5,209 |
| – Gross Longs: | 50,033 | 335,769 | 25,858 |
| – Gross Shorts: | 87,681 | 303,330 | 20,649 |
| – Long to Short Ratio: | 0.6 to 1 | 1.1 to 1 | 1.3 to 1 |
| NET POSITION TREND: | |||
| – COT Index Score (3 Year Range Pct): | 34.7 | 65.3 | 47.8 |
| – COT Index Reading (3 Year Range): | Bearish | Bullish | Bearish |
| NET POSITION MOVEMENT INDEX: | |||
| – 6-Week Change in Strength Index: | -6.7 | 8.0 | -7.2 |
Nikkei Stock Average (USD) Futures Futures:
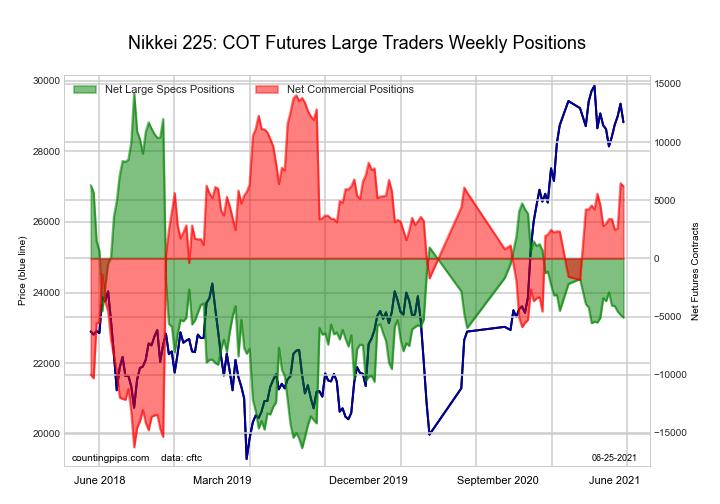 The Nikkei Stock Average (USD) Futures large speculator standing this week totaled a net position of -5,081 contracts in the data reported through Tuesday. This was a weekly lowering of -233 contracts from the previous week which had a total of -4,848 net contracts.
This week’s current strength score (the trader positioning range over the past three years, measured from 0 to 100) shows the speculators are currently Bearish with a score of 36.8 percent. The commercials are Bullish with a score of 74.1 percent and the small traders (not shown in chart) are Bearish-Extreme with a score of 5.8 percent.
| Nikkei Stock Average Futures Statistics | SPECULATORS | COMMERCIALS | SMALL TRADERS |
| – Percent of Open Interest Longs: | 14.7 | 60.4 | 24.8 |
| – Percent of Open Interest Shorts: | 46.5 | 21.6 | 31.8 |
| – Net Position: | -5,081 | 6,200 | -1,119 |
| – Gross Longs: | 2,352 | 9,651 | 3,965 |
| – Gross Shorts: | 7,433 | 3,451 | 5,084 |
| – Long to Short Ratio: | 0.3 to 1 | 2.8 to 1 | 0.8 to 1 |
| NET POSITION TREND: | |||
| – COT Index Score (3 Year Range Pct): | 36.8 | 74.1 | 5.8 |
| – COT Index Reading (3 Year Range): | Bearish | Bullish | Bearish-Extreme |
| NET POSITION MOVEMENT INDEX: | |||
| – 6-Week Change in Strength Index: | -4.7 | 10.6 | -20.9 |
MSCI EAFE Mini Futures Futures:
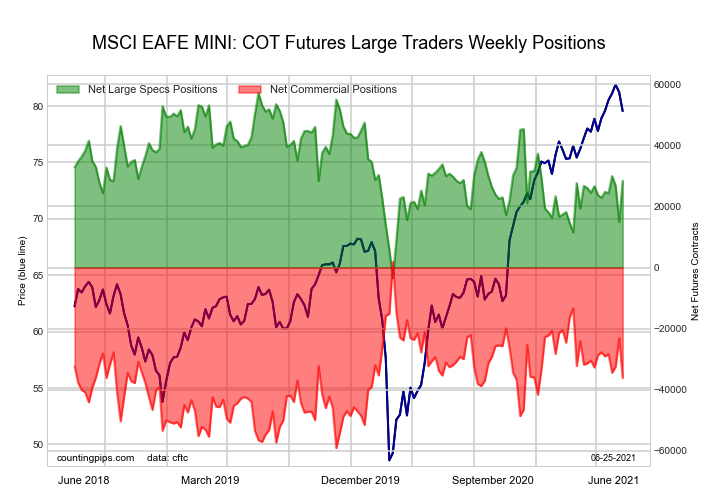 The MSCI EAFE Mini Futures large speculator standing this week totaled a net position of 28,409 contracts in the data reported through Tuesday. This was a weekly lift of 13,479 contracts from the previous week which had a total of 14,930 net contracts.
This week’s current strength score (the trader positioning range over the past three years, measured from 0 to 100) shows the speculators are currently Bullish with a score of 52.5 percent. The commercials are Bearish with a score of 37.7 percent and the small traders (not shown in chart) are Bullish-Extreme with a score of 86.5 percent.
| MSCI EAFE Mini Futures Statistics | SPECULATORS | COMMERCIALS | SMALL TRADERS |
| – Percent of Open Interest Longs: | 9.9 | 87.0 | 2.8 |
| – Percent of Open Interest Shorts: | 3.0 | 95.8 | 0.9 |
| – Net Position: | 28,409 | -36,178 | 7,769 |
| – Gross Longs: | 40,821 | 357,365 | 11,607 |
| – Gross Shorts: | 12,412 | 393,543 | 3,838 |
| – Long to Short Ratio: | 3.3 to 1 | 0.9 to 1 | 3.0 to 1 |
| NET POSITION TREND: | |||
| – COT Index Score (3 Year Range Pct): | 52.5 | 37.7 | 86.5 |
| – COT Index Reading (3 Year Range): | Bullish | Bearish | Bullish-Extreme |
| NET POSITION MOVEMENT INDEX: | |||
| – 6-Week Change in Strength Index: | 9.2 | -13.8 | 25.9 |
MSCI Emerging Mkts Mini Futures Futures:
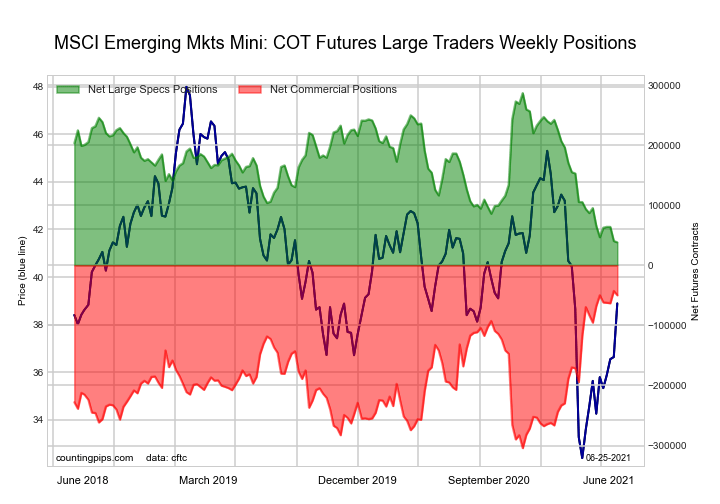 The MSCI Emerging Mkts Mini Futures large speculator standing this week totaled a net position of 38,211 contracts in the data reported through Tuesday. This was a weekly decrease of -2,219 contracts from the previous week which had a total of 40,430 net contracts.
This week’s current strength score (the trader positioning range over the past three years, measured from 0 to 100) shows the speculators are currently Bearish-Extreme with a score of 0.0 percent. The commercials are Bullish-Extreme with a score of 97.2 percent and the small traders (not shown in chart) are Bearish with a score of 40.4 percent.
| MSCI Emerging Mkts Mini Futures Statistics | SPECULATORS | COMMERCIALS | SMALL TRADERS |
| – Percent of Open Interest Longs: | 14.3 | 82.2 | 2.4 |
| – Percent of Open Interest Shorts: | 11.0 | 86.5 | 1.3 |
| – Net Position: | 38,211 | -49,886 | 11,675 |
| – Gross Longs: | 165,150 | 950,685 | 27,250 |
| – Gross Shorts: | 126,939 | 1,000,571 | 15,575 |
| – Long to Short Ratio: | 1.3 to 1 | 1.0 to 1 | 1.7 to 1 |
| NET POSITION TREND: | |||
| – COT Index Score (3 Year Range Pct): | 0.0 | 97.2 | 40.4 |
| – COT Index Reading (3 Year Range): | Bearish-Extreme | Bullish-Extreme | Bearish |
| NET POSITION MOVEMENT INDEX: | |||
| – 6-Week Change in Strength Index: | -11.0 | 6.8 | 7.3 |
Article By CountingPips.com – Receive our weekly COT Reports by Email
*COT Report: The COT data, released weekly to the public each Friday, is updated through the most recent Tuesday (data is 3 days old) and shows a quick view of how large speculators or non-commercials (for-profit traders) were positioned in the futures markets.
The CFTC categorizes trader positions according to commercial hedgers (traders who use futures contracts for hedging as part of the business), non-commercials (large traders who speculate to realize trading profits) and nonreportable traders (usually small traders/speculators).
Find CFTC criteria here: (http://www.cftc.gov/MarketReports/CommitmentsofTraders/ExplanatoryNotes/index.htm).

- GBP/USD at Month’s Lows: The Outlook Remains Weak Jul 29, 2026
- Crude oil falls below $80 per barrel. Australia sees inflation slowdown Jul 29, 2026
- The US Tech sector hit by sell‑off. Oil prices decline on renewed negotiations Jul 28, 2026
- Gold Declines, Focus on Fed and Falling Oil Prices Jul 28, 2026
- This week will be one of the most crowded for central‑bank meetings Jul 27, 2026
- EUR/USD Ahead of a Key Week: Holding Near Lows Jul 27, 2026
- COT Metals Charts: Weekly Speculator Changes led by Copper Jul 26, 2026
- COT Bonds Charts: Speculator Bets led by SOFR 3-Months & 5-Year Bonds Jul 26, 2026
- COT Energy Charts: Weekly Speculator Bets led by WTI Crude & Natural Gas Jul 26, 2026
- COT Soft Commodities Charts: Weekly Speculator Bets led by Corn & Soybeans Jul 26, 2026