By JustMarkets
The EUR/USD currency pair
- Prev Open: 1.0073
- Prev Close: 0.9964
- % chg. over the last day: -1.01 %
The European Central Bank has increased the interest rate by 0.75%. As a result of this step, the refinancing rate reached 2%. This is the most massive rate hike in the history of the ECB. In addition to the expected rate hike, the ECB also announced changes to the target long-term refinancing (TLTRO) operations in terms of the applied interest rate and earlier repayment dates. On the other hand, the balance sheet reduction was postponed until the December meeting.
- Support levels: 0.9969, 0.9897, 0.9873, 0.9835, 0.9755, 0.9601
- Resistance levels: 1.0054, 1.0111, 1.0162, 1.0230
From the technical point of view, the trend on the EUR/USD currency pair on the hourly time frame is bullish. The price began a corrective movement and fell below the moving lines. The MACD indicator is in the negative zone, but sellers’ pressure is weak. Under such market conditions, buy trades should be considered from the support level of 0.9969 or 0.0897, but with additional confirmation in the form of reverse initiative. Sell deals can be considered from the resistance level of 1.0054, but also with confirmation.
Alternative scenario: if the price breaks down through the support level of 0.9834 and fixes below it, the downtrend will likely resume.

- – Eurozone French GDP (m/m) at 08:30 (GMT+3);
- – Eurozone French CPI (m/m) at 09:45 (GMT+3);
- – Eurozone Spanish GDP (m/m) at 10:00 (GMT+3);
- – Eurozone Spanish CPI (m/m) at 10:00 (GMT+3);
- – Eurozone Italian CPI (m/m) at 12:00 (GMT+3);
- – Eurozone German GDP (m/m) at 11:00 (GMT+3);
- – Eurozone German CPI (m/m) at 15:00 (GMT+3);
- – US PCE Price index (m/m) at 15:30 (GMT+3);
- – US Michigan Consumer Sentiment (m/m) at 17:00 (GMT+3);
- – US Pending Home Sales (m/m) at 17:00 (GMT+3).
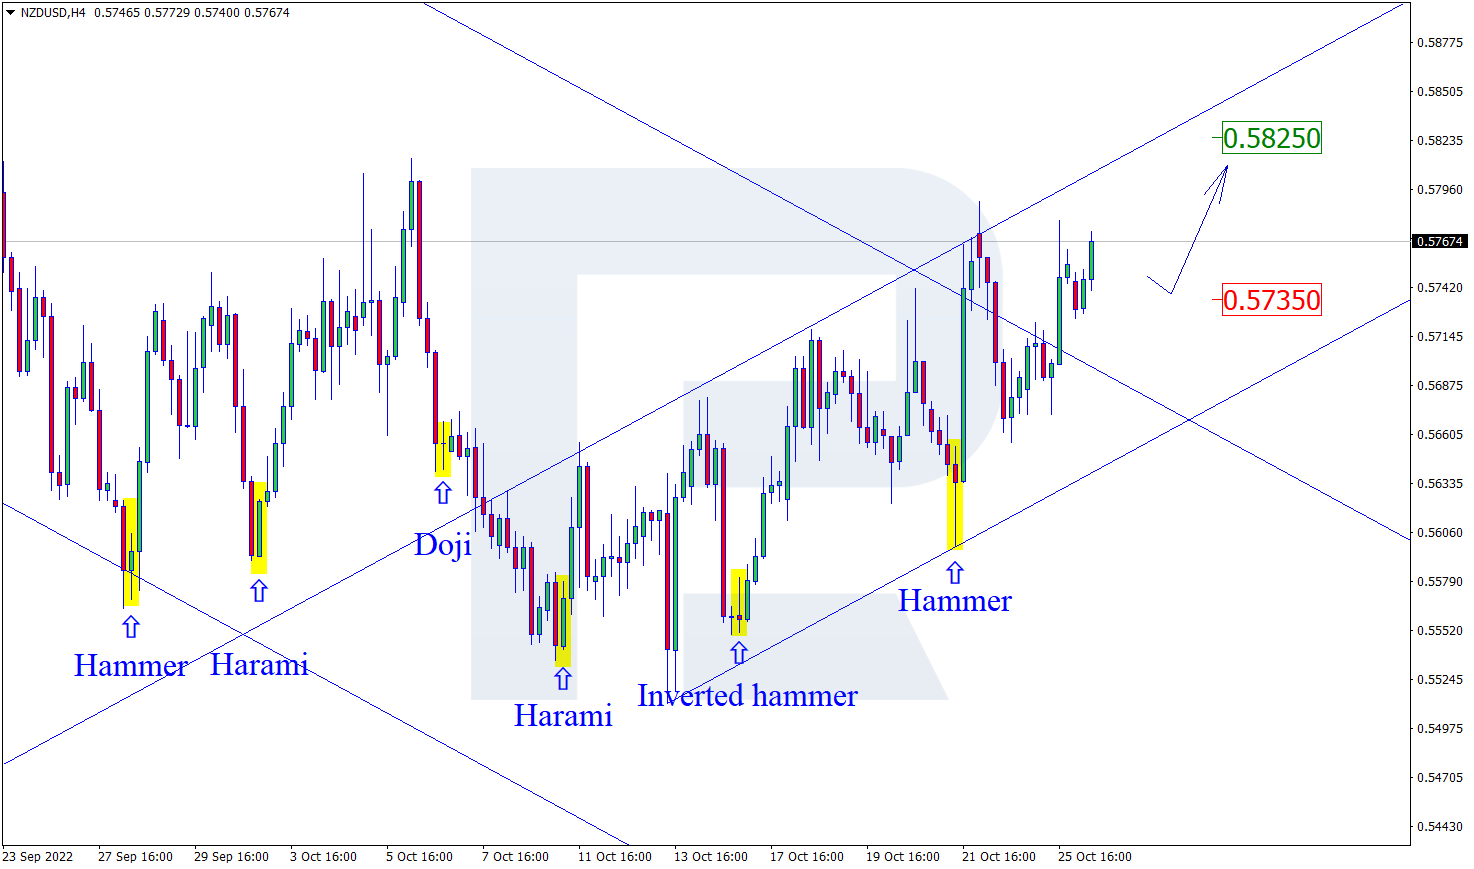
The GBP/USD currency pair
- Prev Open: 1.1611
- Prev Close: 1.1557
- % chg. over the last day: -0.47 %
The British pound is firmer than the euro right now. Investors’ confidence in the “pound” is returning amid serious preparations of the new government to form a new budget and a plan to get out of recession. Most likely, it will be achieved by cutting government spending, which will increase unemployment. However, this step is necessary because otherwise, the British economy will have a lot more problems in the form of further reduction of production, business activity, and the real estate market to recession levels.
- Support levels: 1.1467, 1.1338, 1.1172, 1.1093, 1.0915, 1.0817
- Resistance levels: 1.1698, 1.1816, 1.1901
From the technical point of view, the trend on the GBP/USD currency pair on the hourly time frame is bullish. The price is trading at the level of the moving averages. The MACD indicator has become inactive, and the buyers’ pressure remains, but now the price is correcting. Under such market conditions, buy trades can be considered from the support level of 1.1467 or 1.1337, but better after confirmation. Sell trades are best to look for on intraday time frames. The nearest resistance level is 1.1698, but also better with confirmation in the form of a reverse initiative.
Alternative scenario: if the price breaks down of the 1.1172 support level and fixes below it, the downtrend will likely resume.

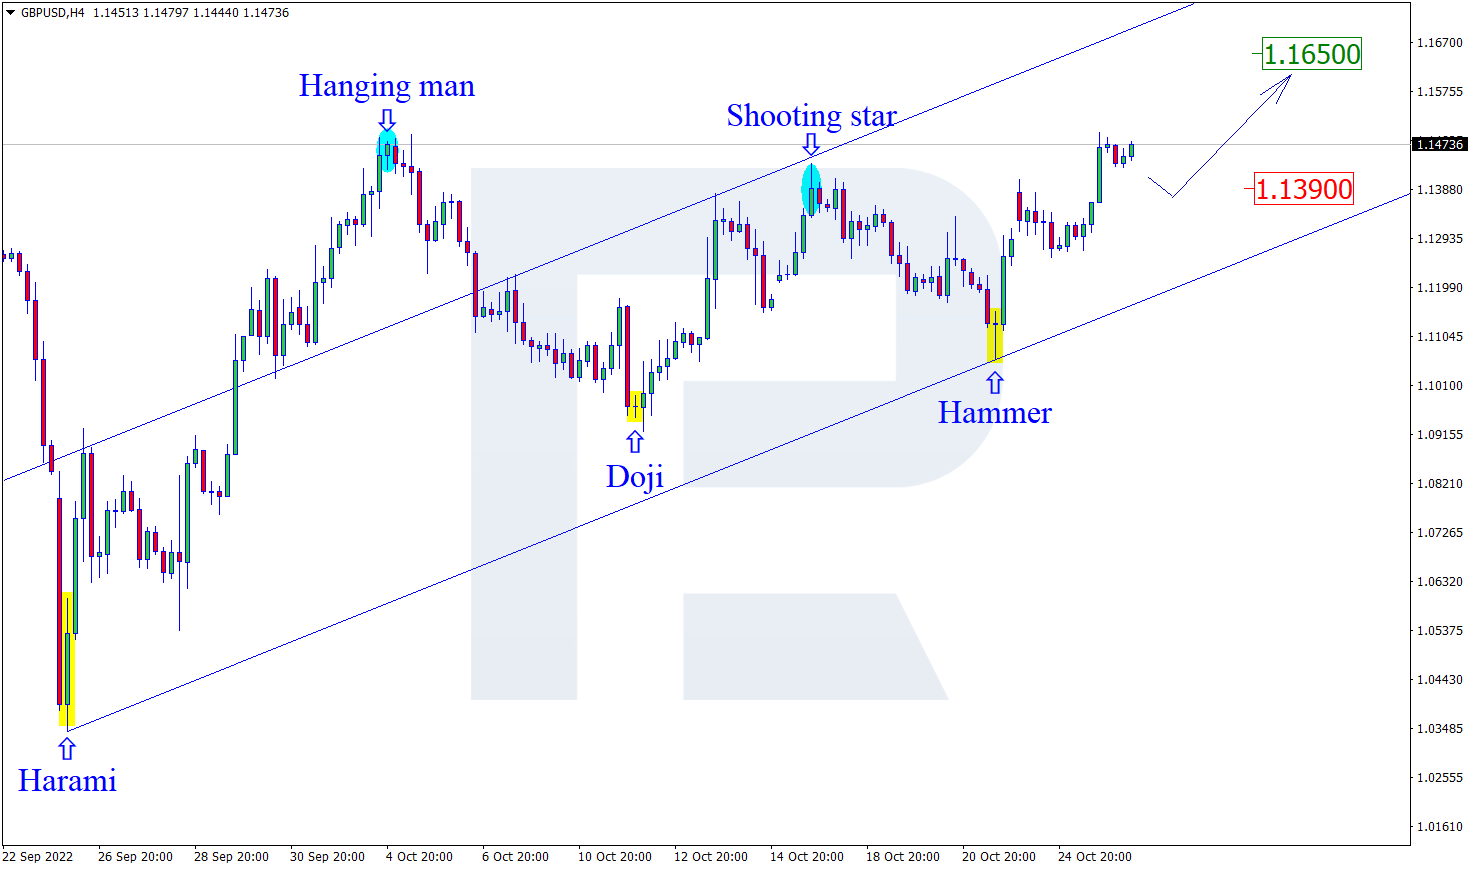
The USD/JPY currency pair
- Prev Open: 146.32
- Prev Close: 146.26
- % chg. over the last day: -0.04 %
The Japanese yen hit a 3-week high ahead of the Bank of Japan meeting. Currency intervention and weakness in the dollar helped the yen strengthen temporarily. Nevertheless, the Bank of Japan held another interest rate meeting today and maintained its super soft policy to support the fragile economy. That is the reason why analysts are skeptical about strengthening the yen, as the US Fed is still in a tightening cycle, while the BoJ has left policy unchanged.
- Support levels: 144.91, 144.19, 143.00
- Resistance levels: 148.79, 147.75, 148.64, 148.64, 150.00, 151.05
From the technical point of view, the medium-term trend on the currency pair USD/JPY has changed to bearish. The price is trading at the level of the moving averages. The MACD indicator has become inactive, and there is a slight buying pressure. Under such market conditions, buy trades can be sought on intraday time frames from the support level of 145.88 or 144.90. Sell deals can be searched from the 147.75 resistance level, but only with additional confirmation. The level of 146.79 has already been tested twice and is likely to be broken by the price.
Alternative scenario: If the price fixes above 150.00, the uptrend will likely resume.

- – Japan Unemployment Rate (m/m) at 02:30 (GMT+3);
- – Japan Tokyo Core CPI (m/m) at 02:30 (GMT+3);
- – Japan BoJ Interest Rate Decision at 06:00 (GMT+3);
- – Japan BoJ Monetary Policy Statement at 06:00 (GMT+3);
- – Japan BoJ Outlook Report at 06:00 (GMT+3);
- – Japan BoJ Press Conference (Tentative).
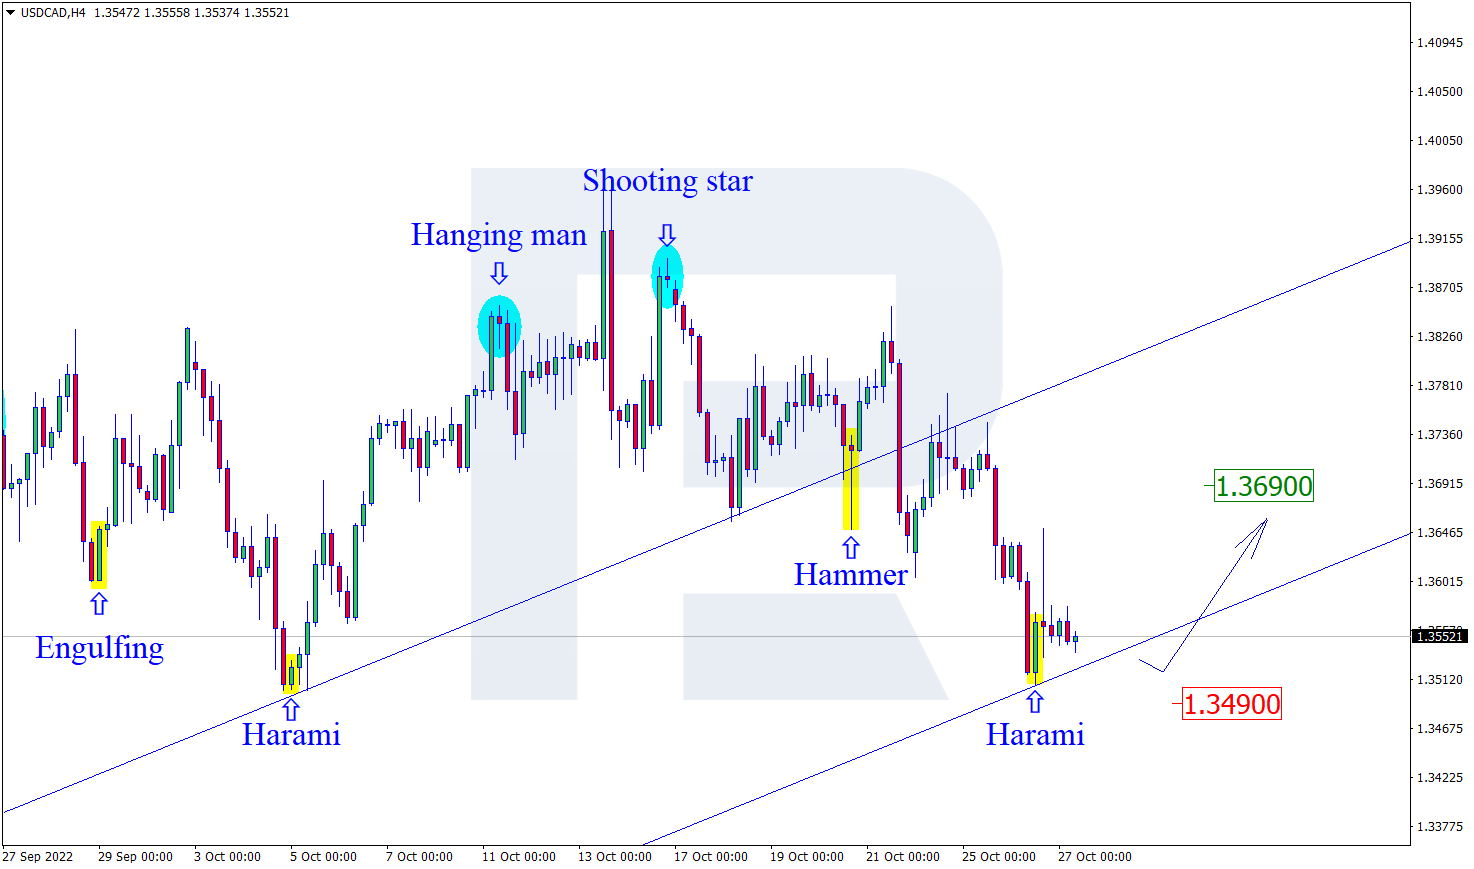
The USD/CAD currency pair
- Prev Open: 1.3559
- Prev Close: 1.3565
- % chg. over the last day: +0.04 %
The Canadian dollar is a commodity currency and depends not only on the monetary policy of the Bank of Canada but also on the performance of the dollar index and oil prices. The dollar index strengthened yesterday while oil prices also continued to grow. As a result, the Canadian dollar is trading in a narrow range, as it was affected by two opposing factors. Overall, the outlook for oil remains on the upside, while the dollar index is fundamentally close to a reversal. In the medium term, USD/CAD quotes may decline significantly.
- Support levels: 1.3541, 1.35000, 1.3454
- Resistance levels: 1.3597, 1.3678, 1.3795, 1.3855, 1.3968
From the point of view of technical analysis, the trend on the USD/CAD currency pair is bearish. The price is trading at the level of the moving averages. The MACD indicator is in the negative zone, but there is a divergence, indicating the sellers’ weakness. The best way to sell is to consider the resistance level of 1.3678, but only after additional confirmation in the form of a reverse initiative. Buy trades should be considered on the lower time frames from the support level of 1.3541, but it is better after confirmation.
Alternative scenario: if the price breaks out and consolidates above the resistance level of 1.3855, the uptrend will likely resume.

- – Canada GDP (m/m) at 15:30 (GMT+3).
By JustMarkets
This article reflects a personal opinion and should not be interpreted as an investment advice, and/or offer, and/or a persistent request for carrying out financial transactions, and/or a guarantee, and/or a forecast of future events.