Archive for Forex and Currency News – Page 93

Pound, bonds to judge if UK Autumn Statement restores market credibility

By George Prior

The movement of the pound and bonds on Thursday will be the first major economic test of Prime Minister Rishi Sunak’s government as UK inflation accelerates to a 41-year high of 11.1%.

The reaction by markets could prove to be instrumental in the PM’s longer-term leadership success, says the CEO of one of the world’s largest independent financial advisory organizations.

The comments from Nigel Green, chief executive of deVere Group, come ahead of Chancellor of the Exchequer Jeremy Hunt delivering the Autumn statement, – a Budget in all but name.

He says: “Hunt has the difficult job of trying to plug a gaping hole in the UK’s finances – reportedly £50 billion – and to tame inflation which is now running at a 41-year high, without pushing the economy battling into the abyss of a painful recession.

“With Prime Minister Rishi Sunak’s backing, he will use the Autumn Statement to set out an agenda to raise taxes and squeeze public spending.”

The deVere CEO continues: “However, arguably one of the most critical things Hunt has to try and achieve is to get the markets on-side and restore credibility and stability.

“Financial markets are unforgiving — as we saw after Liz Truss’s disastrous mini-budget when the pound hit historic lows against the dollar, gilt yields jumped, and stock markets fell due to reckless economic policies.

“The reaction of the pound and the bond market on Thursday will be seen as a critical test on whether Hunt and Sunak have got the agenda right.

“Liz Truss was forced to quit largely because she got on the wrong side of bond markets, which sets the rate at the government can borrow money to fund all the things it needs to do.

“If the pound rallies and the cost of government borrowing falls it will be a win for Sunak’s government.”

But with the intensifying cost of living crisis and screaming headlines about 11.1% inflation, what might please financial markets, might not be good for political careers and voters.

“Hunt and Sunak are walking a fine line,” says Nigel Green. “There’s a long history of financial markets flexing their muscle in politics and Thursday is another key test for the government and how the Conservatives will be viewed at the next election, likely in two years from now.”

He concludes: “The Chancellor’s Autumn Statement will instantly be judged by the value of the pound and gilt yields.

“It could also determine the fate of this government in two years’ time by voters.”

About:

deVere Group is one of the world’s largest independent advisors of specialist global financial solutions to international, local mass affluent, and high-net-worth clients.  It has a network of more than 70 offices across the world, over 80,000 clients and $12bn under advisement.


The Analytical Overview of the Main Currency Pairs on 2022.11.15

By JustMarkets

The EUR/USD currency pair

Technical indicators of the currency pair:
  • Prev Open: 1.0334
  • Prev Close: 1.0325
  • % chg. over the last day: -0.09 %

The euro is expected to gain upward momentum this week when the European Central Bank announces early repayment of so-called TLTRO loans by Eurozone banks, leading to tighter financial conditions in regional markets by depleting excess liquidity. ECB Vice President Luis de Guindos, who oversees financial stability analysis at the ECB, echoed officials’ current mantra yesterday about inflation risks and the need to keep raising interest rates. His remarks focused on how market and liquidity threats have changed, noting that the price correction following the Russian invasion of Ukraine has already begun. Meanwhile, banks may face higher credit risk due to vulnerabilities in real estate markets.

Trading recommendations
  • Support levels: 1.0194, 1.0092, 1.0043, 0.9993, 0.9838, 0.9794, 0.9755
  • Resistance levels: 1.0363, 1.0411, 1.0504

From the technical point of view, the trend on the EUR/USD currency pair on the hourly time frame is bullish. The price is trading above the moving averages, and the MACD indicator is in the positive zone, but the buying pressure is weakening. For buy deals, it is best to wait for a corrective movement to the support levels of 1.0194 or 1.0092, but with additional confirmation. Sell deals can be considered from the resistance level of 1.0363, but also better confirmation in the form of a false breakdown.

Alternative scenario: if the price breaks down through the support level of 0.9993 and fixes below it, the downtrend will likely resume.

EUR/USD
News feed for 2022.11.15:
  • – Eurozone French Consumer Price Index (m/m) at 09:45 (GMT+2);
  • – Eurozone Spanish Consumer Price Index (m/m) at 10:00 (GMT+2);
  • – Eurozone German ZEW Economic Sentiment (m/m) at 12:00 (GMT+2);
  • – Eurozone ZEW Economic Sentiment (m/m) at 12:00 (GMT+2);
  • – Eurozone GDP (q/q) at 12:00 (GMT+2);
  • – US Empire State Manufacturing Index (m/m) at 15:30 (GMT+2);
  • – US Producer Price Index (m/m) at 15:30 (GMT+2).

The GBP/USD currency pair

Technical indicators of the currency pair:
  • Prev Open: 1.1800
  • Prev Close: 11.1756
  • % chg. over the last day: -0.37 %

UK Chancellor Jeremy Hunt warned yesterday that tax hikes would affect everyone and that government spending cuts are inevitable. The UK economic indicators continue to decline. The UK labor market remains strong, but the coming months may start to see shifts as the economy continues to slow while overall inflation is expected to rise again. This will undoubtedly have a negative impact on the British pound sterling in the medium term. Analysts forecast that the Bank of England will continue to raise rates and reduce its balance sheet in the coming meetings.

Trading recommendations
  • Support levels: 1.1684, 1.1476, 1.1418, 1.1231, 1.1172, 1.1093, 1.0915, 1.0817
  • Resistance levels: 1.1848, 1.1901

From the technical point of view, the trend on the GBP/USD currency pair on the hourly time frame is bullish. The price is trading above the moving averages. The MACD indicator has become inactive, and the divergence indicates weakness and a possible correction. Under such market conditions, it is better to look for buy deals after a slight correction to the support levels of 1.1684 or 1.1476. Sell deals are best to look for from the resistance level of 1.1848, but better with a confirmation in the form of a false breakdown.

Alternative scenario: if the price breaks down of the 1.1418 support level and fixes below it, the downtrend will likely resume.

GBP/USD
News feed for 2022.11.15:
  • – UK Average Earnings Index (m/m) at 09:00 (GMT+2);
  • – Eurozone Spanish Consumer Price Index (m/m) at 10:00 (GMT+2);
  • – UK Unemployment Rate (m/m) at 09:00 (GMT+2).

The USD/JPY currency pair

Technical indicators of the currency pair:
  • Prev Open: 139.11
  • Prev Close: 139.91
  • % chg. over the last day: +0.58 %

Japan’s GDP unexpectedly contracted in the third quarter due to soaring inflation and slowing global economic growth. This marked the first quarterly contraction in over a year. Official data showed that the gross domestic product fell by 1.2% year-over-year. The government is stepping up support for households to try to cushion the effects of cost inflation, with an additional 29 trillion yen ($196 billion) in spending in the budget. Meanwhile, Bank of Japan (BoJ) Governor Kuroda said that the expected inflation rise and a slowdown in GDP growth in the third quarter underscore the need for further economic support. This is a negative signal for the yen.

Trading recommendations
  • Support levels: 139.58, 138.78, 137.65, 136.80
  • Resistance levels: 140.55, 143.17, 145.16, 146.06, 147.34, 148.82, 150.00

From the technical point of view, the medium-term trend on the currency pair USD/JPY is bearish. The price is trading at the level of the moving averages. The MACD indicator has become inactive, indicating the uncertainty of market participants. Under such market conditions, buy trades can be searched for on intraday time frames from the support level of 139.58, but only with confirmation in the form of a bullish initiative. Sell deals can be sought from the resistance level of 141.05, but only with additional confirmation.

Alternative scenario: If the price fixes above 146.06, the uptrend will likely resume.

USD/JPY
News feed for 2022.11.15:
  • – Japan GDP (q/q) at 01:50 (GMT+2);
  • – Japan Industrial Production (m/m) at 06:30 (GMT+2).

The USD/CAD currency pair

Technical indicators of the currency pair:
  • Prev Open: 1.3274
  • Prev Close: 1.3316
  • % chg. over the last day: +0.32 %

Canada will release fresh inflation data this week. Analysts forecast that the annual inflation rate in Canada will remain the same, which will confirm the fact that the peak of inflation in the country has passed, and the Bank of Canada can be less aggressive with raising rates. The situation here is similar to the US Federal Reserve’s policy, so with the rates being equal, the imbalance in the USD/CAD quotes will be caused by oil prices.

Trading recommendations
  • Support levels: 1.3212
  • Resistance levels: 1.3369, 1.3508, 1.3608, 1.3682, 1.3776, 1.3855, 1.3968

From the point of view of technical analysis, the trend on the USD/CAD currency pair is bearish. The MACD indicator has become inactive, and the price is trading between the moving averages. The best way to sell is to consider the resistance level of 1.3369, but there is a lot of space before this level, so buy trades are very appropriate and should be considered on the lower time frames from the support level of 1.3212, but with additional confirmation in the form of a reverse initiative.

Alternative scenario: if the price breaks out and consolidates above the resistance level of 1.3607, the uptrend will likely resume.

USD/CAD
There is no news feed for today.

By JustMarkets


This article reflects a personal opinion and should not be interpreted as an investment advice, and/or offer, and/or a persistent request for carrying out financial transactions, and/or a guarantee, and/or a forecast of future events.

Currency Speculators raised Mexican Peso bullish bets for 6th week to 139-week high

By InvestMacro

Here are the latest charts and statistics for the Commitment of Traders (COT) data published by the Commodities Futures Trading Commission (CFTC). The COT release was delayed due to a Federal Holiday last week.

The latest COT data is updated through Tuesday November 8th and shows a quick view of how large market participants (for-profit speculators and commercial traders) were positioned in the futures markets. All currency positions are in direct relation to the US dollar where, for example, a bet for the euro is a bet that the euro will rise versus the dollar while a bet against the euro will be a bet that the euro will decline versus the dollar.

Weekly Speculator Changes led by Mexican peso & Pound Sterling
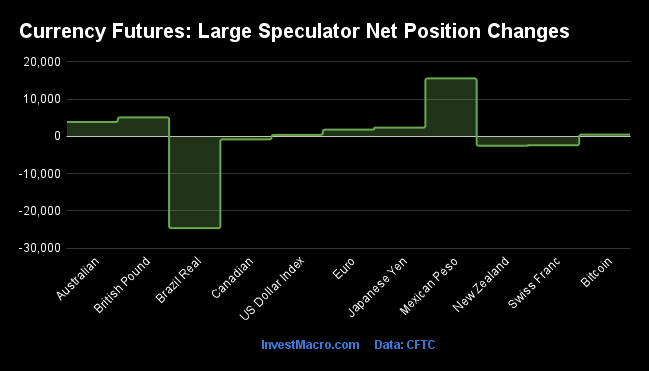
The COT currency market speculator bets were higher last week as seven out of the eleven currency markets we cover had higher positioning while the other four markets had lower speculator contracts.

Leading the gains for the currency markets was the Mexican peso (15,569 contracts) with the British pound sterling (5,101 contracts), the Australian dollar (3,849 contracts), the Japanese yen (2,362 contracts), the Euro (1,809 contracts), Bitcoin (470 contracts) and the US Dollar Index (405 contracts) also showing a positive week.

The currencies leading the declines in speculator bets last week were the Brazilian real (-24,656 contracts) with the New Zealand dollar (-2,520 contracts), the Swiss franc (-2,370 contracts) and the Canadian dollar (-815 contracts) also registering lower bets on the week.

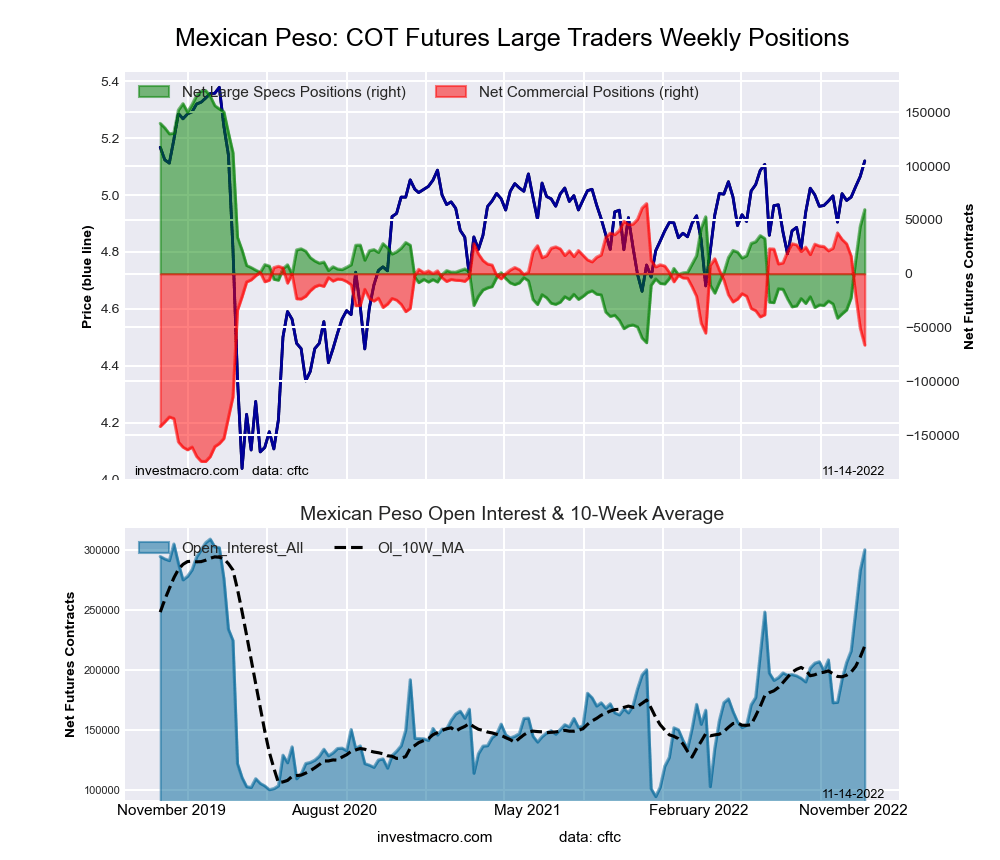
Highlighting the COT currencies data last week was the strong gains for the Mexican peso. The large speculators raised their bullish bets for the peso by over +15,000 contracts and for the sixth consecutive week last week. These gains add up to a total rise of +100,936 net contracts over the latest six-week period and brought the overall peso positioning all the way from -41,322 contracts on September 27th to a total of +59,614 contracts on November 8th. This latest speculator level (+59,614 contracts) is the highest speculator standing since March 10th of 2020, a span of 139-weeks.

The peso’s sentiment has been boosted by the Bank of Mexico’s consistent interest rate hiking campaign to tame inflation. The Bank raised the interest rate by 75 basis points last week to a new level of 10 percent. These higher rates have helped the peso rise this year versus the US dollar as most other major currencies have been on the defensive versus the USD. The peso has climbed by over 6 percent (vs USD) while the Euro, GBP, AUD, CAD, JPY and the NZD have all declined sharply against the American currency over the year.


Data Snapshot of Forex Market Traders | Columns Legend
Nov-08-2022OIOI-IndexSpec-NetSpec-IndexCom-NetCOM-IndexSmalls-NetSmalls-Index
USD Index56,3408130,19375-33,851223,65857
EUR667,90263107,59968-131,7633924,16418
GBP237,33460-39,7353556,25572-16,52026
JPY251,37881-75,2582388,98079-13,72226
CHF49,90741-17,1541328,27689-11,12220
CAD147,55529-18,4642017,9308453431
AUD162,52354-46,6834255,22360-8,54032
NZD45,80839-6,367568,79249-2,42524
MXN300,0209659,61453-66,356456,74272
RUB20,93047,54331-7,15069-39324
BRL28,046114,50155-7,773443,272100
Bitcoin14,439841877-449043123


Strength Scores led by Bitcoin & US Dollar Index last week

Strength Scores (a normalized measure of Speculator positions over a 3-Year range, from 0 to 100 where above 80 is extreme bullish and below 20 is extreme bearish) showed that Bitcoin (77.3 percent) and the US Dollar Index (75.3 percent) led the currency markets last week. The EuroFX (68.0 percent), the New Zealand Dollar (55.6 percent) and the Brazilian Real (54.8 percent) came in as the next highest in the currency markets for strength scores.

On the downside, the Swiss Franc (13.0 percent) and the Canadian Dollar (19.8 percent) were the lowest strength levels and were both in bearish extreme positions below 20 percent.

Strength Statistics:
US Dollar Index (75.3 percent) vs US Dollar Index previous week (74.6 percent)
EuroFX (68.0 percent) vs EuroFX previous week (67.5 percent)
British Pound Sterling (34.9 percent) vs British Pound Sterling previous week (30.5 percent)
Japanese Yen (22.5 percent) vs Japanese Yen previous week (21.1 percent)
Swiss Franc (13.0 percent) vs Swiss Franc previous week (19.0 percent)
Canadian Dollar (19.8 percent) vs Canadian Dollar previous week (20.8 percent)
Australian Dollar (41.6 percent) vs Australian Dollar previous week (38.0 percent)
New Zealand Dollar (55.6 percent) vs New Zealand Dollar previous week (60.4 percent)
Mexican Peso (52.8 percent) vs Mexican Peso previous week (46.1 percent)
Brazilian Real (54.8 percent) vs Brazilian Real previous week (79.0 percent)
Bitcoin (77.3 percent) vs Bitcoin previous week (69.1 percent)

Mexican Peso topped the Strength Trends last week
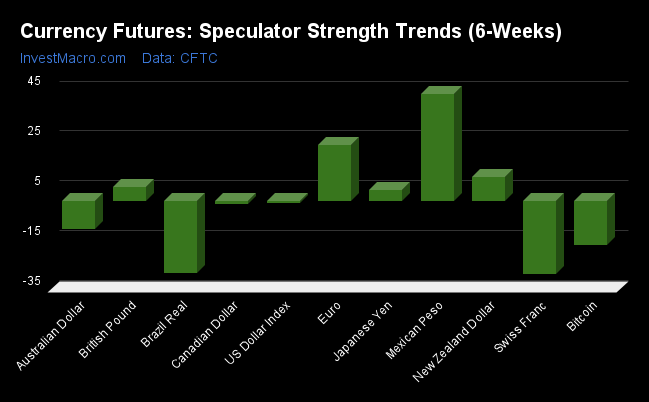
Strength Score Trends (or move index, calculates the 6-week changes in strength scores) showed that the Mexican Peso (43.0 percent) led the past six weeks trends for the currency markets. The EuroFX (22.7 percent), the New Zealand Dollar (9.6 percent) and the British Pound Sterling (5.7 percent) were the next top movers in the latest trends data.

The Swiss Franc (-29.0 percent) and the Brazilian Real (-28.8 percent) led the downside trend scores followed by Bitcoin (-17.5 percent) and the Australian Dollar (-11.2 percent).

Strength Trend Statistics:
US Dollar Index (-0.6 percent) vs US Dollar Index previous week (3.1 percent)
EuroFX (22.7 percent) vs EuroFX previous week (22.2 percent)
British Pound Sterling (5.7 percent) vs British Pound Sterling previous week (8.6 percent)
Japanese Yen (4.5 percent) vs Japanese Yen previous week (2.3 percent)
Swiss Franc (-29.0 percent) vs Swiss Franc previous week (-20.4 percent)
Canadian Dollar (-1.0 percent) vs Canadian Dollar previous week (-23.5 percent)
Australian Dollar (-11.2 percent) vs Australian Dollar previous week (-9.3 percent)
New Zealand Dollar (9.6 percent) vs New Zealand Dollar previous week (16.5 percent)
Mexican Peso (43.0 percent) vs Mexican Peso previous week (30.7 percent)
Brazilian Real (-28.8 percent) vs Brazilian Real previous week (-3.2 percent)
Bitcoin (-17.5 percent) vs Bitcoin previous week (-17.9 percent)


Individual COT Forex Markets:

US Dollar Index Futures:
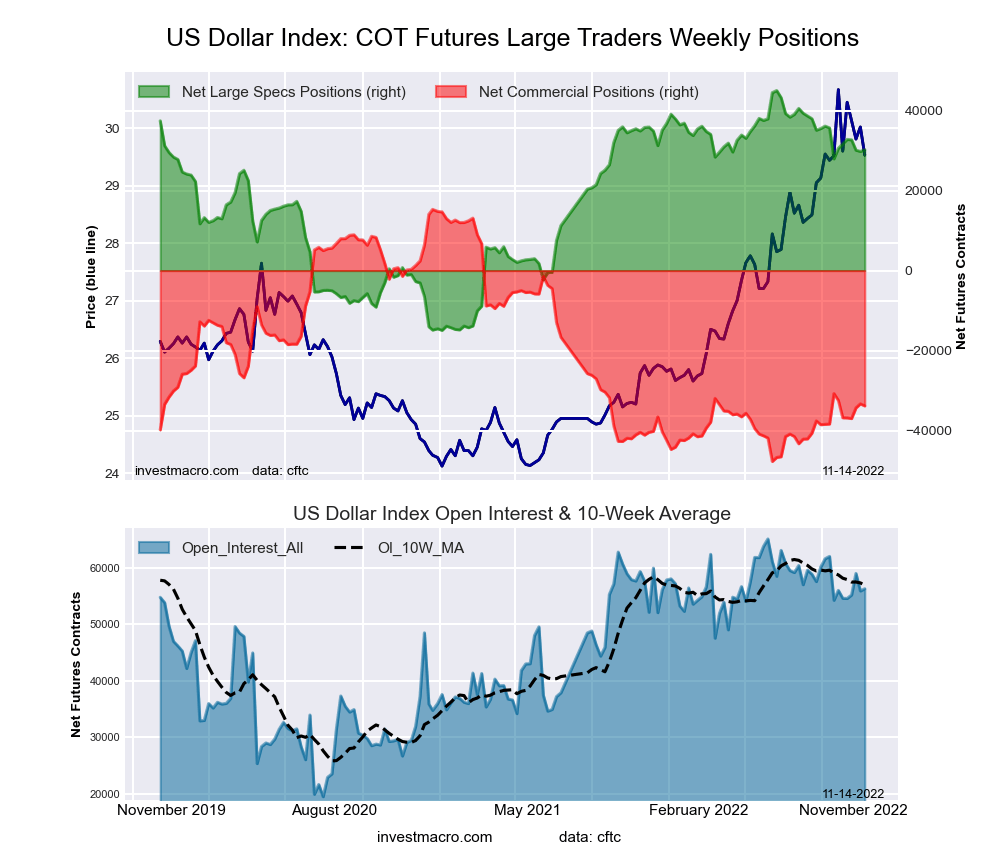
US Dollar Index Forex Futures COT ChartThe US Dollar Index large speculator standing this week reached a net position of 30,193 contracts in the data reported through Tuesday. This was a weekly advance of 405 contracts from the previous week which had a total of 29,788 net contracts.

This week’s current strength score (the trader positioning range over the past three years, measured from 0 to 100) shows the speculators are currently Bullish with a score of 75.3 percent. The commercials are Bearish with a score of 22.0 percent and the small traders (not shown in chart) are Bullish with a score of 56.5 percent.

US DOLLAR INDEX StatisticsSPECULATORSCOMMERCIALSSMALL TRADERS
– Percent of Open Interest Longs:76.19.711.2
– Percent of Open Interest Shorts:22.569.74.7
– Net Position:30,193-33,8513,658
– Gross Longs:42,8875,4426,327
– Gross Shorts:12,69439,2932,669
– Long to Short Ratio:3.4 to 10.1 to 12.4 to 1
NET POSITION TREND:
– Strength Index Score (3 Year Range Pct):75.322.056.5
– Strength Index Reading (3 Year Range):BullishBearishBullish
NET POSITION MOVEMENT INDEX:
– 6-Week Change in Strength Index:-0.6-2.219.0


Euro Currency Futures:

Euro Currency Futures COT ChartThe Euro Currency large speculator standing this week reached a net position of 107,599 contracts in the data reported through Tuesday. This was a weekly rise of 1,809 contracts from the previous week which had a total of 105,790 net contracts.

This week’s current strength score (the trader positioning range over the past three years, measured from 0 to 100) shows the speculators are currently Bullish with a score of 68.0 percent. The commercials are Bearish with a score of 38.6 percent and the small traders (not shown in chart) are Bearish-Extreme with a score of 17.5 percent.

EURO Currency StatisticsSPECULATORSCOMMERCIALSSMALL TRADERS
– Percent of Open Interest Longs:34.850.811.7
– Percent of Open Interest Shorts:18.770.58.1
– Net Position:107,599-131,76324,164
– Gross Longs:232,317339,21878,139
– Gross Shorts:124,718470,98153,975
– Long to Short Ratio:1.9 to 10.7 to 11.4 to 1
NET POSITION TREND:
– Strength Index Score (3 Year Range Pct):68.038.617.5
– Strength Index Reading (3 Year Range):BullishBearishBearish-Extreme
NET POSITION MOVEMENT INDEX:
– 6-Week Change in Strength Index:22.7-20.8-0.8


British Pound Sterling Futures:

British Pound Sterling Futures COT ChartThe British Pound Sterling large speculator standing this week reached a net position of -39,735 contracts in the data reported through Tuesday. This was a weekly lift of 5,101 contracts from the previous week which had a total of -44,836 net contracts.

This week’s current strength score (the trader positioning range over the past three years, measured from 0 to 100) shows the speculators are currently Bearish with a score of 34.9 percent. The commercials are Bullish with a score of 72.3 percent and the small traders (not shown in chart) are Bearish with a score of 25.6 percent.

BRITISH POUND StatisticsSPECULATORSCOMMERCIALSSMALL TRADERS
– Percent of Open Interest Longs:15.474.47.9
– Percent of Open Interest Shorts:32.250.714.8
– Net Position:-39,73556,255-16,520
– Gross Longs:36,630176,56018,714
– Gross Shorts:76,365120,30535,234
– Long to Short Ratio:0.5 to 11.5 to 10.5 to 1
NET POSITION TREND:
– Strength Index Score (3 Year Range Pct):34.972.325.6
– Strength Index Reading (3 Year Range):BearishBullishBearish
NET POSITION MOVEMENT INDEX:
– 6-Week Change in Strength Index:5.7-6.14.5


Japanese Yen Futures:

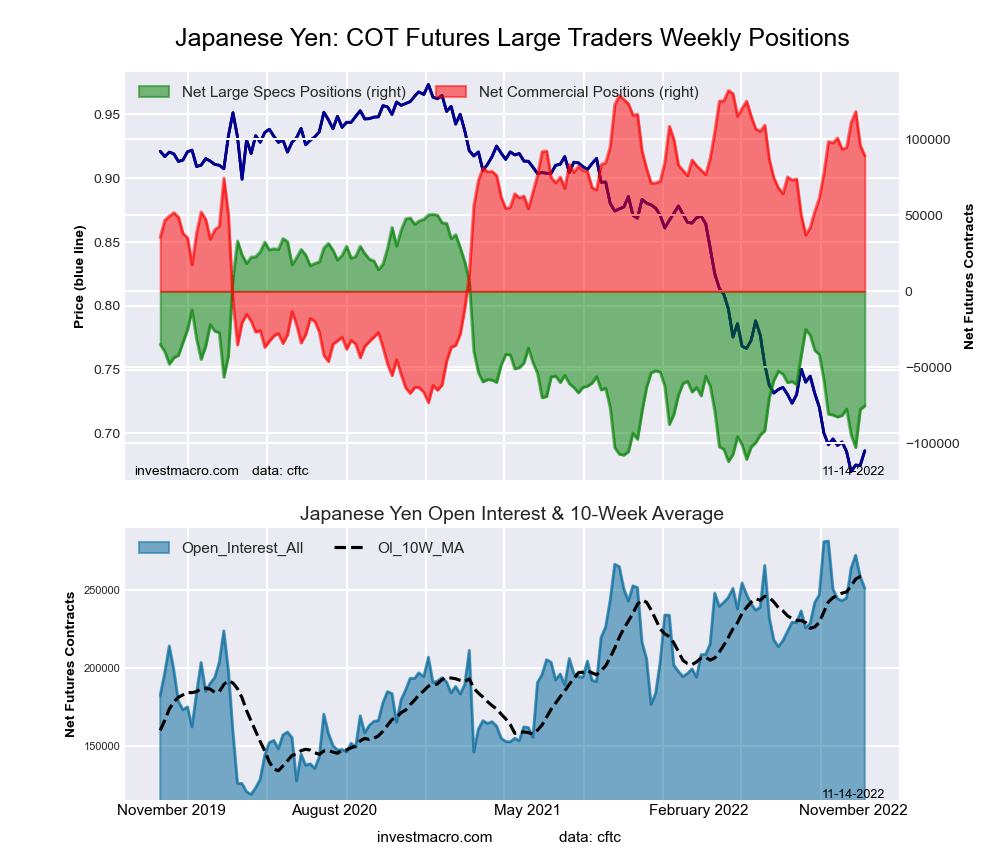
Japanese Yen Forex Futures COT ChartThe Japanese Yen large speculator standing this week reached a net position of -75,258 contracts in the data reported through Tuesday. This was a weekly boost of 2,362 contracts from the previous week which had a total of -77,620 net contracts.

This week’s current strength score (the trader positioning range over the past three years, measured from 0 to 100) shows the speculators are currently Bearish with a score of 22.5 percent. The commercials are Bullish with a score of 79.1 percent and the small traders (not shown in chart) are Bearish with a score of 25.6 percent.

JAPANESE YEN StatisticsSPECULATORSCOMMERCIALSSMALL TRADERS
– Percent of Open Interest Longs:14.873.010.5
– Percent of Open Interest Shorts:44.737.616.0
– Net Position:-75,25888,980-13,722
– Gross Longs:37,201183,53926,462
– Gross Shorts:112,45994,55940,184
– Long to Short Ratio:0.3 to 11.9 to 10.7 to 1
NET POSITION TREND:
– Strength Index Score (3 Year Range Pct):22.579.125.6
– Strength Index Reading (3 Year Range):BearishBullishBearish
NET POSITION MOVEMENT INDEX:
– 6-Week Change in Strength Index:4.5-5.78.8


Swiss Franc Futures:

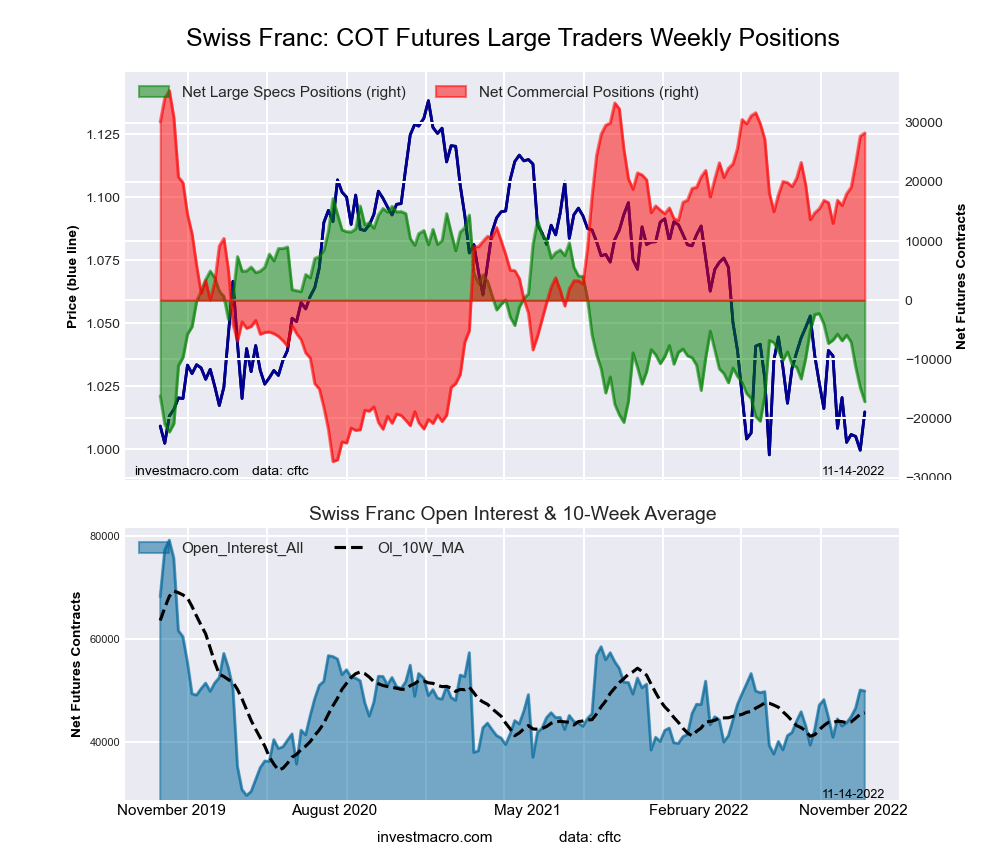
Swiss Franc Forex Futures COT ChartThe Swiss Franc large speculator standing this week reached a net position of -17,154 contracts in the data reported through Tuesday. This was a weekly fall of -2,370 contracts from the previous week which had a total of -14,784 net contracts.

This week’s current strength score (the trader positioning range over the past three years, measured from 0 to 100) shows the speculators are currently Bearish-Extreme with a score of 13.0 percent. The commercials are Bullish-Extreme with a score of 88.6 percent and the small traders (not shown in chart) are Bearish-Extreme with a score of 19.9 percent.

SWISS FRANC StatisticsSPECULATORSCOMMERCIALSSMALL TRADERS
– Percent of Open Interest Longs:9.771.318.3
– Percent of Open Interest Shorts:44.114.740.6
– Net Position:-17,15428,276-11,122
– Gross Longs:4,86535,6039,156
– Gross Shorts:22,0197,32720,278
– Long to Short Ratio:0.2 to 14.9 to 10.5 to 1
NET POSITION TREND:
– Strength Index Score (3 Year Range Pct):13.088.619.9
– Strength Index Reading (3 Year Range):Bearish-ExtremeBullish-ExtremeBearish-Extreme
NET POSITION MOVEMENT INDEX:
– 6-Week Change in Strength Index:-29.018.10.2


Canadian Dollar Futures:

Canadian Dollar Forex Futures COT ChartThe Canadian Dollar large speculator standing this week reached a net position of -18,464 contracts in the data reported through Tuesday. This was a weekly fall of -815 contracts from the previous week which had a total of -17,649 net contracts.

This week’s current strength score (the trader positioning range over the past three years, measured from 0 to 100) shows the speculators are currently Bearish-Extreme with a score of 19.8 percent. The commercials are Bullish-Extreme with a score of 83.7 percent and the small traders (not shown in chart) are Bearish with a score of 31.2 percent.

CANADIAN DOLLAR StatisticsSPECULATORSCOMMERCIALSSMALL TRADERS
– Percent of Open Interest Longs:26.851.320.6
– Percent of Open Interest Shorts:39.339.220.2
– Net Position:-18,46417,930534
– Gross Longs:39,58675,75030,370
– Gross Shorts:58,05057,82029,836
– Long to Short Ratio:0.7 to 11.3 to 11.0 to 1
NET POSITION TREND:
– Strength Index Score (3 Year Range Pct):19.883.731.2
– Strength Index Reading (3 Year Range):Bearish-ExtremeBullish-ExtremeBearish
NET POSITION MOVEMENT INDEX:
– 6-Week Change in Strength Index:-1.0-3.19.2


Australian Dollar Futures:

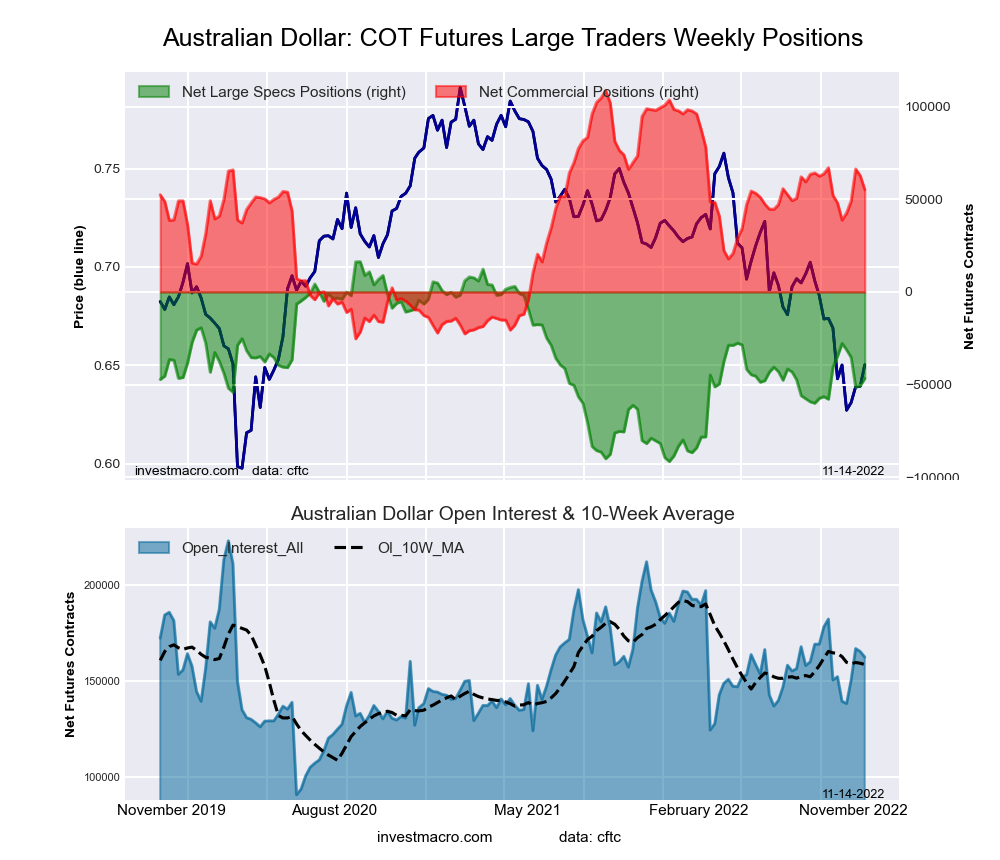
Australian Dollar Forex Futures COT ChartThe Australian Dollar large speculator standing this week reached a net position of -46,683 contracts in the data reported through Tuesday. This was a weekly boost of 3,849 contracts from the previous week which had a total of -50,532 net contracts.

This week’s current strength score (the trader positioning range over the past three years, measured from 0 to 100) shows the speculators are currently Bearish with a score of 41.6 percent. The commercials are Bullish with a score of 60.1 percent and the small traders (not shown in chart) are Bearish with a score of 31.6 percent.

AUSTRALIAN DOLLAR StatisticsSPECULATORSCOMMERCIALSSMALL TRADERS
– Percent of Open Interest Longs:20.566.810.2
– Percent of Open Interest Shorts:49.232.815.5
– Net Position:-46,68355,223-8,540
– Gross Longs:33,288108,58416,602
– Gross Shorts:79,97153,36125,142
– Long to Short Ratio:0.4 to 12.0 to 10.7 to 1
NET POSITION TREND:
– Strength Index Score (3 Year Range Pct):41.660.131.6
– Strength Index Reading (3 Year Range):BearishBullishBearish
NET POSITION MOVEMENT INDEX:
– 6-Week Change in Strength Index:-11.25.411.7


New Zealand Dollar Futures:

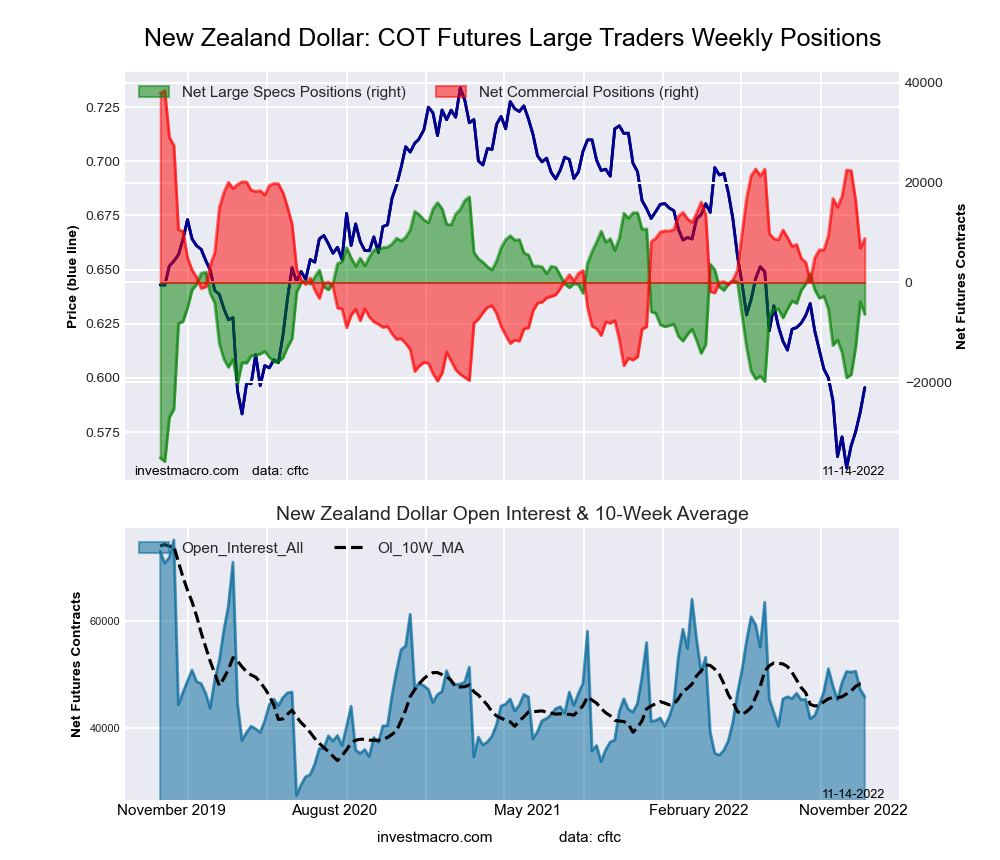
New Zealand Dollar Forex Futures COT ChartThe New Zealand Dollar large speculator standing this week reached a net position of -6,367 contracts in the data reported through Tuesday. This was a weekly reduction of -2,520 contracts from the previous week which had a total of -3,847 net contracts.

This week’s current strength score (the trader positioning range over the past three years, measured from 0 to 100) shows the speculators are currently Bullish with a score of 55.6 percent. The commercials are Bearish with a score of 49.0 percent and the small traders (not shown in chart) are Bearish with a score of 23.8 percent.

NEW ZEALAND DOLLAR StatisticsSPECULATORSCOMMERCIALSSMALL TRADERS
– Percent of Open Interest Longs:39.554.45.5
– Percent of Open Interest Shorts:53.435.210.8
– Net Position:-6,3678,792-2,425
– Gross Longs:18,08524,9232,532
– Gross Shorts:24,45216,1314,957
– Long to Short Ratio:0.7 to 11.5 to 10.5 to 1
NET POSITION TREND:
– Strength Index Score (3 Year Range Pct):55.649.023.8
– Strength Index Reading (3 Year Range):BullishBearishBearish
NET POSITION MOVEMENT INDEX:
– 6-Week Change in Strength Index:9.6-10.813.5


Mexican Peso Futures:

Mexican Peso Futures COT ChartThe Mexican Peso large speculator standing this week reached a net position of 59,614 contracts in the data reported through Tuesday. This was a weekly advance of 15,569 contracts from the previous week which had a total of 44,045 net contracts.

This week’s current strength score (the trader positioning range over the past three years, measured from 0 to 100) shows the speculators are currently Bullish with a score of 52.8 percent. The commercials are Bearish with a score of 45.1 percent and the small traders (not shown in chart) are Bullish with a score of 71.6 percent.

MEXICAN PESO StatisticsSPECULATORSCOMMERCIALSSMALL TRADERS
– Percent of Open Interest Longs:64.032.43.0
– Percent of Open Interest Shorts:44.154.50.8
– Net Position:59,614-66,3566,742
– Gross Longs:192,02497,2559,069
– Gross Shorts:132,410163,6112,327
– Long to Short Ratio:1.5 to 10.6 to 13.9 to 1
NET POSITION TREND:
– Strength Index Score (3 Year Range Pct):52.845.171.6
– Strength Index Reading (3 Year Range):BullishBearishBullish
NET POSITION MOVEMENT INDEX:
– 6-Week Change in Strength Index:43.0-43.514.5


Brazilian Real Futures:

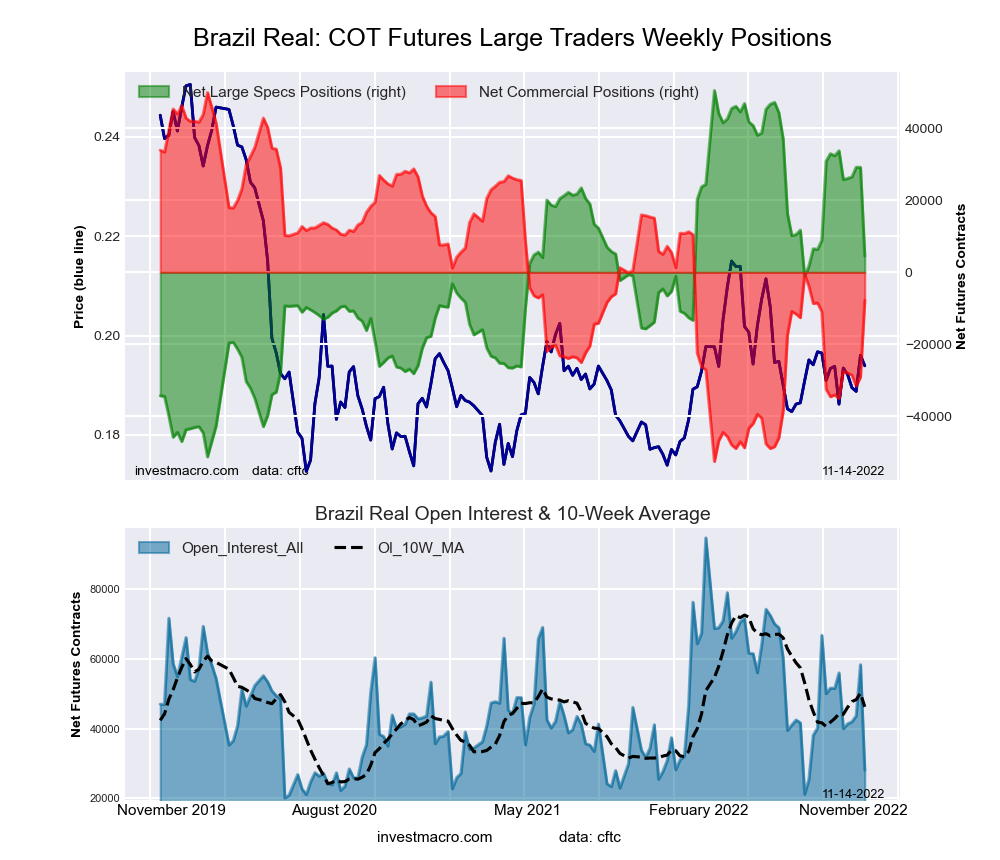
Brazil Real Futures COT ChartThe Brazilian Real large speculator standing this week reached a net position of 4,501 contracts in the data reported through Tuesday. This was a weekly decline of -24,656 contracts from the previous week which had a total of 29,157 net contracts.

This week’s current strength score (the trader positioning range over the past three years, measured from 0 to 100) shows the speculators are currently Bullish with a score of 54.8 percent. The commercials are Bearish with a score of 43.7 percent and the small traders (not shown in chart) are Bullish-Extreme with a score of 100.0 percent.

BRAZIL REAL StatisticsSPECULATORSCOMMERCIALSSMALL TRADERS
– Percent of Open Interest Longs:65.318.616.1
– Percent of Open Interest Shorts:49.246.34.4
– Net Position:4,501-7,7733,272
– Gross Longs:18,3065,2194,502
– Gross Shorts:13,80512,9921,230
– Long to Short Ratio:1.3 to 10.4 to 13.7 to 1
NET POSITION TREND:
– Strength Index Score (3 Year Range Pct):54.843.7100.0
– Strength Index Reading (3 Year Range):BullishBearishBullish-Extreme
NET POSITION MOVEMENT INDEX:
– 6-Week Change in Strength Index:-28.826.622.8


Bitcoin Futures:

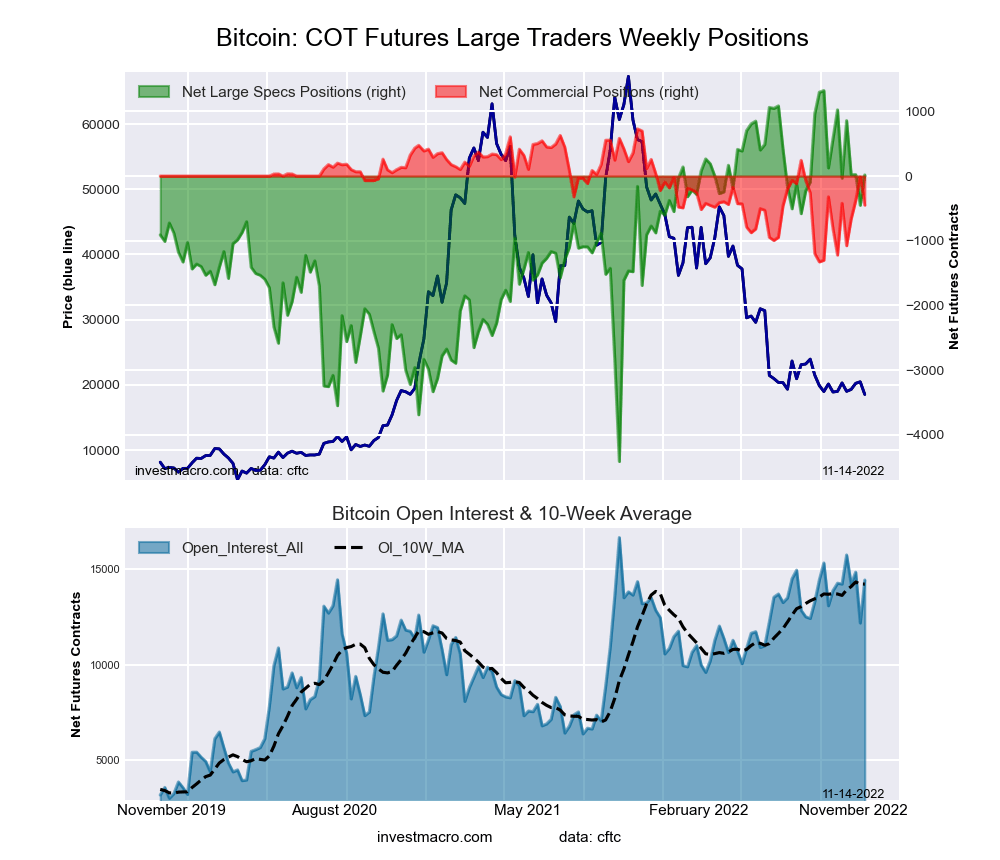
Bitcoin Crypto Futures COT ChartThe Bitcoin large speculator standing this week reached a net position of 18 contracts in the data reported through Tuesday. This was a weekly rise of 470 contracts from the previous week which had a total of -452 net contracts.

This week’s current strength score (the trader positioning range over the past three years, measured from 0 to 100) shows the speculators are currently Bullish with a score of 77.3 percent. The commercials are Bearish with a score of 42.7 percent and the small traders (not shown in chart) are Bearish with a score of 22.7 percent.

BITCOIN StatisticsSPECULATORSCOMMERCIALSSMALL TRADERS
– Percent of Open Interest Longs:78.31.48.8
– Percent of Open Interest Shorts:78.24.55.8
– Net Position:18-449431
– Gross Longs:11,3032001,269
– Gross Shorts:11,285649838
– Long to Short Ratio:1.0 to 10.3 to 11.5 to 1
NET POSITION TREND:
– Strength Index Score (3 Year Range Pct):77.342.722.7
– Strength Index Reading (3 Year Range):BullishBearishBearish
NET POSITION MOVEMENT INDEX:
– 6-Week Change in Strength Index:-17.537.55.3


Article By InvestMacroReceive our weekly COT Newsletter

*COT Report: The COT data, released weekly to the public each Friday, is updated through the most recent Tuesday (data is 3 days old) and shows a quick view of how large speculators or non-commercials (for-profit traders) were positioned in the futures markets.

The CFTC categorizes trader positions according to commercial hedgers (traders who use futures contracts for hedging as part of the business), non-commercials (large traders who speculate to realize trading profits) and nonreportable traders (usually small traders/speculators) as well as their open interest (contracts open in the market at time of reporting). See CFTC criteria here.


Trade Of The Week: USD Bears Mark Their Territory

By ForexTime 

– Last week we questioned whether the mighty dollar would continue dominating the FX space after its shaky performance since the start of Q4.

Our question was partially answered last Thursday after official reports showed annual inflation in the United States slowed to 7.7% in October. Not only was this the lowest level seen since January 2022 but well below the 8.2% figure seen in September. Given how this development significantly reduced the pressure on the Fed to keep raising interest rates aggressively, the dollar collapsed like a house of cards.

With the dollar falling for a fourth straight week in its worst performance since 2020, it is safe to say that bears are in the building and ready to rumble.

Even the equally-weighted USD index collapsed, dipping below the 1.2000 support level for the first time since mid-September.

Given how the fundamentals are swinging in favour of USD bears and the technicals are singing a similar note, dollar weakness could become a key theme for the rest of 2022. Such a development may even set the stage for renewed USD weakness in 2023 as easing inflationary pressures bring Fed doves back into the scene.

This could be another big week for the greenback thanks to numerous speeches from Fed officials, key US economic data, and a big announcement from Former US President Donald Trump on Tuesday. In the meantime, the trend remains a trader’s friend with the path of least resistance on the USD pointing south.

The low down…

One only needs to look at the DXY daily chart to see that bears are back in town.

The dollar’s extreme reaction to last Thursday’s inflation data confirms how sensitive the currency remains to anything concerning inflation and rate hike expectations. Over the past few months, the fundamental forces supporting the almighty dollar have been diminishing slowly. Initially, the greenback drew ample strength from the risk-off mood, confidence in the US economy, and bets for aggressive interest rate hikes by the Fed. Over time, these themes have changed – slowly stripping the dollar of its regal strength and dominance in the FX space.

With roughly six weeks until the New Year, the dollar’s fortunes seem to be changing rapidly as bears enter the scene. If US economic data and Fed officials fuel speculation around slower rate hikes, the dollar could find itself on a slippery decline over the next few weeks.

The week ahead…

Price action could be the primary force influencing the dollar as investors closely scrutinize speeches from Fed officials and US economic data.

There could be a burst of dollar volatility on Tuesday thanks to Donald Trump’s big announcement, where he is expected to announce a second bid for re-election. Mid-week, Fed’s John Williams, and Lael Brainard will be under the spotlight. On Thursday, Fed’s Neel Kashkari and Loretta Mester speak with the US Conference Board leading index and existing home sales published on Friday. It will be interesting to see whether the pending economic reports and Fed speeches fuel or limit the dollar’s downside momentum.

Dollar bears march into the scene

The equally weighted dollar index remains under intense pressure on the daily charts. After cutting through the 1.2400 level like a hot knife through butter, prices dipped below 1.2000 for the first time since September. Bears are clearly in a position of power and may drag the index lower over the next few days to weeks. The current downside momentum may drag prices toward the 1.2900 support level. Below this point prices could test 1.2800 and 1.2700, respectively.  If prices can break above 1.2184, a rebound back towards 1.2400 could be on the cards.


Forex-Time-LogoArticle by ForexTime

ForexTime Ltd (FXTM) is an award winning international online forex broker regulated by CySEC 185/12 www.forextime.com

Japanese Candlesticks Analysis 14.11.2022 (XAUUSD, NZDUSD, GBPUSD)

By RoboForex.com

XAUUSD, “Gold vs US Dollar”

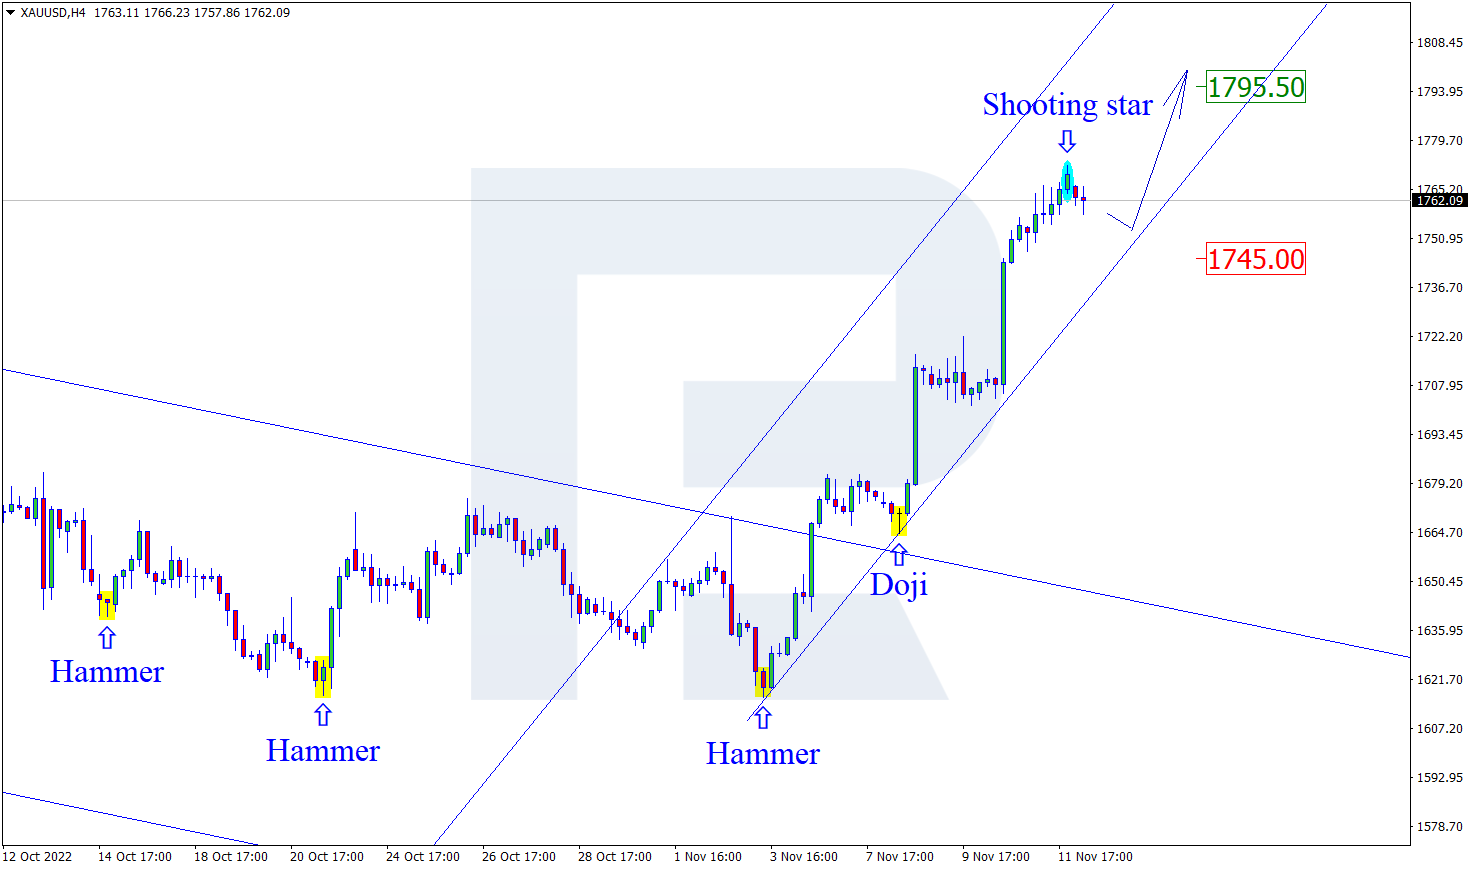
At the resistance level, the instrument has formed a Shooting Star reversal pattern. Currently, the pair may go by the signal in a yet another correction wave. The goal of the pullback will be 1745.00. After a test of the support level, gold may bounce off it and continue the uptrend. However, the quotes may grow to 1795.50 skipping the reversal signal altogether.

XAUUSD
Risk Warning: the result of previous trading operations do not guarantee the same results in the future

NZDUSD, “New Zealand Dollar vs US Dollar”

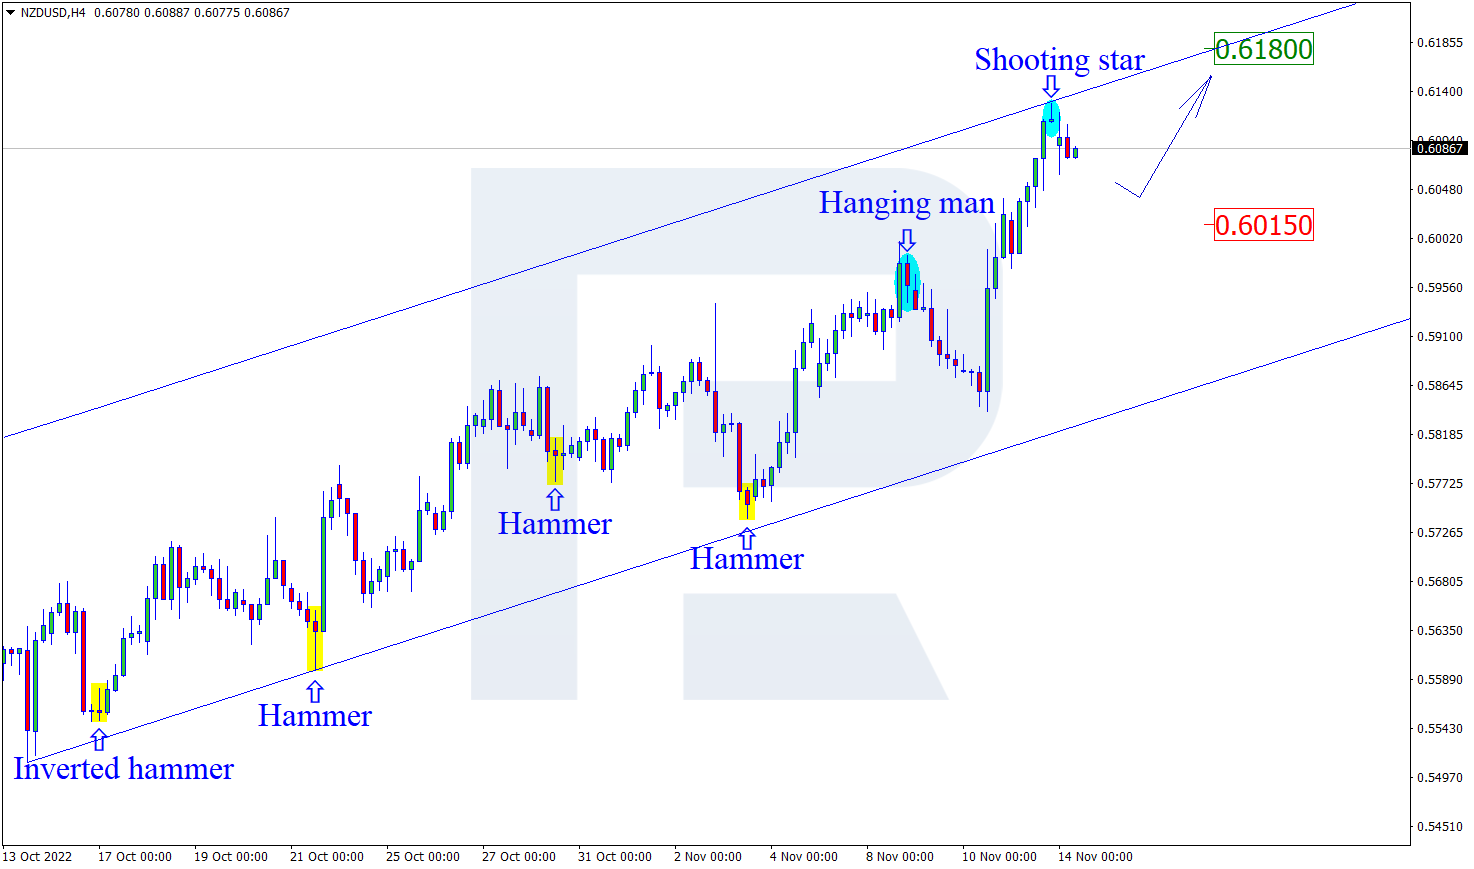
On H4, at the resistance level, the pair has formed a reversal pattern Shooting Star. Currently, the pair may go by the signal in a descending wave. The goal of the correction will be 0.6010. After a bounce off the support level, the quotes will get a chance to continue the uptrend. However, they may grow to 0.6180 without any pullback.

NZDUSD
Risk Warning: the result of previous trading operations do not guarantee the same results in the future

GBPUSD, “Great Britain Pound vs US Dollar”

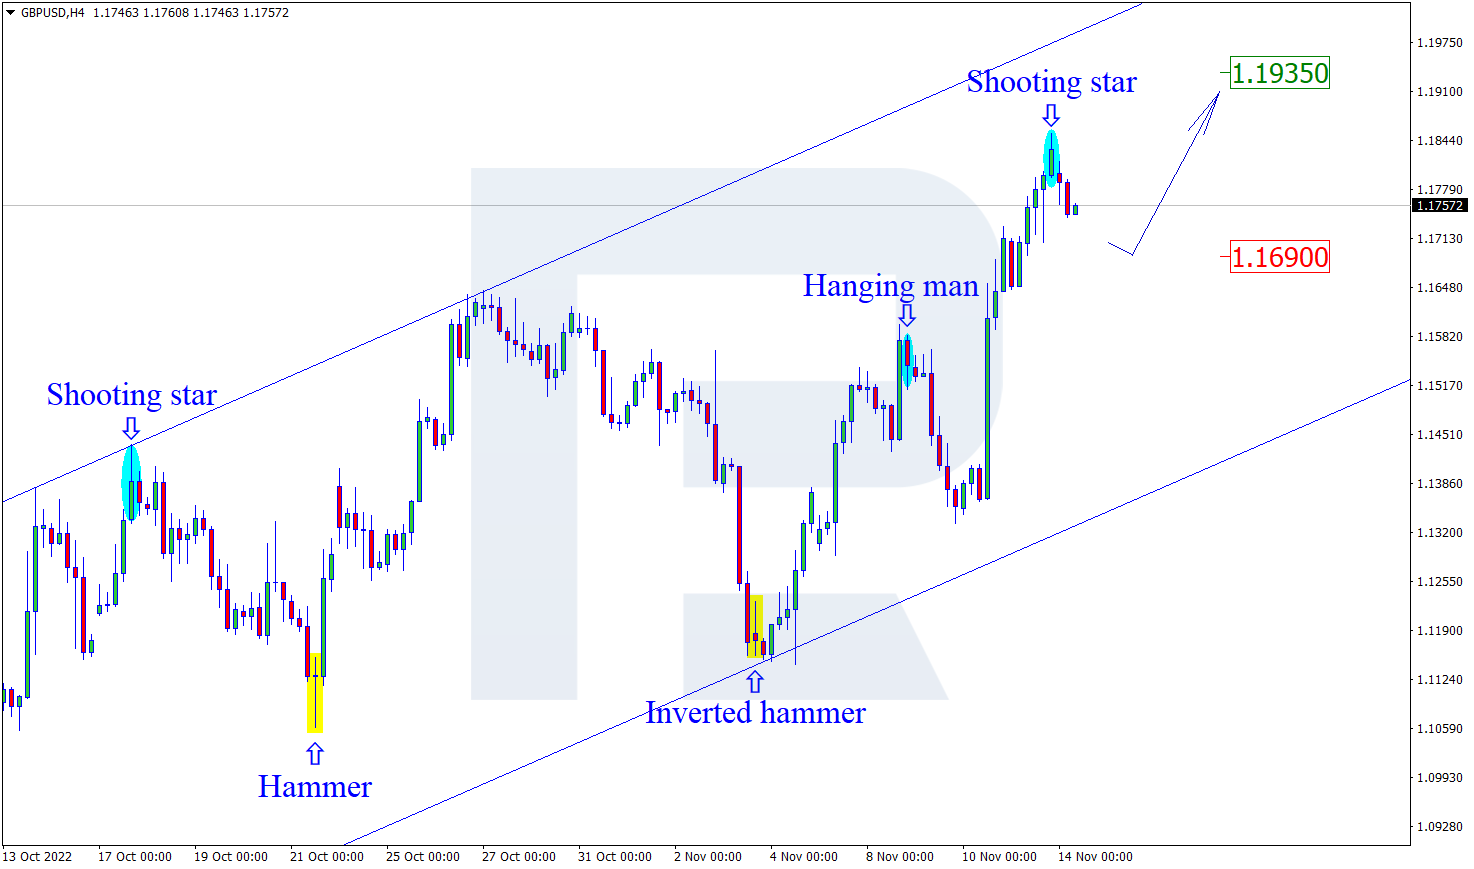
On H4, at the resistance level, the pair has formed a Shooting Star reversal pattern. Currently, the pair will go by the signal in a descending wave. The goal of the correction might be the support level of 1.1690. In case the price bounced off it, it will get a chance to continue the uptrend. However, the price may grow to 1.1935 without any correction to the support.

GBPUSD

Article By RoboForex.com

Attention!
Forecasts presented in this section only reflect the author’s private opinion and should not be considered as guidance for trading. RoboForex LP bears no responsibility for trading results based on trading recommendations described in these analytical reviews.

The Analytical Overview of the Main Currency Pairs on 2022.11.14

By JustMarkets

The EUR/USD currency pair

Technical indicators of the currency pair:
  • Prev Open: 1.0202
  • Prev Close: 1.0353
  • % chg. over the last day: +1.48 %

Dollar weakness on Friday continued Thursday’s move after US Consumer Inflation fell to an annualized 7.7% in October, the lowest since the beginning of the year. This strengthens the argument that the Federal Reserve will reduce the pace of interest rate hikes. But reducing the rate of increase is not “easing,” with the difference in interest rates between the ECB and the US Fed remaining substantial. According to analysts, the technical correction is coming to an end, and the dollar will once again find a new buying interest soon.

Trading recommendations
  • Support levels: 1.0194, 1.0092, 1.0043, 0.9993, 0.9838, 0.9794, 0.9755
  • Resistance levels: 1.0363, 1.0411, 1.0504

From the technical point of view, the trend on the EUR/USD currency pair on the hourly time frame is bullish. The price is trading above the moving averages, and the MACD indicator is in the positive zone, but the price has deviated strongly from the averages. For buy deals, it is best to wait for a corrective movement to the support levels of 1.0194 or 1.0092, but with additional confirmation. Sell deals can be considered from the resistance level of 1.0363, but it’s better with confirmation in the form of a reverse initiative.

Alternative scenario: if the price breaks down through the support level of 0.9993 and fixes below it, the downtrend will likely resume.

EUR/USD
News feed for 2022.11.14:
  • – Eurozone Industrial Production (m/m) at 12:00 (GMT+2);
  • – US FOMC Member Brainard Speaks at 18:30 (GMT+2).

The GBP/USD currency pair

Technical indicators of the currency pair:
  • Prev Open: 1.1704
  • Prev Close: 1.1832
  • % chg. over the last day: +1.01 %

UK GDP fell sharply by 0.6% in the third quarter (against expectations of 0.1%). Analysts predict that this is the beginning of a recession for the UK and expect GDP to fall 2% by summer 2023. However, much depends on how the government’s energy support develops during this period. As winter approaches, analysts expect tensions between the manufacturing, construction, and industrial sectors to increase. But much will depend on Thursday’s budget announcement this week. The focus will be on how the chancellor closes the projected budget deficit in 2026/27 and how the government will make its energy support more targeted to make policy less costly.

Trading recommendations
  • Support levels: 1.1684, 1.1476, 1.1418, 1.1231, 1.1172, 1.1093, 1.0915, 1.0817
  • Resistance levels: 1.1848, 1.1901

From the technical point of view, the GBP/USD currency pair trend on the hourly time frame is bullish. The price is trading above the moving averages. The MACD indicator is in the positive zone, but the first signs of divergence have appeared. Under such market conditions, it is better to look for buy deals after a slight correction to the support levels of 1.1684 or 1.1476. It is best to look for sell deals from the resistance level of 1.1848, but better with a confirmation in the form of a reverse initiative.

Alternative scenario: if the price breaks down from the 1.1418 support level and fixes below it, the downtrend will likely resume.

GBP/USD
There is no news feed for today.

The USD/JPY currency pair

Technical indicators of the currency pair:
  • Prev Open: 140.96
  • Prev Close: 138.76
  • % chg. over the last day: -1.58 %

The Bank of Japan should revise its inflation target and gradually abandon negative rates and radical yield restriction policies to reduce the rising cost of prolonged monetary policy easing, said Yuri Okina, a key government commissioner and possible future BOJ governor. Mrs. Okina also added that the Bank of Japan should steer a course toward policy normalization over the long term. With Consumer Prices forecast to rise later this week, the Bank of Japan is getting closer to abandoning its soft monetary policy. But the situation will likely remain the same until the end of the year.

Trading recommendations
  • Support levels: 138.78, 137.65, 136.80
  • Resistance levels: 138.78, 137.65, 136.80

From the technical point of view, the medium-term trend on the currency pair USD/JPY is bearish. The price is trading below the moving averages. The MACD indicator is deeply negative, and there are signs of overselling and divergence, which shows the weakness of sellers. Under such market conditions, buy trades can be sought on intraday time frames from the support level of 138.78, but only with a confirmation in the form of a false breakdown. Sell deals can be searched from the resistance level of 140.55, but only with additional confirmation.

Alternative scenario: If the price fixes above 146.06, the uptrend will likely resume.

USD/JPY
There is no news feed for today.

The USD/CAD currency pair

Technical indicators of the currency pair:
  • Prev Open: 1.3320
  • Prev Close: 1.3252
  • % chg. over the last day: -0.51 %

The Canadian dollar is a commodity currency and depends on factors such as the monetary policy of the Bank of Canada, the performance of the dollar index, and the oil price movement. Oil prices rose nearly 1% on Monday, continuing Friday’s gains as China eased some of its strict COVID-19 restrictions, raising hopes for a rebound in economic activity and demand from the world’s largest oil importer. Rising oil prices tend to strengthen the Canadian currency.

Trading recommendations
  • Support levels: 1.3212
  • Resistance levels: 1.3369, 1.3508, 1.3608, 1.3682, 1.3776, 1.3855, 1.3968

From the point of view of technical analysis, the trend on the USD/CAD currency pair is bearish. The MACD indicator is in the negative zone, but there is a divergence, and the price is in front of the support level. The best way to sell is to consider the resistance level of 1.3369. Still, there is a lot of space before this level, so buy trades are very appropriate and should be considered on the lower time frames from the support level of 1.3212, but with an additional confirmation in the form of a reverse initiative.

Alternative scenario: if the price breaks out and consolidates above the resistance level of 1.3607, the uptrend will likely resume.

USD/CAD
There is no news feed for today.

By JustMarkets


This article reflects a personal opinion and should not be interpreted as an investment advice, and/or offer, and/or a persistent request for carrying out financial transactions, and/or a guarantee, and/or a forecast of future events.

Euro Sky-Rocketed to Four Months Highs

By RoboForex Analytical Department

EUR/USD has grown to 1.0310. This is the high since 4 July 2022.

The euro is supported by the market interest to risk and strong confidence that the US Federal Reserve System on its December meeting will take a pause and increase the interest rate by fewer base points than before. For now, expectations concerning the rate and the speed of the tightening of the US monetary policy are the crucial factors.

As for the drivers for the euro itself, they are ridiculously few. The economy of the Euro zone is expected to have grown by 3.2% in 2022. Yet in 2023 it is forecast to slow down by 0.4%.

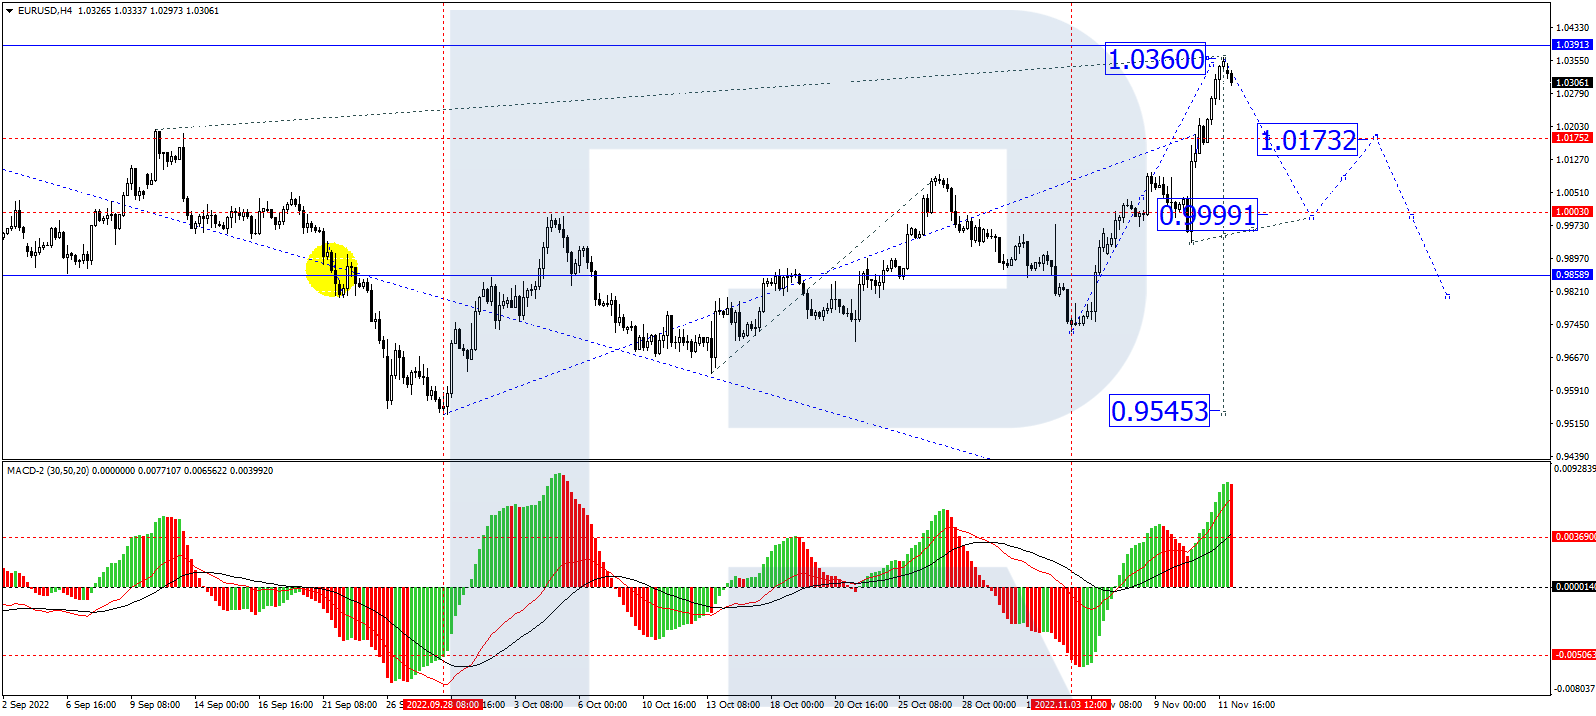
On H4, EUR/USD has completed a wave of growth to 1.0360. Today the market is forming a consolidation range under this level. With an escape downwards, a wave of decline to 1.0173 is expected to start. After this level is reached, a link of growth to 1.0250 is expected to start, followed by a decline to 1.0000. Technically, this scenario is confirmed by the MACD: its signal line is at the highs, preparing to begin a decline to zero.

On H1, the pair has completed a wave of growth to 1.0360. At the moment, it is forming a consolidation range beneath it. An escaped downwards to 1.0255 is 3xpected. After this level is reached, a link of growth to 1.0320 is not excluded, followed by a decline to 1.0141, from where the wave may continue to 1.0000. Technically, the scenario is confirmed by the Stochastic oscillator. Its signal line is near 20, preparing to grow to 50. A bounce off it downwards and a return to 20 are expected.

Disclaimer

Any forecasts contained herein are based on the author’s particular opinion. This analysis may not be treated as trading advice. RoboForex bears no responsibility for trading results based on trading recommendations and reviews contained herein.

Murrey Math Lines 11.11.2022 (Brent, S&P 500)

By RoboForex.com

BRENT

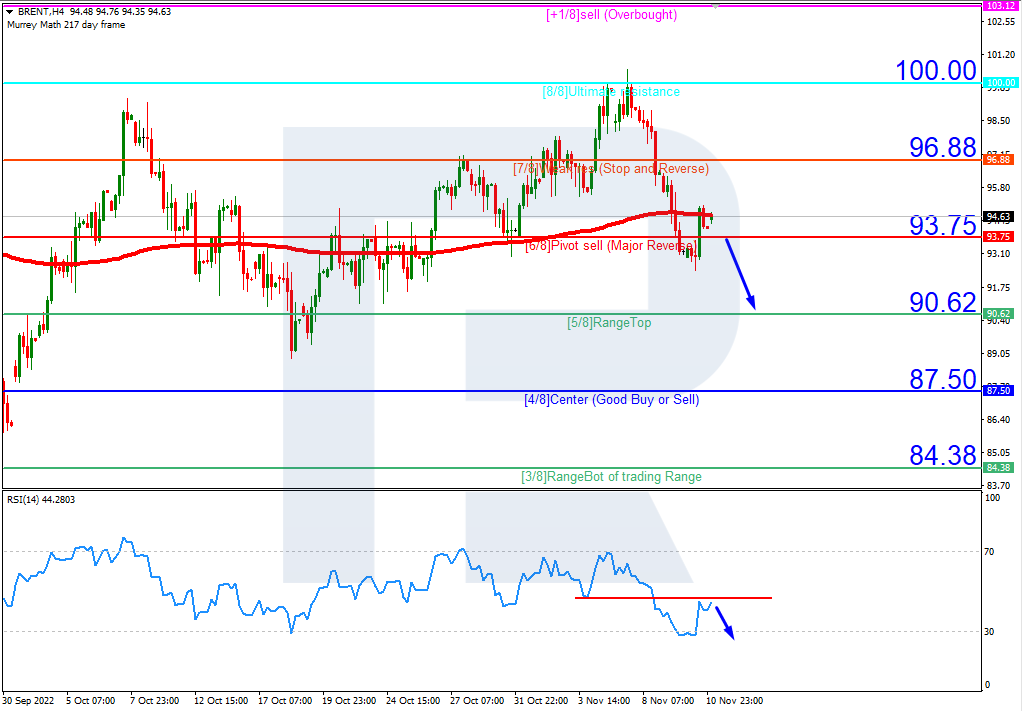
On H4, Brent quotes have broken through the 200-day Moving Average and are now below it, which signifies possible development of a downtrend. The RSI is testing the resistance line. In such circumstances, we should expect a downward breakaway of 6/8 (93.75) and subsequent falling to the support level of 5/8 (90.62). The scenario can be cancelled if the quotes rise over the resistance level of 7/8 (96.88), in which case they may rise to 8/8 (100.00).

BRENTH4
Risk Warning: the result of previous trading operations do not guarantee the same results in the future

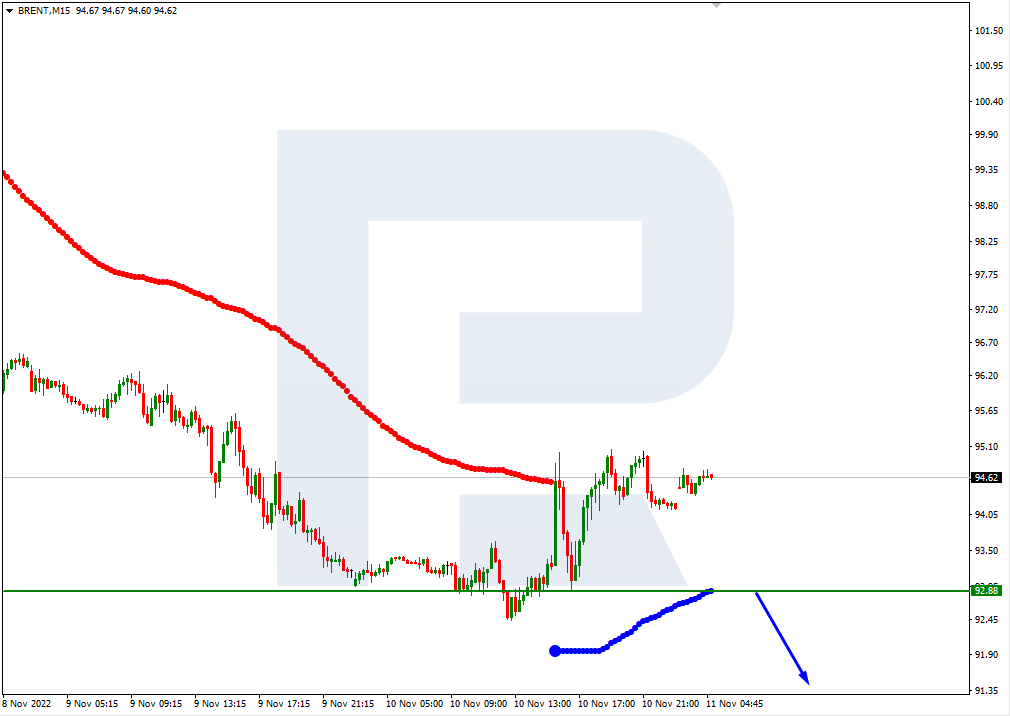
On M15, further falling of the price may be supported by a breakaway of the lower line of VoltyChannel.

BRENT_M15
Risk Warning: the result of previous trading operations do not guarantee the same results in the future

S&P 500

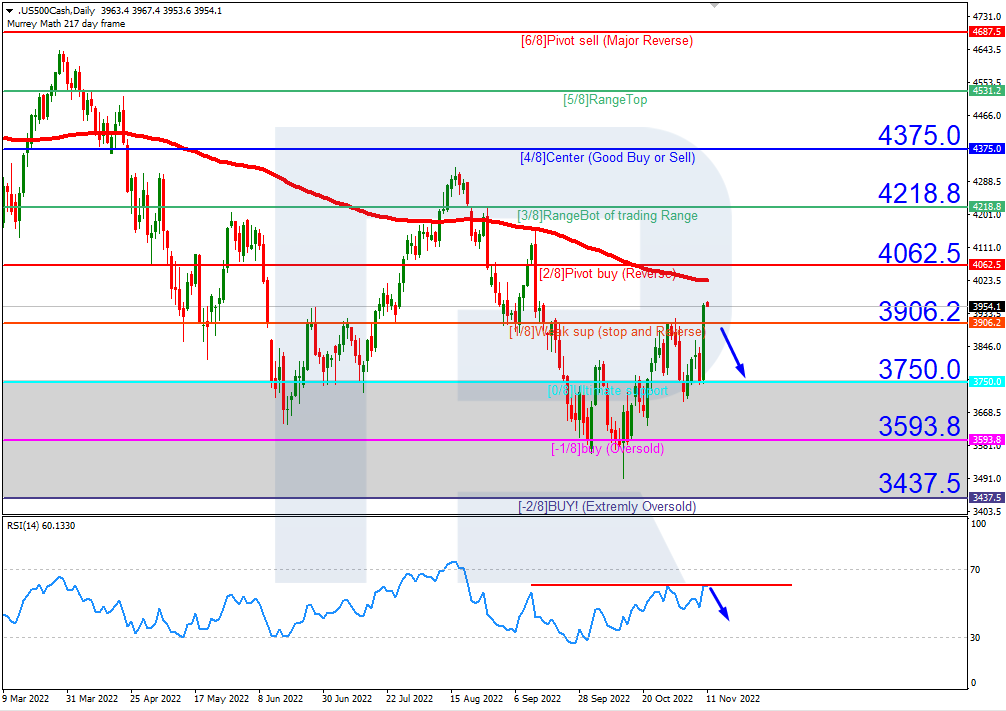
On H4, the quotes of the stock index are under the 200-day Moving Average, which signifies possible development of a downtrend. The RSI is testing the resistance line. In such circumstances, we should expect a downward breakaway of the support level of 1/8 (3906.2) and subsequent falling to 0/8 (3750.0). The scenario can be cancelled if the quotes rise over the resistance level of 2/8 (4062.5), which might lead to a trend reversal and growth of S&P 500 to 3/8 (4218.8).

S&P 500_H4
Risk Warning: the result of previous trading operations do not guarantee the same results in the future

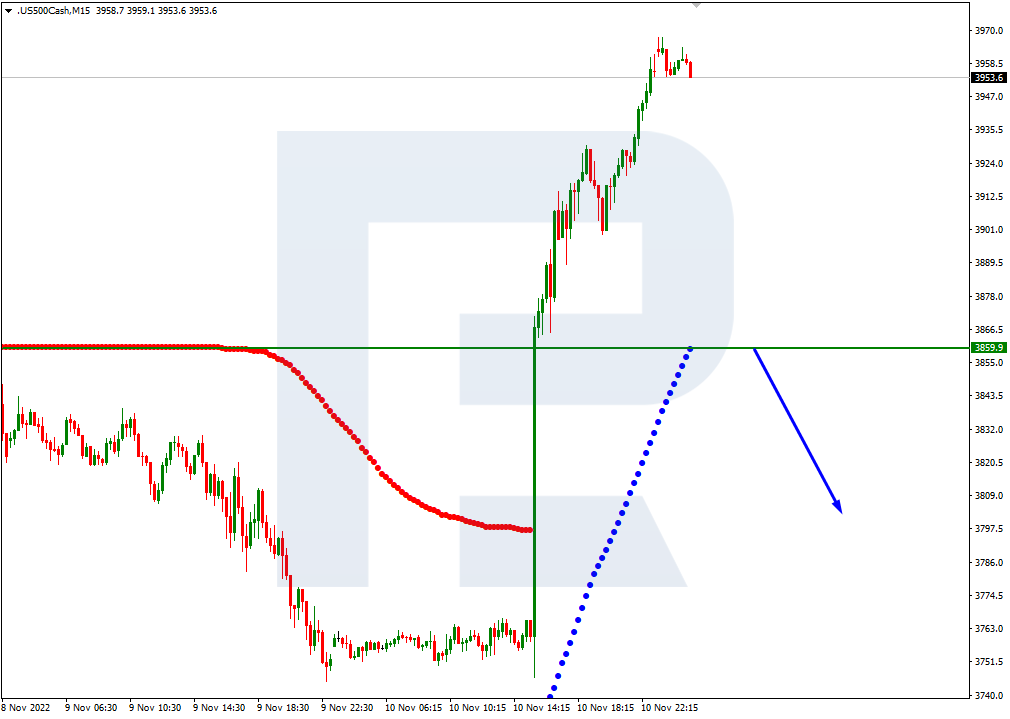
On M15, a breakaway of the lower line of VoltyChannel will increase the probability of the price falling to 0/8 (3750.0) on H4.

S&P 500_M15

Article By RoboForex.com

Attention!
Forecasts presented in this section only reflect the author’s private opinion and should not be considered as guidance for trading. RoboForex LP bears no responsibility for trading results based on trading recommendations described in these analytical reviews.

The Analytical Overview of the Main Currency Pairs on 2022.11.11

By JustMarkets

The EUR/USD currency pair

Technical indicators of the currency pair:
  • Prev Open: 1.0008
  • Prev Close: 1.0207
  • % chg. over the last day: +1.97 %

The US Consumer Price Index annualized declined from 8.2% to 7.9% (expectations of 8.0%). Core inflation, which excludes food and energy, also declined from 6.6% to 6.3% (6.5% expected). The decline in inflation figures indicates that the peak of inflation is likely to be over, which means the US Fed can reduce the pace of interest rate hikes so as not to put additional pressure on the economy. The probability of a 0.5% rate hike in December rose to 81% (vs. 56% the day before). Against this backdrop, the dollar Index fell sharply against the major basket of currencies. Investors have partially regained interest in risky assets, and this trend may continue at least until the end of the year.

Trading recommendations
  • Support levels: 1.0092, 1.0043, 0.9993, 0.9838, 0.9794, 0.9755, 0.9702, 0.9601
  • Resistance levels: 1.0238, 1.0286, 1.0363

From the technical point of view, the trend on the EUR/USD currency pair on the hourly time frame is bullish. The price is trading above the moving averages, and the MACD indicator is in the positive zone, but the price has deviated strongly from the averages. For buy deals, it is best to wait for a corrective movement to the support levels of 1.0043 or 0.9993, but with additional confirmation. Sell deals can be considered from the resistance level of 1.0238, but also better confirmation in the form of a reverse initiative.

Alternative scenario: if the price breaks down through the support level of 0.9945 and fixes below it, the downtrend will likely resume.

EUR/USD
News feed for 2022.11.11:
  • – Eurozone German Consumer Price Index (m/m) at 09:00 (GMT+2);
  • – Eurozone Economic Forecasts (m/m) at 12:00 (GMT+2);
  • – US Michigan Consumer Sentiment (m/m) at 17:00 (GMT+2).

The GBP/USD currency pair

Technical indicators of the currency pair:
  • Prev Open: 1.1356
  • Prev Close: 1.1712
  • % chg. over the last day: +3.13 %

The Bank of England outlined demand-oriented plans for a timely and orderly wind-down of recent securities purchases to ensure financial stability. This is positive for the British currency, especially against the backdrop of a falling dollar Index. Today, the UK will also release its Q3 GDP data as well as industrial production data. Analysts expect the economy to contract and other economic indicators to decline. If the expectations align with the actual data, the GBP might see a sell-off.

Trading recommendations
  • Support levels: 1.1477, 1.1417, 1.1231, 1.1172, 1.1093, 1.0915, 1.0817
  • Resistance levels: 1.1760, 1.1848, 1.1901

From the technical point of view, the trend on the GBP/USD currency pair on the hourly time frame is bullish. The price is trading above the moving averages. The MACD indicator has become positive, but there are signs of overbuying. Under such market conditions, it is better to look for buy deals after a slight correction to the support levels of 1.1477 or 1.1417. It is better to look for sell deals from the resistance level of 1.1760, but it is better with a confirmation in the form of a reverse initiative.

Alternative scenario: if the price breaks down of the 1.1345 support level and fixes below it, the downtrend will likely resume.

GBP/USD
News feed for today:
  • – UK GDP (q/q) at 09:00 (GMT+2);
  • – UK Industrial Production (m/m) at 09:00 (GMT+2);
  • – UK Manufacturing Production (m/m) at 09:00 (GMT+2).

The USD/JPY currency pair

Technical indicators of the currency pair:
  • Prev Open: 145.45
  • Prev Close: 140.94
  • % chg. over the last day: -3.19 %

The Japanese yen strengthened sharply yesterday as the dollar Index fell. Falling inflation in the US raised hopes for a less aggressive rate hike by the Federal Reserve, which led to the dollar selling off and buying riskier assets such as the yen. But even as the pace of interest rate increases slows, the interest rate differential between the US Federal Reserve and the Bank of Japan will continue to widen as the BoJ keeps a loose monetary policy without raising rates. And this difference will still put negative pressure on the Japanese currency in the mid-term perspective.

Trading recommendations
  • Support levels: 140.60, 139.61, 138.78
  • Resistance levels: 143.17, 145.16, 146.06, 147.34, 148.82, 150.00

From the technical point of view, the medium-term trend on the currency pair USD/JPY is bearish. The price is trading below the moving averages. The MACD indicator is deeply negative, there are signs of overselling, plus the price is near the support level. Under such market conditions, buy trades can be sought on intraday time frames from the support level of 140.60, but only with confirmation in the form of reverse initiative. Sell deals can be searched from the resistance level of 143.17, but only with additional confirmation.

Alternative scenario: If the price fixes above 146.06, the uptrend will likely resume.

USD/JPY
There is no news feed for today.

The USD/CAD currency pair

Technical indicators of the currency pair:
  • Prev Open: 1.3526
  • Prev Close: 1.3319
  • % chg. over the last day: -1.55 %

The Governor of the Bank of Canada indicated in his speech yesterday that the Canadian labor market remains very overheated. The Bank of Canada is now in a very similar situation to the US Fed, with the only exception that Canada’s GDP is still showing growth. Inflation is falling in both Canada and the United States, and interest rates are about the same. The only imbalance is created by oil prices, as the Canadian dollar is a commodity currency.

Trading recommendations
  • Support levels: 1.3297, 1.3212
  • Resistance levels: 1.3508, 1.3608, 1.3682, 1.3776, 1.3855, 1.3968

From the point of view of technical analysis, the trend on the USD/CAD currency pair is bearish. The MACD indicator is in the negative zone, but there is a divergence, and the price is in front of the support level. The best way to sell is to consider the resistance level of 1.3508. Still, there is a lot of space before this level, so buy trades are very appropriate. They should be considered on the lower time frames from the support level of 1.3297, but with an additional confirmation in the form of a reverse initiative.

Alternative scenario: if the price breaks out and consolidates above the resistance level of 1.3607, the uptrend will likely resume.

USD/CAD
There is no news feed for today. It’s a bank holiday.

By JustMarkets


This article reflects a personal opinion and should not be interpreted as an investment advice, and/or offer, and/or a persistent request for carrying out financial transactions, and/or a guarantee, and/or a forecast of future events.

EUR holds above parity. Overview for 10.11.2022

By RoboForex.com

On Thursday, the market major looks neutral. The current quote is 1.0030.

Investors in global markets lost some of their optimism, and this inevitably impacted their attitude to risk, making them drop some of the corresponding assets. The EUR also lost some energy.

The news is neutral on the verge of the key publication of the week, which is the US inflation statistics for October. Average forecasts do not exclude an increase in the CPI by 0.6% m/m against growth by 0.4% m/m in September.

The new evidence of growing inflation will let loose the Federal Reserve System on its meeting in December. Today the market expects the interest rate to grow by 50 base points at the end of the year. However, if inflation does grow, forecasts will become more aggressive, accounting for an increase by 75 base points.

Such moods are good for the USD.

Article By RoboForex.com

Attention!
Forecasts presented in this section only reflect the author’s private opinion and should not be considered as guidance for trading. RoboForex LP bears no responsibility for trading results based on trading recommendations described in these analytical reviews.