
By InvestMacro

Here are the latest charts and statistics for the Commitment of Traders (COT) data published by the Commodities Futures Trading Commission (CFTC).
The latest COT data is updated through Tuesday January 24th and shows a quick view of how large market participants (for-profit speculators and commercial traders) were positioned in the futures markets. All currency positions are in direct relation to the US dollar where, for example, a bet for the euro is a bet that the euro will rise versus the dollar while a bet against the euro will be a bet that the euro will decline versus the dollar.
Weekly Speculator Changes led by EuroFX & US Dollar Index

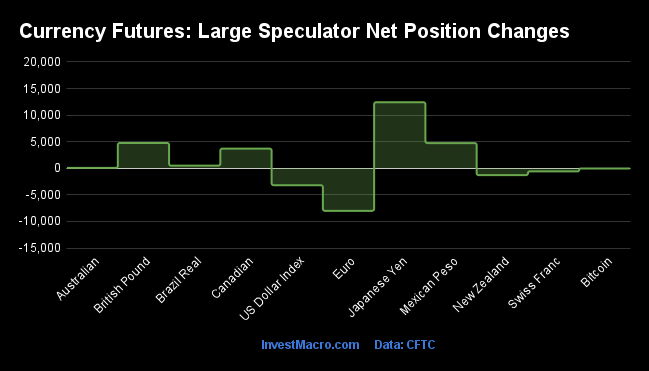
The COT currency market speculator bets were higher this week as six out of the eleven currency markets we cover had higher positioning while the other five markets had lower speculator contracts.
Leading the gains for the currency markets was the EuroFX (7,365 contracts) with the US Dollar Index (1,805 contracts), Japanese Yen (1,326 contracts), British Pound (763 contracts), Brazilian Real (592 contracts) and the Australian Dollar (449 contracts) also showing positive weeks.
The currencies seeing declines in speculator bets on the week were the New Zealand Dollar (-3,884 contracts), the Canadian Dollar (-3,453 contracts), Swiss Franc (-1,567 contracts), Bitcoin (-810 contracts) and the Mexican Peso (-101 contracts) also registering lower bets on the week.
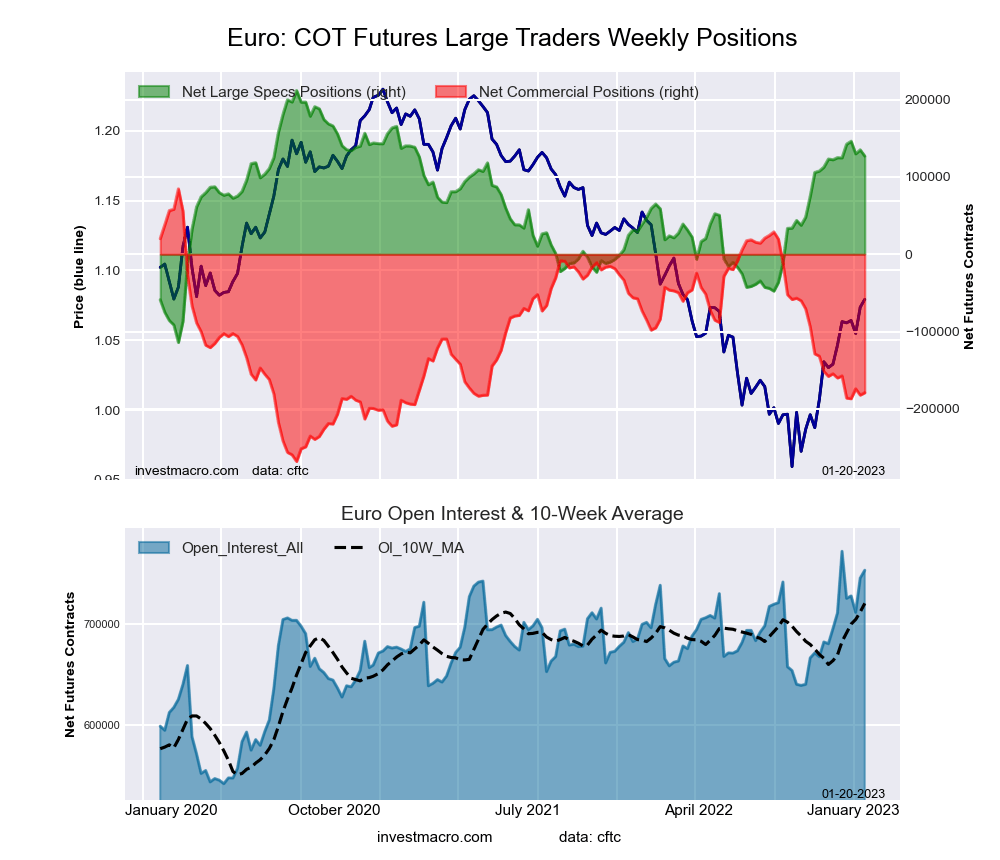
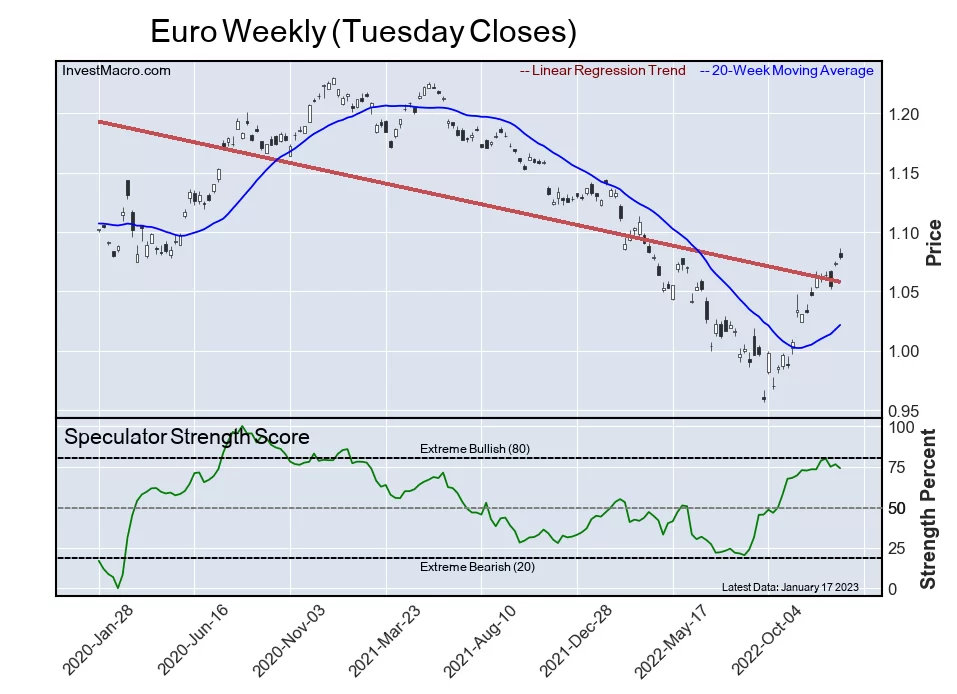
Highlighting the COT currency’s data this week is the strength of the speculator’s positioning in the Euro. Large speculative positions rose this week by over +7,300 contracts and have risen in four out of the past six weeks. Euro weekly positions have now also been higher in sixteen out of the past twenty-one weeks, going from a total of -47,676 contracts on August 30th to this week’s total net position of +134,349 contracts.
The Euro speculator positions have now been above +100,000 contracts for the past thirteen consecutive weeks which is the best streak since early in 2021. The Euro strength index, a measure of positions compared to the past three year’s range, has now moved up to a level of 76 percent strength of last three years.
The Euro exchange rate against the US Dollar hit it’s highest level this week since April above the 1.0900 exchange level. Since October, the Euro has now had higher weekly closes in eleven out of the past fifteen weeks and looks to soon make a run at the psychological 1.1000 level.
| Jan-24-2023 | OI | OI-Index | Spec-Net | Spec-Index | Com-Net | COM-Index | Smalls-Net | Smalls-Index |
|---|---|---|---|---|---|---|---|---|
| USD Index | 41,233 | 48 | 15,163 | 50 | -17,909 | 47 | 2,746 | 47 |
| EUR | 777,569 | 100 | 134,349 | 76 | -186,450 | 23 | 52,101 | 62 |
| GBP | 194,051 | 33 | -23,934 | 48 | 27,654 | 53 | -3,720 | 51 |
| JPY | 173,321 | 34 | -21,635 | 56 | 17,145 | 44 | 4,490 | 63 |
| CHF | 35,368 | 20 | -9,508 | 29 | 11,565 | 64 | -2,057 | 51 |
| CAD | 137,476 | 22 | -30,712 | 5 | 29,159 | 93 | 1,553 | 33 |
| AUD | 129,490 | 29 | -33,171 | 54 | 29,706 | 41 | 3,465 | 61 |
| NZD | 32,710 | 12 | 2,174 | 60 | -4,241 | 36 | 2,067 | 75 |
| MXN | 272,655 | 83 | -48,740 | 7 | 42,327 | 90 | 6,413 | 95 |
| RUB | 20,930 | 4 | 7,543 | 31 | -7,150 | 69 | -393 | 24 |
| BRL | 45,128 | 34 | 22,785 | 70 | -23,618 | 30 | 833 | 71 |
| Bitcoin | 17,390 | 93 | -1,437 | 52 | 912 | 0 | 525 | 25 |
Strength Scores led by EuroFX & Brazilian Real
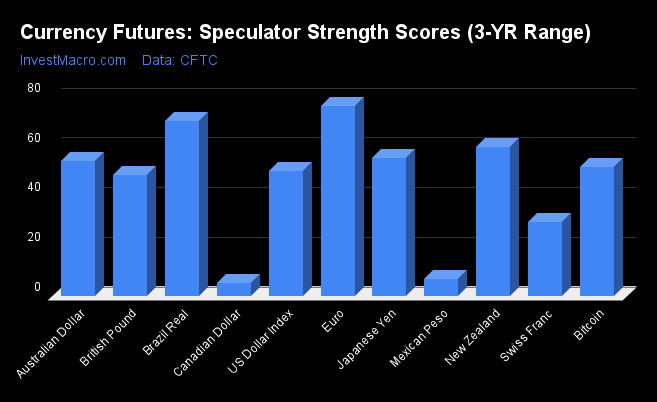
COT Strength Scores (a normalized measure of Speculator positions over a 3-Year range, from 0 to 100 where above 80 is Extreme-Bullish and below 20 is Extreme-Bearish) showed that the EuroFX (76 percent) and the Brazilian Real (70 percent) lead the currency markets this week. The New Zealand Dollar (60 percent), Japanese Yen (56 percent) and the Australian Dollar (54 percent) come in as the next highest in the weekly strength scores.
On the downside, the Canadian Dollar (5 percent) and the Mexican Peso (7 percent) come in at the lowest strength levels currently and are in Extreme-Bearish territory (below 20 percent). The next lowest strength scores are the Swiss Franc (29 percent) and the British Pound (48 percent).
Strength Statistics:
US Dollar Index (50.2 percent) vs US Dollar Index previous week (47.2 percent)
EuroFX (76.2 percent) vs EuroFX previous week (74.0 percent)
British Pound Sterling (48.5 percent) vs British Pound Sterling previous week (47.8 percent)
Japanese Yen (55.6 percent) vs Japanese Yen previous week (54.7 percent)
Swiss Franc (29.5 percent) vs Swiss Franc previous week (33.6 percent)
Canadian Dollar (5.2 percent) vs Canadian Dollar previous week (9.3 percent)
Australian Dollar (54.1 percent) vs Australian Dollar previous week (53.7 percent)
New Zealand Dollar (60.0 percent) vs New Zealand Dollar previous week (70.4 percent)
Mexican Peso (6.7 percent) vs Mexican Peso previous week (6.8 percent)
Brazilian Real (70.3 percent) vs Brazilian Real previous week (69.7 percent)
Bitcoin (51.9 percent) vs Bitcoin previous week (66.0 percent)
New Zealand Dollar & Brazilian Real top the 6-Week Strength Trends
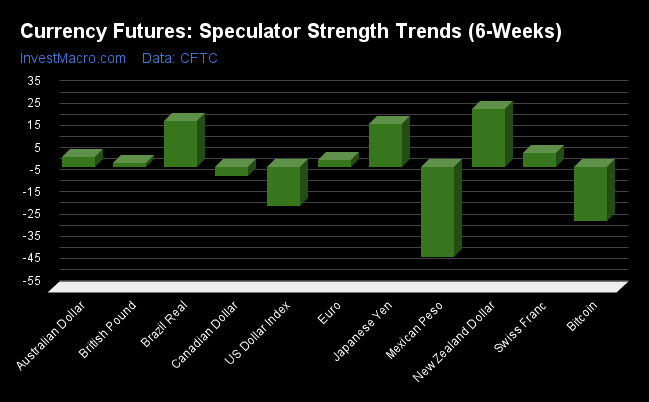
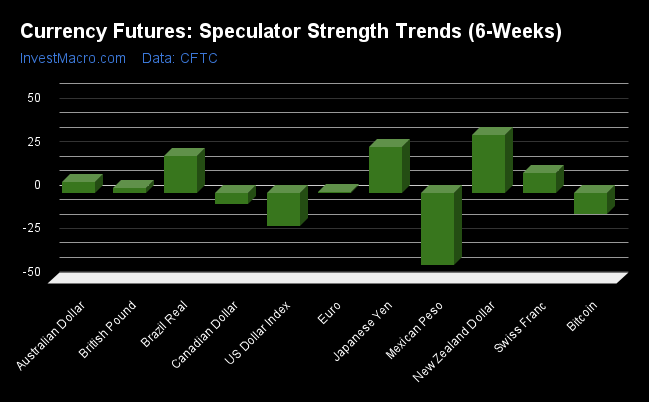
COT Strength Score Trends (or move index, calculates the 6-week changes in strength scores) showed that the New Zealand Dollar (26 percent) and the Brazilian Real (21 percent) lead the past six weeks trends for the currencies. The Japanese Yen (19 percent), the Swiss Franc (6 percent) and the Australian Dollar (4 percent) are the next highest positive movers in the latest trends data.
The Mexican Peso (-41 percent) leads the downside trend scores currently with Bitcoin (-24 percent), the US Dollar Index (-18 percent) and the Canadian Dollar (-4 percent) following next with lower trend scores.
Strength Trend Statistics:
US Dollar Index (-17.7 percent) vs US Dollar Index previous week (-19.2 percent)
EuroFX (3.0 percent) vs EuroFX previous week (0.6 percent)
British Pound Sterling (1.5 percent) vs British Pound Sterling previous week (3.0 percent)
Japanese Yen (19.4 percent) vs Japanese Yen previous week (26.5 percent)
Swiss Franc (6.1 percent) vs Swiss Franc previous week (11.3 percent)
Canadian Dollar (-4.1 percent) vs Canadian Dollar previous week (-6.2 percent)
Australian Dollar (4.3 percent) vs Australian Dollar previous week (6.4 percent)
New Zealand Dollar (25.9 percent) vs New Zealand Dollar previous week (33.6 percent)
Mexican Peso (-40.6 percent) vs Mexican Peso previous week (-42.1 percent)
Brazilian Real (20.7 percent) vs Brazilian Real previous week (21.4 percent)
Bitcoin (-24.4 percent) vs Bitcoin previous week (-12.1 percent)
Individual COT Forex Markets:
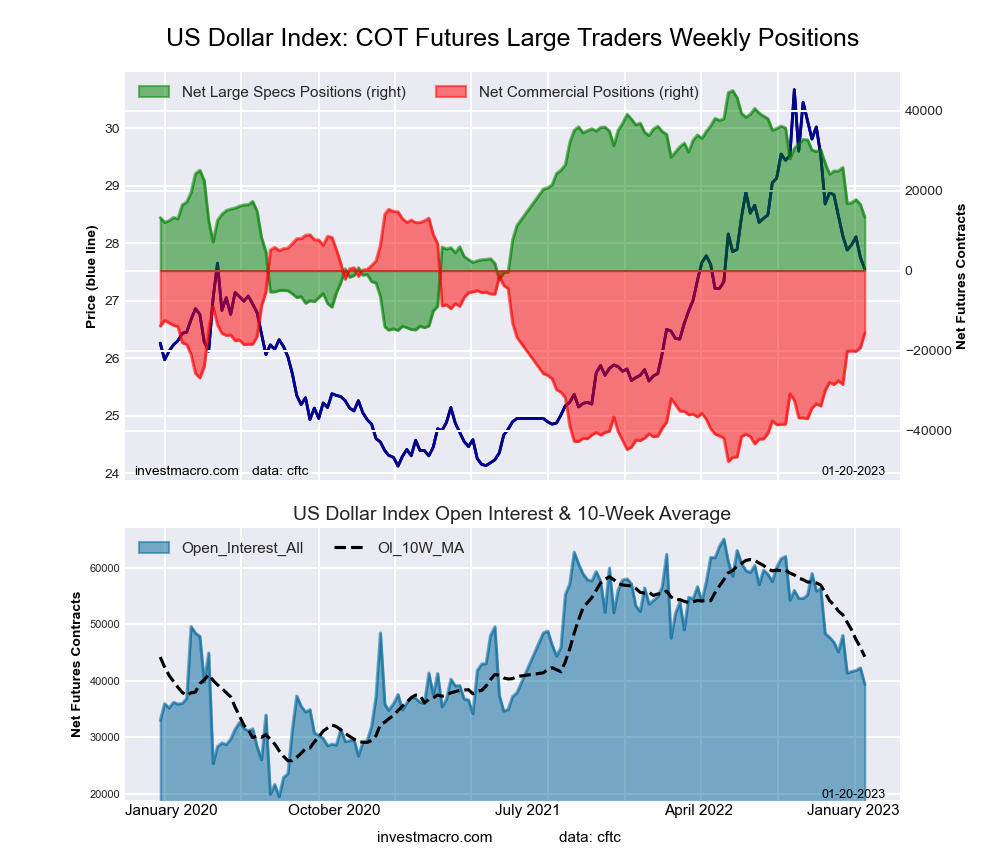
US Dollar Index Futures:
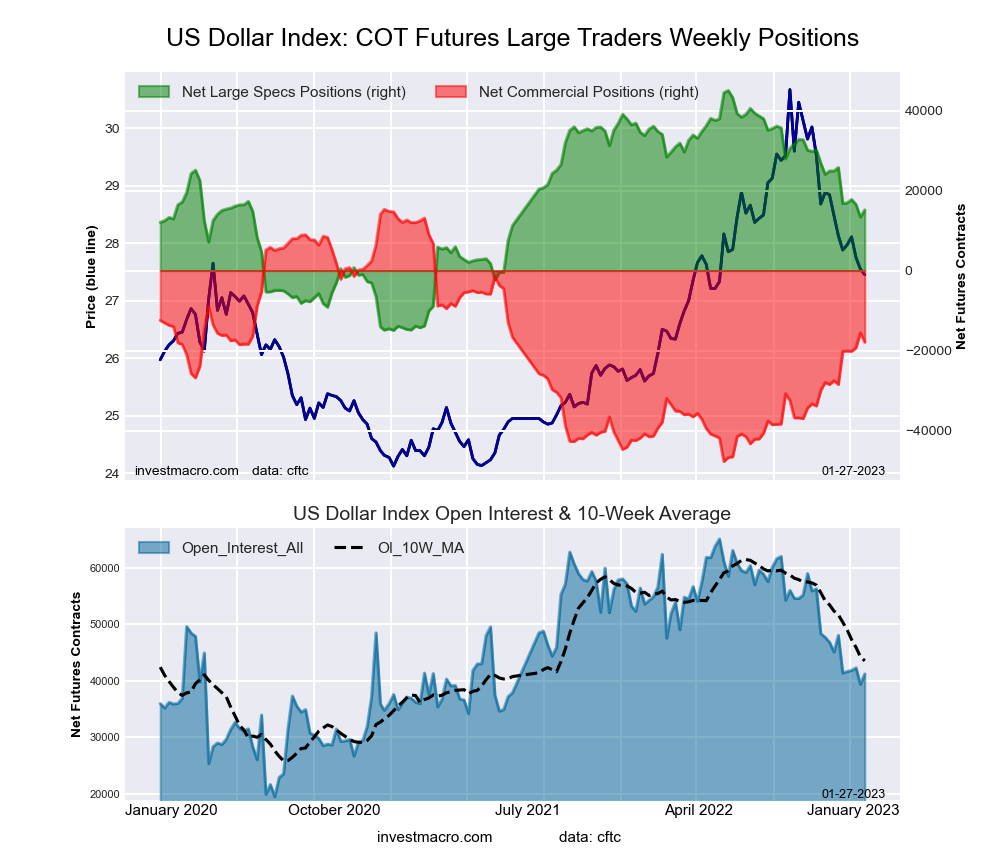 The US Dollar Index large speculator standing this week reached a net position of 15,163 contracts in the data reported through Tuesday. This was a weekly advance of 1,805 contracts from the previous week which had a total of 13,358 net contracts.
This week’s current strength score (the trader positioning range over the past three years, measured from 0 to 100) shows the speculators are currently Bullish with a score of 50.2 percent. The commercials are Bearish with a score of 47.3 percent and the small traders (not shown in chart) are Bearish with a score of 46.6 percent.
| US DOLLAR INDEX Statistics | SPECULATORS | COMMERCIALS | SMALL TRADERS |
| – Percent of Open Interest Longs: | 80.7 | 2.4 | 13.6 |
| – Percent of Open Interest Shorts: | 44.0 | 45.8 | 7.0 |
| – Net Position: | 15,163 | -17,909 | 2,746 |
| – Gross Longs: | 33,291 | 981 | 5,614 |
| – Gross Shorts: | 18,128 | 18,890 | 2,868 |
| – Long to Short Ratio: | 1.8 to 1 | 0.1 to 1 | 2.0 to 1 |
| NET POSITION TREND: | |||
| – Strength Index Score (3 Year Range Pct): | 50.2 | 47.3 | 46.6 |
| – Strength Index Reading (3 Year Range): | Bullish | Bearish | Bearish |
| NET POSITION MOVEMENT INDEX: | |||
| – 6-Week Change in Strength Index: | -17.7 | 16.8 | 0.5 |
Euro Currency Futures:
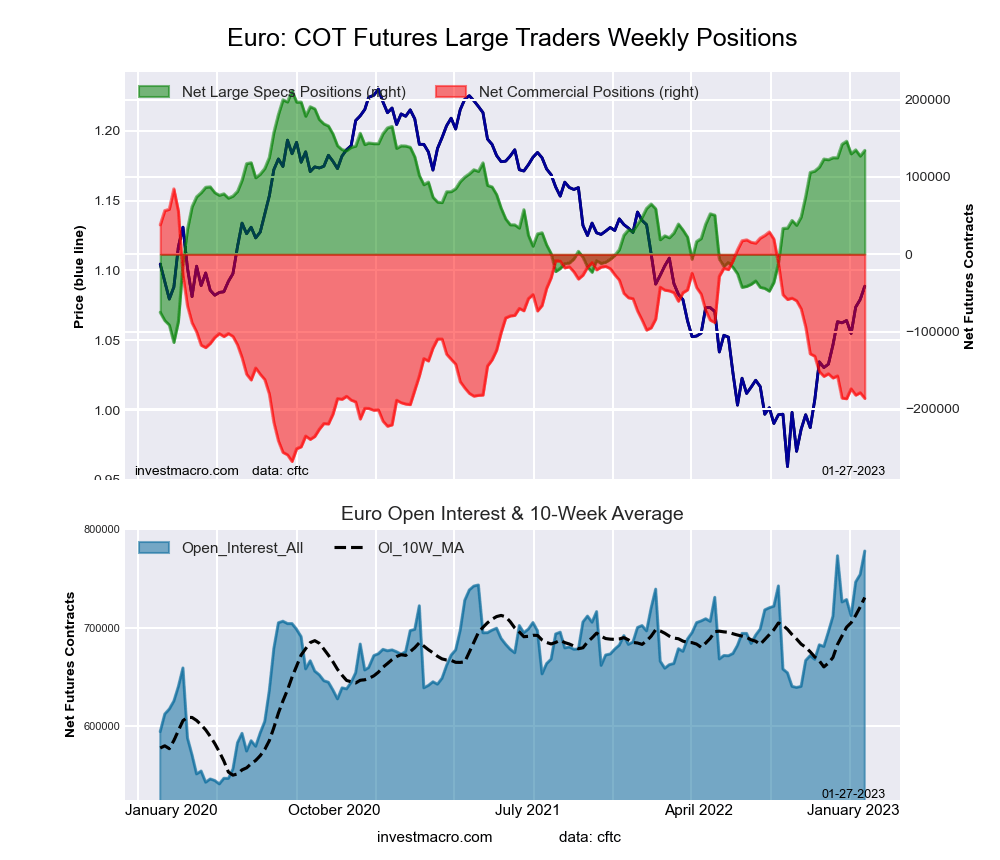 The Euro Currency large speculator standing this week reached a net position of 134,349 contracts in the data reported through Tuesday. This was a weekly advance of 7,365 contracts from the previous week which had a total of 126,984 net contracts.
This week’s current strength score (the trader positioning range over the past three years, measured from 0 to 100) shows the speculators are currently Bullish with a score of 76.2 percent. The commercials are Bearish with a score of 23.1 percent and the small traders (not shown in chart) are Bullish with a score of 62.1 percent.
| EURO Currency Statistics | SPECULATORS | COMMERCIALS | SMALL TRADERS |
| – Percent of Open Interest Longs: | 30.6 | 55.2 | 12.4 |
| – Percent of Open Interest Shorts: | 13.3 | 79.2 | 5.7 |
| – Net Position: | 134,349 | -186,450 | 52,101 |
| – Gross Longs: | 237,743 | 429,253 | 96,793 |
| – Gross Shorts: | 103,394 | 615,703 | 44,692 |
| – Long to Short Ratio: | 2.3 to 1 | 0.7 to 1 | 2.2 to 1 |
| NET POSITION TREND: | |||
| – Strength Index Score (3 Year Range Pct): | 76.2 | 23.1 | 62.1 |
| – Strength Index Reading (3 Year Range): | Bullish | Bearish | Bullish |
| NET POSITION MOVEMENT INDEX: | |||
| – 6-Week Change in Strength Index: | 3.0 | -8.2 | 31.0 |
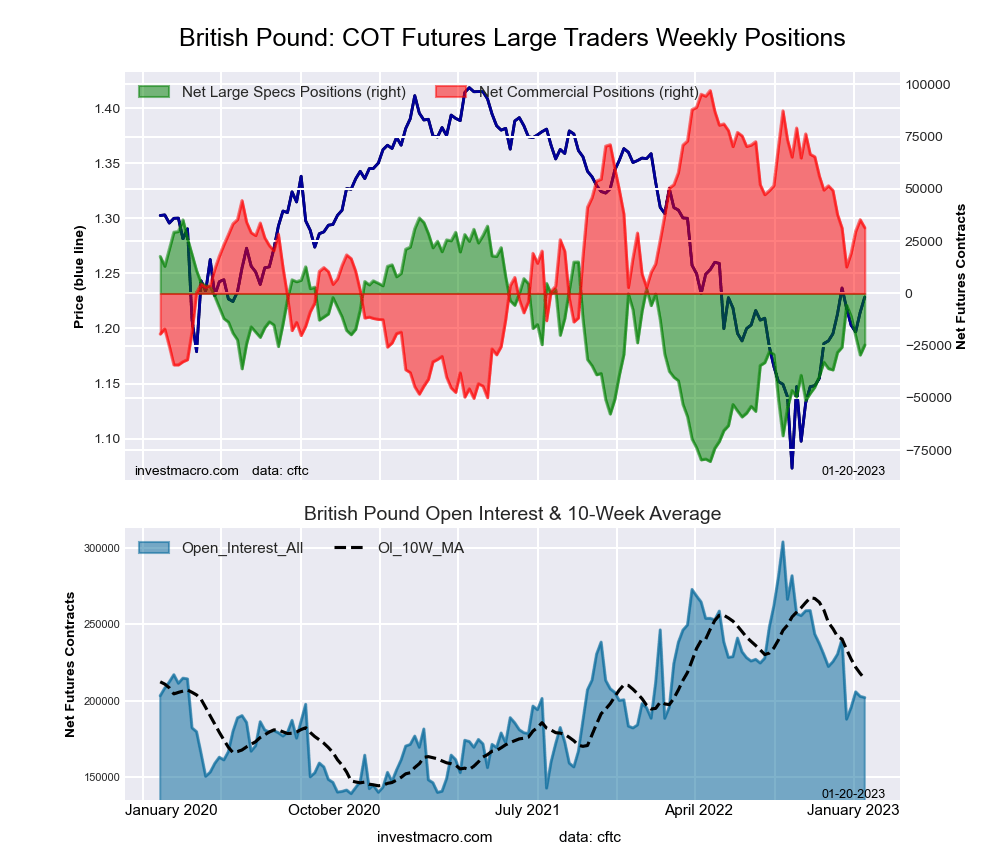
British Pound Sterling Futures:
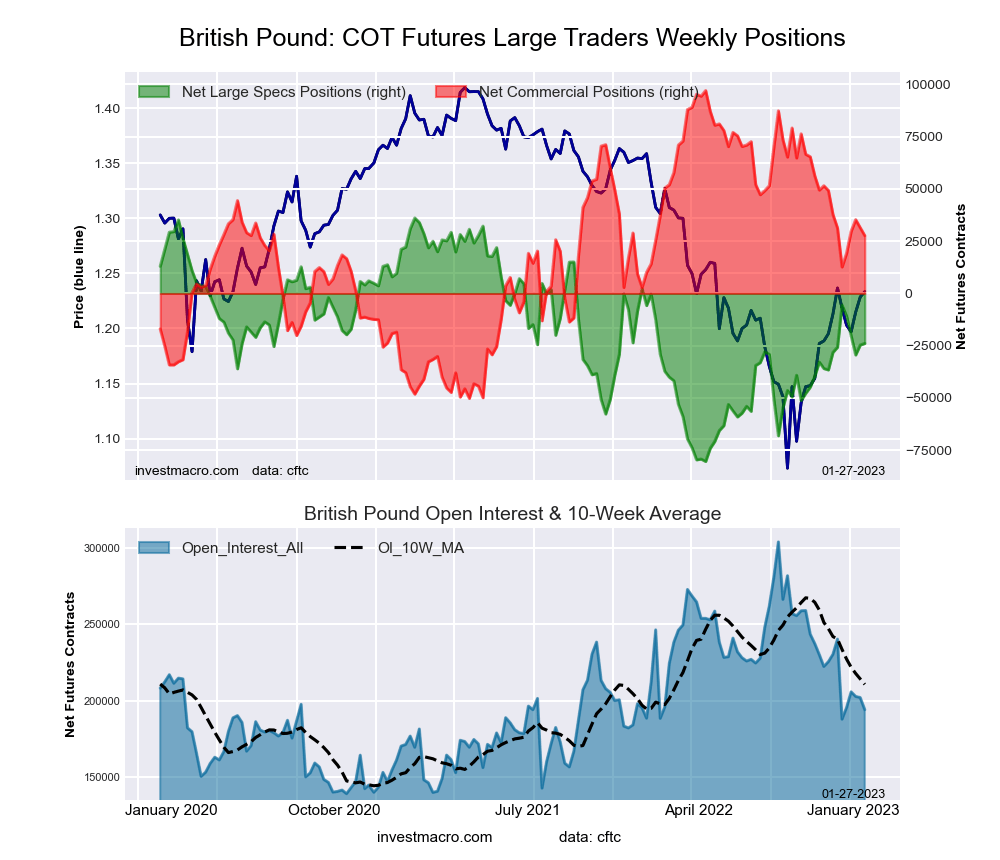 The British Pound Sterling large speculator standing this week reached a net position of -23,934 contracts in the data reported through Tuesday. This was a weekly rise of 763 contracts from the previous week which had a total of -24,697 net contracts.
This week’s current strength score (the trader positioning range over the past three years, measured from 0 to 100) shows the speculators are currently Bearish with a score of 48.5 percent. The commercials are Bullish with a score of 52.9 percent and the small traders (not shown in chart) are Bullish with a score of 50.7 percent.
| BRITISH POUND Statistics | SPECULATORS | COMMERCIALS | SMALL TRADERS |
| – Percent of Open Interest Longs: | 17.9 | 65.6 | 13.6 |
| – Percent of Open Interest Shorts: | 30.2 | 51.3 | 15.5 |
| – Net Position: | -23,934 | 27,654 | -3,720 |
| – Gross Longs: | 34,756 | 127,207 | 26,309 |
| – Gross Shorts: | 58,690 | 99,553 | 30,029 |
| – Long to Short Ratio: | 0.6 to 1 | 1.3 to 1 | 0.9 to 1 |
| NET POSITION TREND: | |||
| – Strength Index Score (3 Year Range Pct): | 48.5 | 52.9 | 50.7 |
| – Strength Index Reading (3 Year Range): | Bearish | Bullish | Bullish |
| NET POSITION MOVEMENT INDEX: | |||
| – 6-Week Change in Strength Index: | 1.5 | -2.5 | 3.6 |
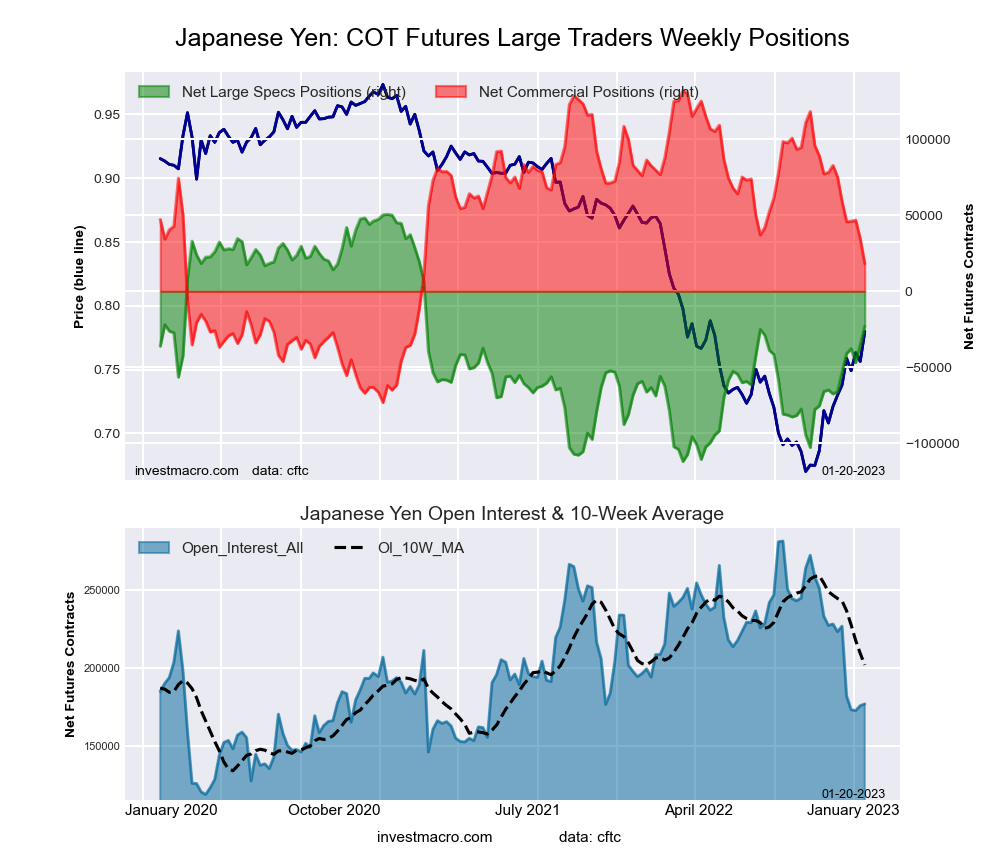
Japanese Yen Futures:
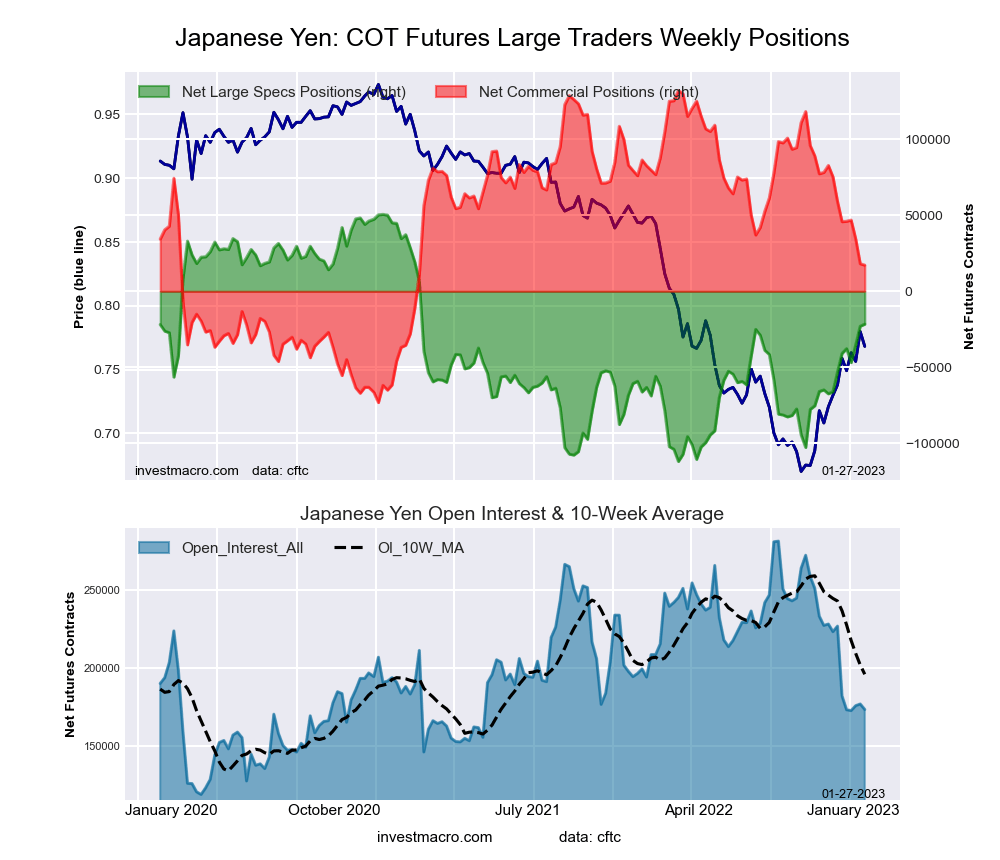 The Japanese Yen large speculator standing this week reached a net position of -21,635 contracts in the data reported through Tuesday. This was a weekly advance of 1,326 contracts from the previous week which had a total of -22,961 net contracts.
This week’s current strength score (the trader positioning range over the past three years, measured from 0 to 100) shows the speculators are currently Bullish with a score of 55.6 percent. The commercials are Bearish with a score of 44.0 percent and the small traders (not shown in chart) are Bullish with a score of 62.6 percent.
| JAPANESE YEN Statistics | SPECULATORS | COMMERCIALS | SMALL TRADERS |
| – Percent of Open Interest Longs: | 15.9 | 65.4 | 17.9 |
| – Percent of Open Interest Shorts: | 28.4 | 55.6 | 15.3 |
| – Net Position: | -21,635 | 17,145 | 4,490 |
| – Gross Longs: | 27,620 | 113,437 | 31,009 |
| – Gross Shorts: | 49,255 | 96,292 | 26,519 |
| – Long to Short Ratio: | 0.6 to 1 | 1.2 to 1 | 1.2 to 1 |
| NET POSITION TREND: | |||
| – Strength Index Score (3 Year Range Pct): | 55.6 | 44.0 | 62.6 |
| – Strength Index Reading (3 Year Range): | Bullish | Bearish | Bullish |
| NET POSITION MOVEMENT INDEX: | |||
| – 6-Week Change in Strength Index: | 19.4 | -20.4 | 21.0 |
Swiss Franc Futures:
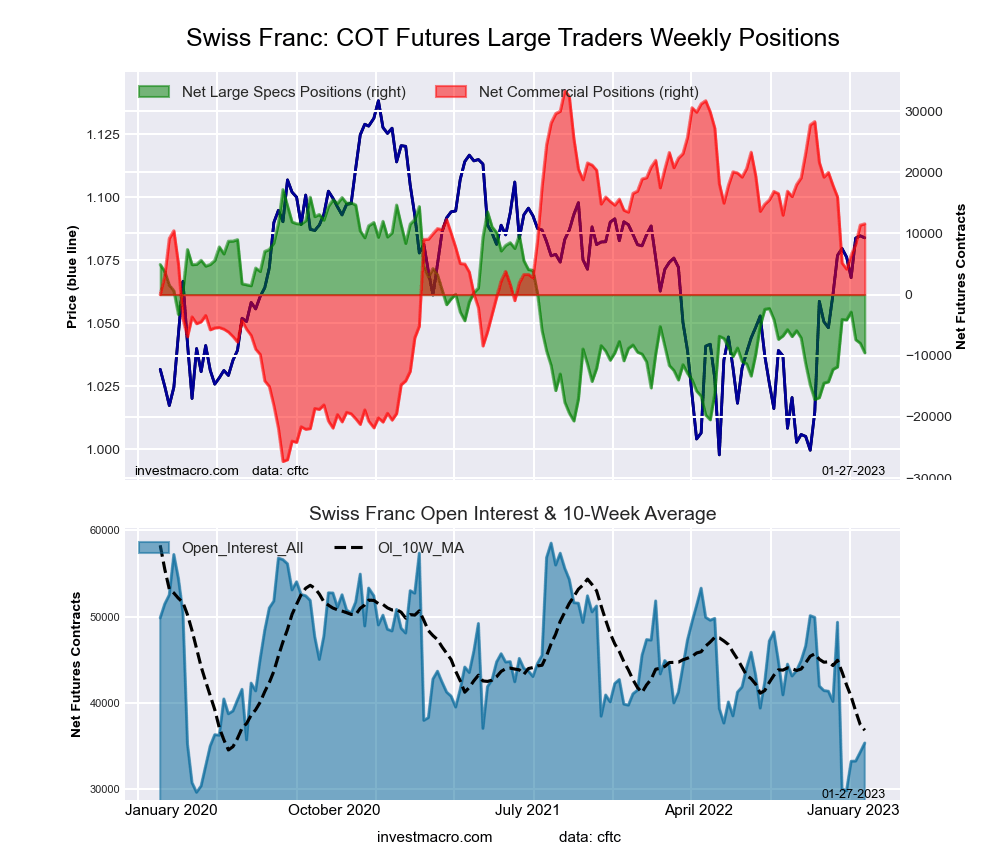 The Swiss Franc large speculator standing this week reached a net position of -9,508 contracts in the data reported through Tuesday. This was a weekly reduction of -1,567 contracts from the previous week which had a total of -7,941 net contracts.
This week’s current strength score (the trader positioning range over the past three years, measured from 0 to 100) shows the speculators are currently Bearish with a score of 29.5 percent. The commercials are Bullish with a score of 64.1 percent and the small traders (not shown in chart) are Bullish with a score of 50.6 percent.
| SWISS FRANC Statistics | SPECULATORS | COMMERCIALS | SMALL TRADERS |
| – Percent of Open Interest Longs: | 10.2 | 57.1 | 32.6 |
| – Percent of Open Interest Shorts: | 37.1 | 24.4 | 38.4 |
| – Net Position: | -9,508 | 11,565 | -2,057 |
| – Gross Longs: | 3,624 | 20,185 | 11,540 |
| – Gross Shorts: | 13,132 | 8,620 | 13,597 |
| – Long to Short Ratio: | 0.3 to 1 | 2.3 to 1 | 0.8 to 1 |
| NET POSITION TREND: | |||
| – Strength Index Score (3 Year Range Pct): | 29.5 | 64.1 | 50.6 |
| – Strength Index Reading (3 Year Range): | Bearish | Bullish | Bullish |
| NET POSITION MOVEMENT INDEX: | |||
| – 6-Week Change in Strength Index: | 6.1 | -7.3 | 7.1 |
Canadian Dollar Futures:
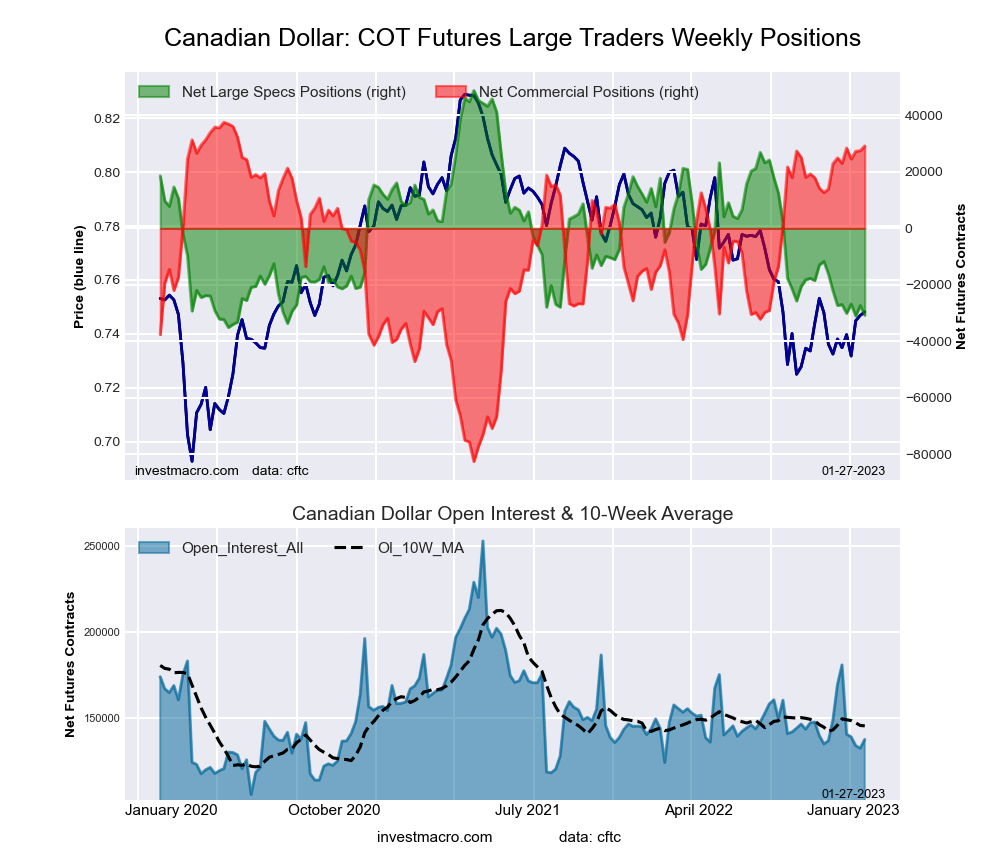 The Canadian Dollar large speculator standing this week reached a net position of -30,712 contracts in the data reported through Tuesday. This was a weekly fall of -3,453 contracts from the previous week which had a total of -27,259 net contracts.
This week’s current strength score (the trader positioning range over the past three years, measured from 0 to 100) shows the speculators are currently Bearish-Extreme with a score of 5.2 percent. The commercials are Bullish-Extreme with a score of 93.0 percent and the small traders (not shown in chart) are Bearish with a score of 33.2 percent.
| CANADIAN DOLLAR Statistics | SPECULATORS | COMMERCIALS | SMALL TRADERS |
| – Percent of Open Interest Longs: | 18.9 | 56.4 | 22.5 |
| – Percent of Open Interest Shorts: | 41.2 | 35.2 | 21.4 |
| – Net Position: | -30,712 | 29,159 | 1,553 |
| – Gross Longs: | 25,978 | 77,571 | 30,927 |
| – Gross Shorts: | 56,690 | 48,412 | 29,374 |
| – Long to Short Ratio: | 0.5 to 1 | 1.6 to 1 | 1.1 to 1 |
| NET POSITION TREND: | |||
| – Strength Index Score (3 Year Range Pct): | 5.2 | 93.0 | 33.2 |
| – Strength Index Reading (3 Year Range): | Bearish-Extreme | Bullish-Extreme | Bearish |
| NET POSITION MOVEMENT INDEX: | |||
| – 6-Week Change in Strength Index: | -4.1 | 3.5 | -1.6 |
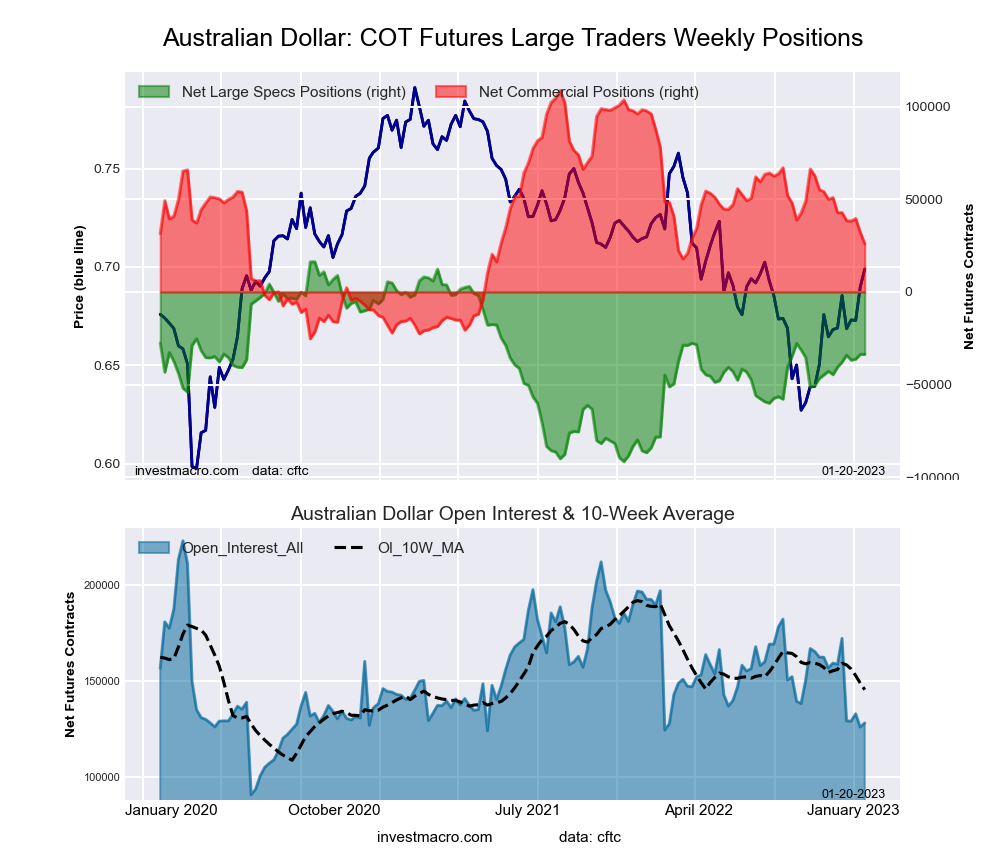
Australian Dollar Futures:
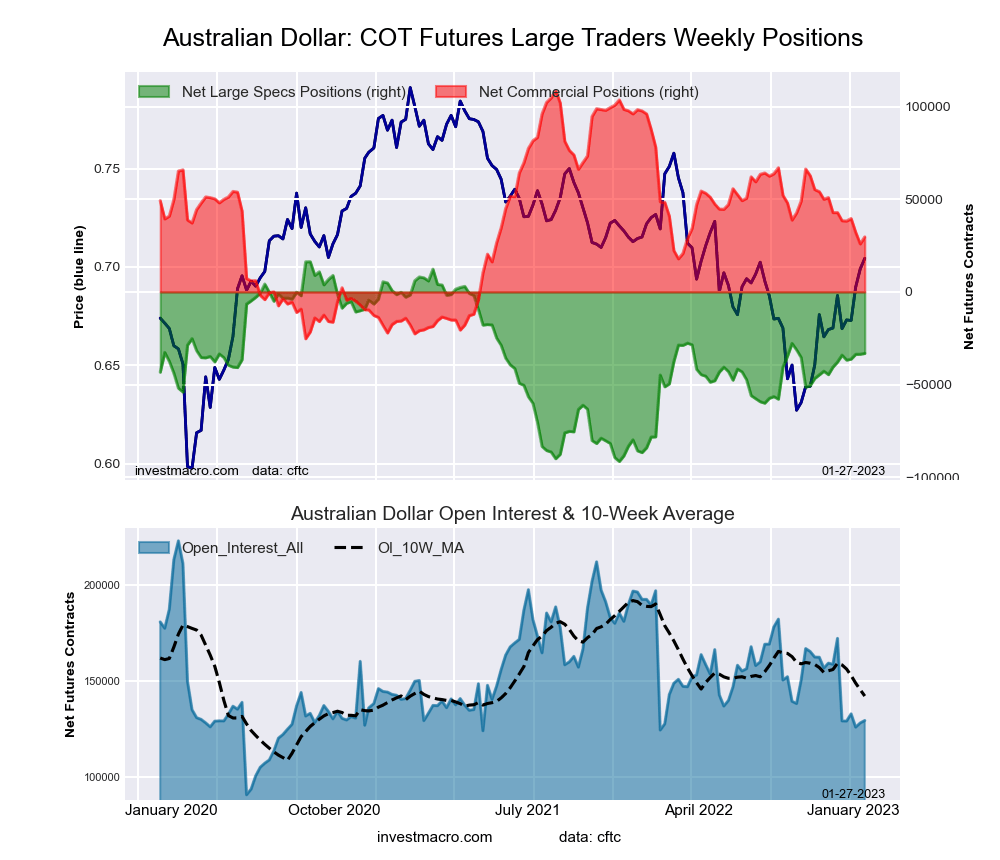 The Australian Dollar large speculator standing this week reached a net position of -33,171 contracts in the data reported through Tuesday. This was a weekly rise of 449 contracts from the previous week which had a total of -33,620 net contracts.
This week’s current strength score (the trader positioning range over the past three years, measured from 0 to 100) shows the speculators are currently Bullish with a score of 54.1 percent. The commercials are Bearish with a score of 41.0 percent and the small traders (not shown in chart) are Bullish with a score of 60.9 percent.
| AUSTRALIAN DOLLAR Statistics | SPECULATORS | COMMERCIALS | SMALL TRADERS |
| – Percent of Open Interest Longs: | 22.8 | 57.8 | 17.7 |
| – Percent of Open Interest Shorts: | 48.4 | 34.8 | 15.0 |
| – Net Position: | -33,171 | 29,706 | 3,465 |
| – Gross Longs: | 29,466 | 74,818 | 22,903 |
| – Gross Shorts: | 62,637 | 45,112 | 19,438 |
| – Long to Short Ratio: | 0.5 to 1 | 1.7 to 1 | 1.2 to 1 |
| NET POSITION TREND: | |||
| – Strength Index Score (3 Year Range Pct): | 54.1 | 41.0 | 60.9 |
| – Strength Index Reading (3 Year Range): | Bullish | Bearish | Bullish |
| NET POSITION MOVEMENT INDEX: | |||
| – 6-Week Change in Strength Index: | 4.3 | -9.8 | 20.7 |
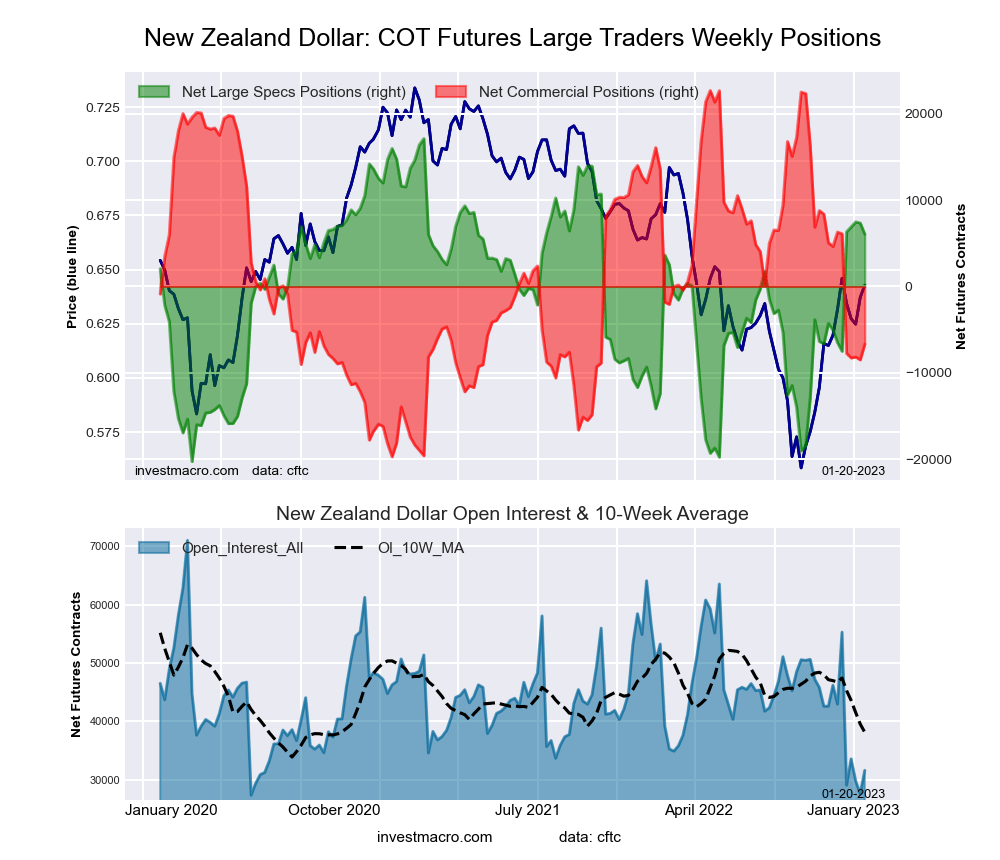
New Zealand Dollar Futures:
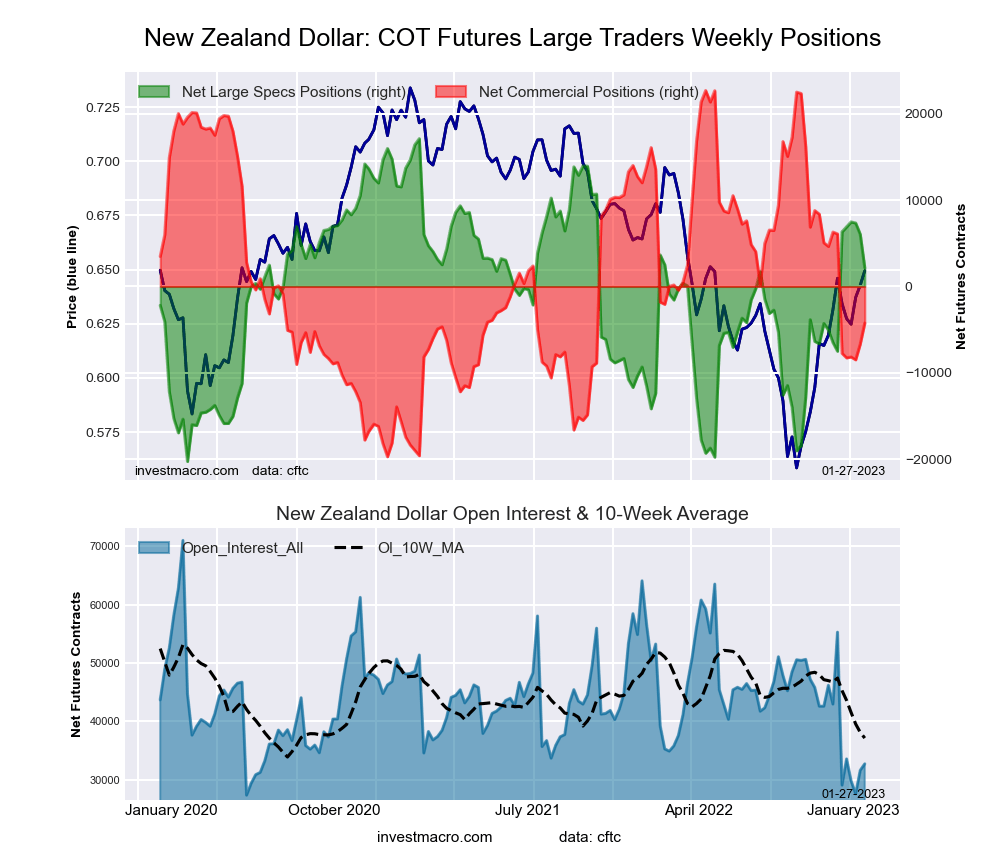 The New Zealand Dollar large speculator standing this week reached a net position of 2,174 contracts in the data reported through Tuesday. This was a weekly decrease of -3,884 contracts from the previous week which had a total of 6,058 net contracts.
This week’s current strength score (the trader positioning range over the past three years, measured from 0 to 100) shows the speculators are currently Bullish with a score of 60.0 percent. The commercials are Bearish with a score of 36.5 percent and the small traders (not shown in chart) are Bullish with a score of 75.4 percent.
| NEW ZEALAND DOLLAR Statistics | SPECULATORS | COMMERCIALS | SMALL TRADERS |
| – Percent of Open Interest Longs: | 31.1 | 50.9 | 15.5 |
| – Percent of Open Interest Shorts: | 24.4 | 63.9 | 9.2 |
| – Net Position: | 2,174 | -4,241 | 2,067 |
| – Gross Longs: | 10,170 | 16,662 | 5,077 |
| – Gross Shorts: | 7,996 | 20,903 | 3,010 |
| – Long to Short Ratio: | 1.3 to 1 | 0.8 to 1 | 1.7 to 1 |
| NET POSITION TREND: | |||
| – Strength Index Score (3 Year Range Pct): | 60.0 | 36.5 | 75.4 |
| – Strength Index Reading (3 Year Range): | Bullish | Bearish | Bullish |
| NET POSITION MOVEMENT INDEX: | |||
| – 6-Week Change in Strength Index: | 25.9 | -24.4 | 7.6 |
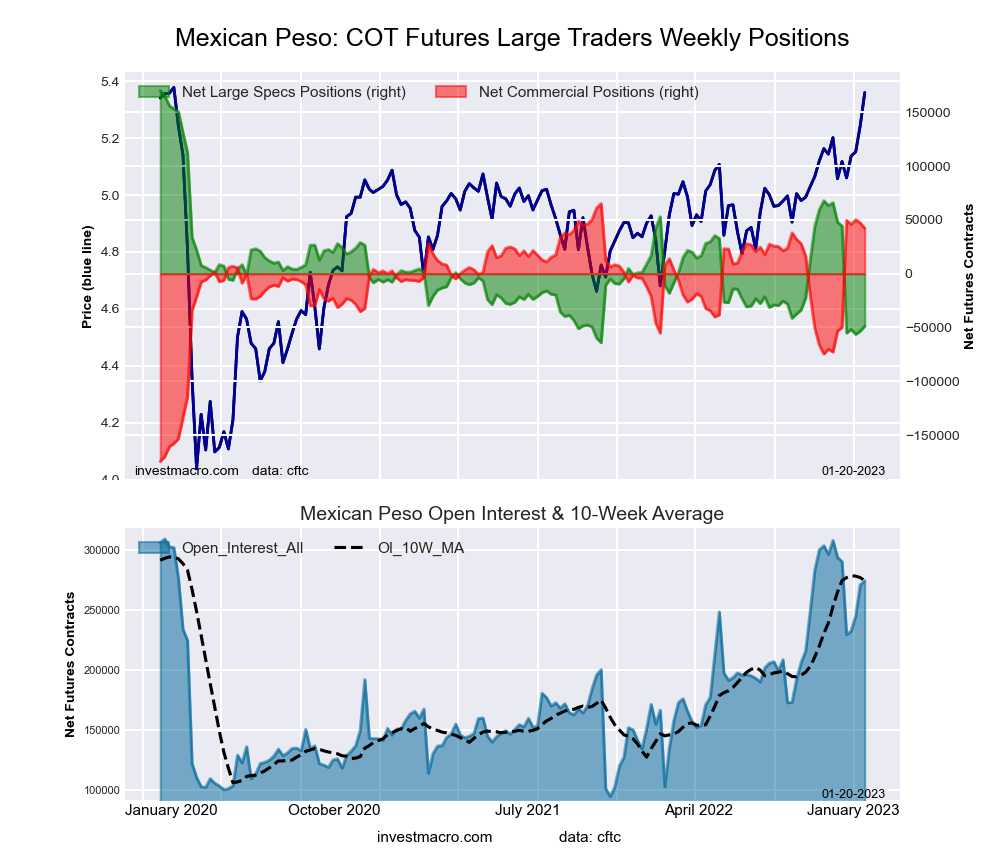
Mexican Peso Futures:
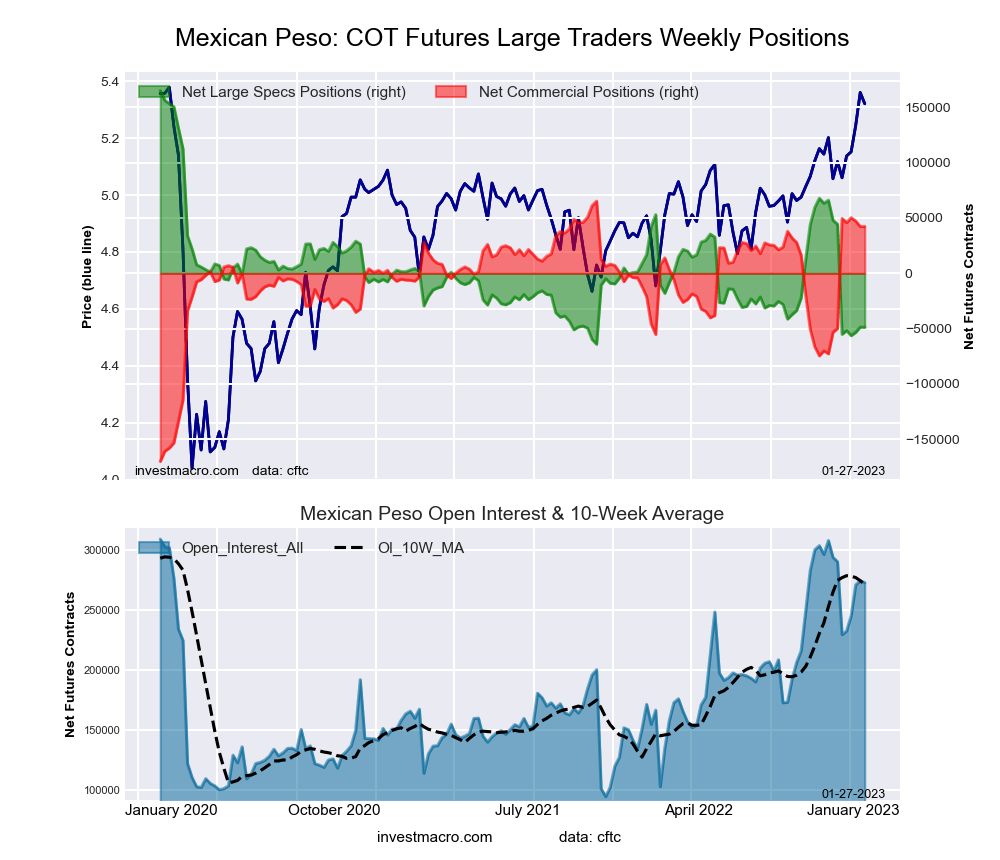 The Mexican Peso large speculator standing this week reached a net position of -48,740 contracts in the data reported through Tuesday. This was a weekly decline of -101 contracts from the previous week which had a total of -48,639 net contracts.
This week’s current strength score (the trader positioning range over the past three years, measured from 0 to 100) shows the speculators are currently Bearish-Extreme with a score of 6.7 percent. The commercials are Bullish-Extreme with a score of 90.3 percent and the small traders (not shown in chart) are Bullish-Extreme with a score of 95.3 percent.
| MEXICAN PESO Statistics | SPECULATORS | COMMERCIALS | SMALL TRADERS |
| – Percent of Open Interest Longs: | 54.4 | 42.2 | 3.2 |
| – Percent of Open Interest Shorts: | 72.3 | 26.7 | 0.8 |
| – Net Position: | -48,740 | 42,327 | 6,413 |
| – Gross Longs: | 148,265 | 115,053 | 8,628 |
| – Gross Shorts: | 197,005 | 72,726 | 2,215 |
| – Long to Short Ratio: | 0.8 to 1 | 1.6 to 1 | 3.9 to 1 |
| NET POSITION TREND: | |||
| – Strength Index Score (3 Year Range Pct): | 6.7 | 90.3 | 95.3 |
| – Strength Index Reading (3 Year Range): | Bearish-Extreme | Bullish-Extreme | Bullish-Extreme |
| NET POSITION MOVEMENT INDEX: | |||
| – 6-Week Change in Strength Index: | -40.6 | 39.2 | 5.6 |
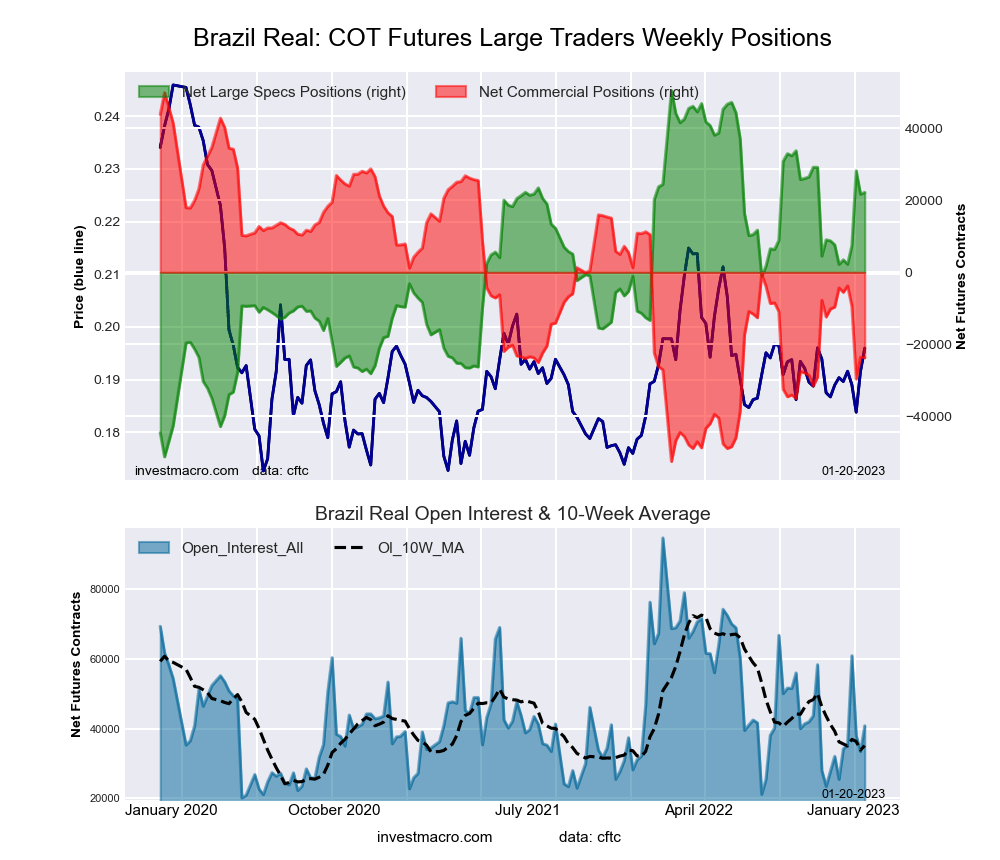
Brazilian Real Futures:
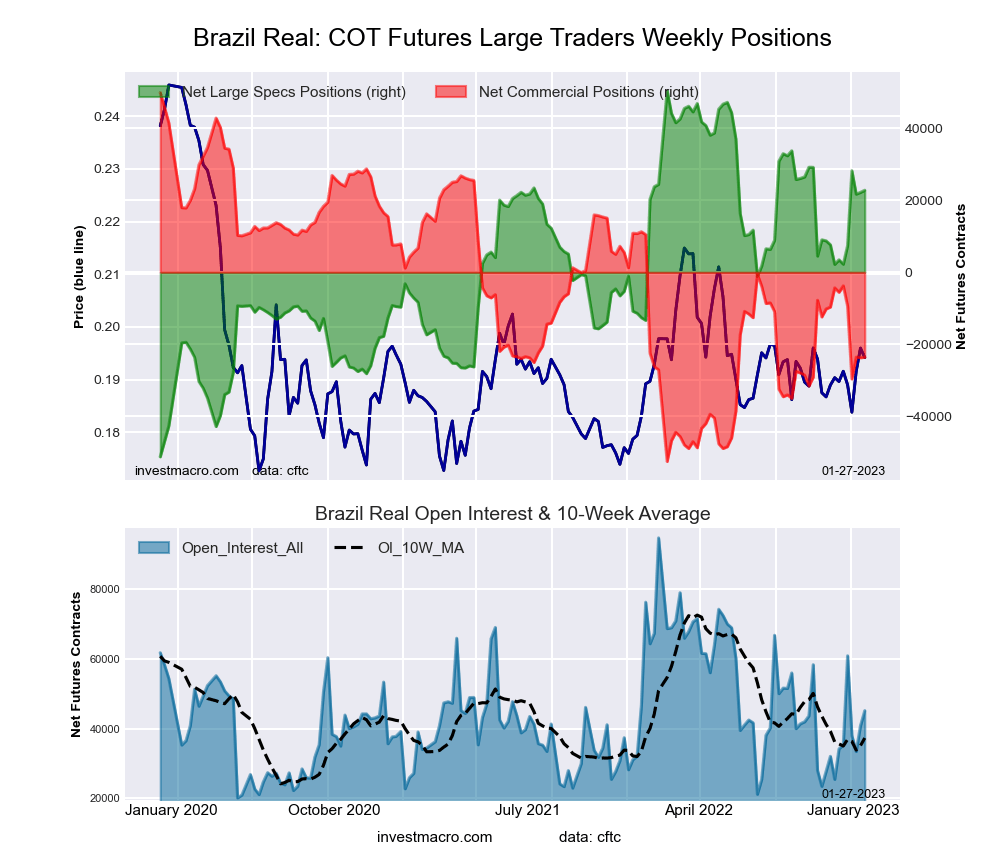 The Brazilian Real large speculator standing this week reached a net position of 22,785 contracts in the data reported through Tuesday. This was a weekly gain of 592 contracts from the previous week which had a total of 22,193 net contracts.
This week’s current strength score (the trader positioning range over the past three years, measured from 0 to 100) shows the speculators are currently Bullish with a score of 70.3 percent. The commercials are Bearish with a score of 30.3 percent and the small traders (not shown in chart) are Bullish with a score of 71.4 percent.
| BRAZIL REAL Statistics | SPECULATORS | COMMERCIALS | SMALL TRADERS |
| – Percent of Open Interest Longs: | 79.1 | 13.0 | 7.9 |
| – Percent of Open Interest Shorts: | 28.6 | 65.3 | 6.1 |
| – Net Position: | 22,785 | -23,618 | 833 |
| – Gross Longs: | 35,691 | 5,847 | 3,585 |
| – Gross Shorts: | 12,906 | 29,465 | 2,752 |
| – Long to Short Ratio: | 2.8 to 1 | 0.2 to 1 | 1.3 to 1 |
| NET POSITION TREND: | |||
| – Strength Index Score (3 Year Range Pct): | 70.3 | 30.3 | 71.4 |
| – Strength Index Reading (3 Year Range): | Bullish | Bearish | Bullish |
| NET POSITION MOVEMENT INDEX: | |||
| – 6-Week Change in Strength Index: | 20.7 | -18.9 | -14.2 |
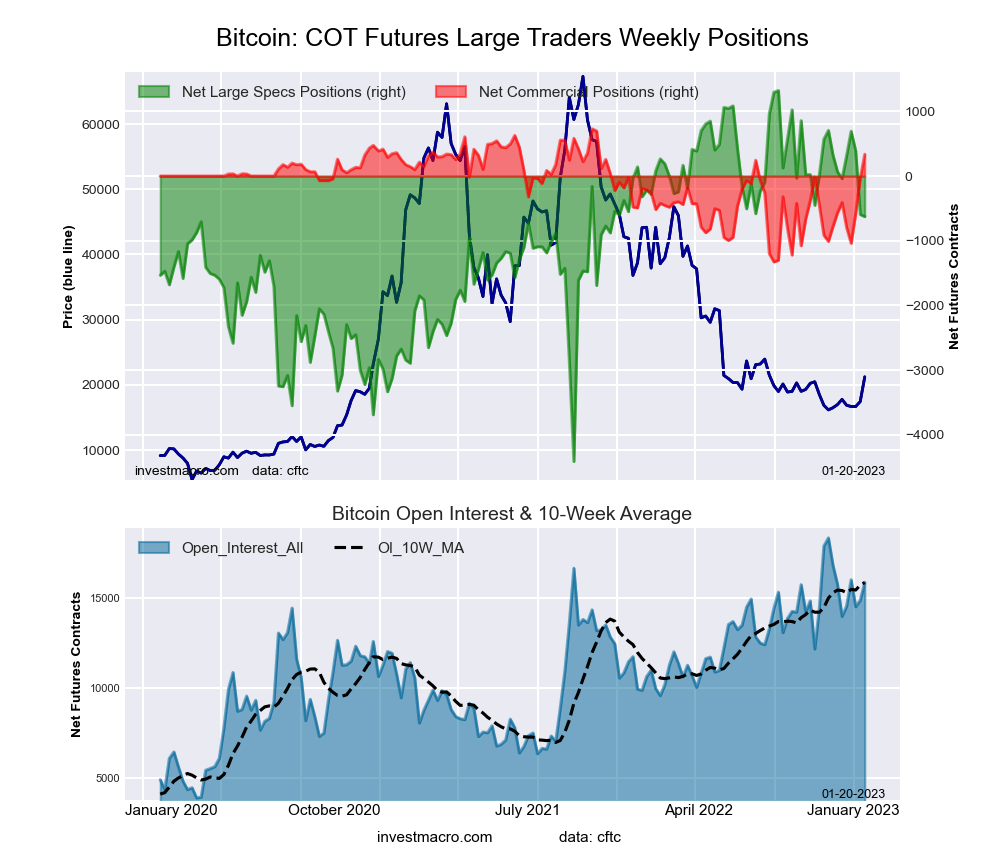
Bitcoin Futures:
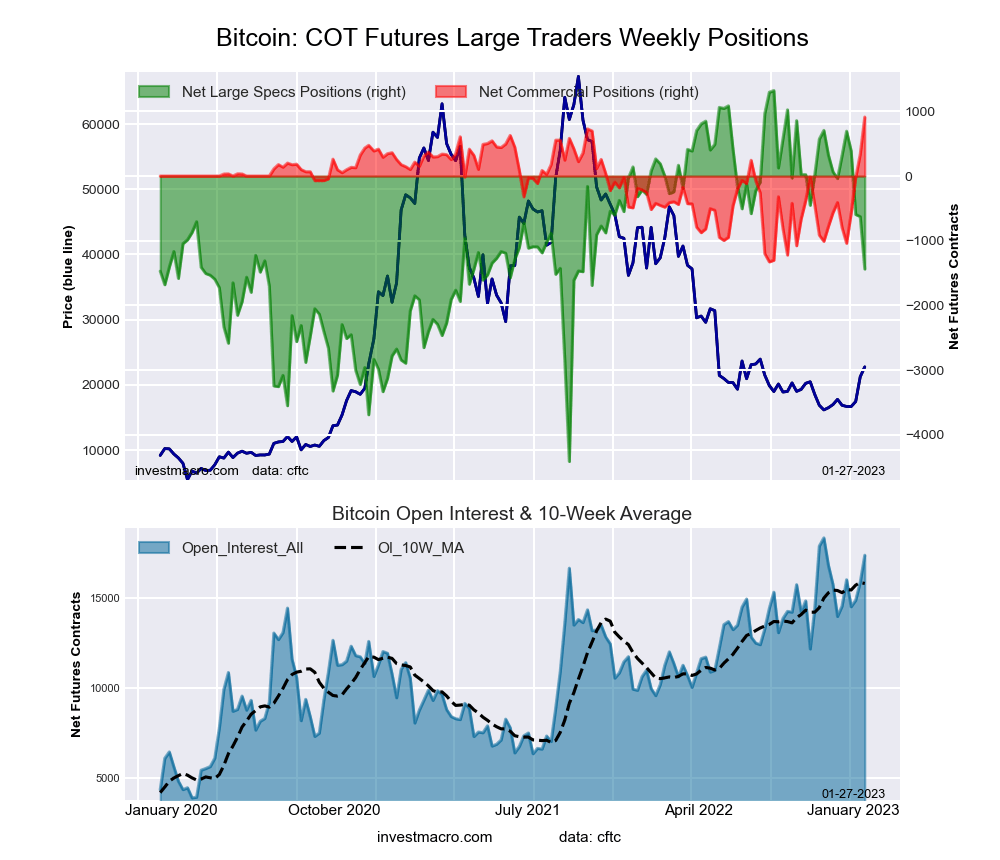 The Bitcoin large speculator standing this week reached a net position of -1,437 contracts in the data reported through Tuesday. This was a weekly decrease of -810 contracts from the previous week which had a total of -627 net contracts.
This week’s current strength score (the trader positioning range over the past three years, measured from 0 to 100) shows the speculators are currently Bullish with a score of 51.9 percent. The commercials are Bullish-Extreme with a score of 100.0 percent and the small traders (not shown in chart) are Bearish with a score of 24.9 percent.
| BITCOIN Statistics | SPECULATORS | COMMERCIALS | SMALL TRADERS |
| – Percent of Open Interest Longs: | 75.0 | 7.8 | 8.4 |
| – Percent of Open Interest Shorts: | 83.2 | 2.6 | 5.4 |
| – Net Position: | -1,437 | 912 | 525 |
| – Gross Longs: | 13,036 | 1,365 | 1,467 |
| – Gross Shorts: | 14,473 | 453 | 942 |
| – Long to Short Ratio: | 0.9 to 1 | 3.0 to 1 | 1.6 to 1 |
| NET POSITION TREND: | |||
| – Strength Index Score (3 Year Range Pct): | 51.9 | 100.0 | 24.9 |
| – Strength Index Reading (3 Year Range): | Bullish | Bullish-Extreme | Bearish |
| NET POSITION MOVEMENT INDEX: | |||
| – 6-Week Change in Strength Index: | -24.4 | 59.0 | 1.7 |
Article By InvestMacro – Receive our weekly COT Newsletter
*COT Report: The COT data, released weekly to the public each Friday, is updated through the most recent Tuesday (data is 3 days old) and shows a quick view of how large speculators or non-commercials (for-profit traders) were positioned in the futures markets.
The CFTC categorizes trader positions according to commercial hedgers (traders who use futures contracts for hedging as part of the business), non-commercials (large traders who speculate to realize trading profits) and nonreportable traders (usually small traders/speculators) as well as their open interest (contracts open in the market at time of reporting). See CFTC criteria here.


