Archive for Forex and Currency News – Page 79

Murrey Math Lines 20.01.2023 (Brent, S&P 500)

By RoboForex.com

Brent

On H4, the quotes are above the 200-day Moving Average, implying an uptrend. The RSI has risen above the resistance line. A breakaway of 8/8 (87.50) upwards should be expected, followed by growth to the resistance line of +1/8 (89.06). The scenario can be cancelled by a downward breakaway of the support level at 6/8 (84.38), which might lead to a trend reversal and falling to 4/8 (81.25).

BrentH4
Risk Warning: the result of previous trading operations do not guarantee the same results in the future

On M15, the upper line of VoltyChannel is broken away, which indicates an uptrend and increases the probability of further growth.

Brent_M15
Risk Warning: the result of previous trading operations do not guarantee the same results in the future

S&P 500

On H4, the S&P 500 index quotes has broken through the 200-day Moving Average and are now under it, which indicates probable development of a downtrend. The RSI is nearing the resistance level. As a result, a bounce off 2/8 (3906.2) should be expected, followed by falling to the support level of 1/8 (3828.1). The scenario can be cancelled by rising over 3/8 (3984.4). In this case, the quotes might rise to the resistance level of 4/8 (4062.5).

S&P500_H4
Risk Warning: the result of previous trading operations do not guarantee the same results in the future

On M15, the lower line of VoltyChannel is broken, which increases the probability of further falling of the price.

S&P500_M15

Article By RoboForex.com

Attention!
Forecasts presented in this section only reflect the author’s private opinion and should not be considered as guidance for trading. RoboForex LP bears no responsibility for trading results based on trading recommendations described in these analytical reviews.

Japanese Candlesticks Analysis 20.01.2023 (XAUUSD, NZDUSD, GBPUSD)

By RoboForex.com

XAUUSD, “Gold vs US Dollar”

At the resistance level, gold has formed a Shooting Star reversal pattern. The pair is currently going by the pattern in a descending wave. The goal of the correction might be 1915.00. Upon testing the support level, the pair may bounce off it and continue the uptrend. However, the quotes may grow to 1945.00 without testing the support level.

XAUUSD
Risk Warning: the result of previous trading operations do not guarantee the same results in the future

NZDUSD, “New Zealand Dollar vs US Dollar”

On H4, at the support level, the pair has formed a Hammer reversal pattern. Currently, the pair is going by the signal in an ascending wave. The goal of the growth might be 0.6485. After this resistance level is broken away, the quotes might get a chance to continue the uptrend. However, the price may pull back to 0.6370 before growth.

NZDUSD
Risk Warning: the result of previous trading operations do not guarantee the same results in the future

GBPUSD, “Great Britain Pound vs US Dollar”

On H4, at the resistance level, the pair has formed a Harami reversal pattern. The pair may now go by the signal in a descending wave. The goal of the correction might be the support level of 1.2310. However, the price may grow to 1.2500 and continue the uptrend without any pullback to the support level.

GBPUSD

Article By RoboForex.com

Attention!
Forecasts presented in this section only reflect the author’s private opinion and should not be considered as guidance for trading. RoboForex LP bears no responsibility for trading results based on trading recommendations described in these analytical reviews.

The Analytical Overview of the Main Currency Pairs on 2023.01.20

By JustMarkets

The EUR/USD currency pair

Technical indicators of the currency pair:
  • Prev Open: 1.0789
  • Prev Close: 1.0830
  • % chg. over the last day: +0.38 %

The ECB is still determined to keep raising rates by 50 basis points in its next meetings. At the same time, there is a growing possibility that the ECB will cut its bond holdings faster. The ECB’s December monetary policy report showed that many policymakers were initially in favor of raising the ECB’s key interest rates by 75 basis points because inflation was expected to be too high. Given the latest Eurozone inflation data, analysts are leaning toward the ECB raising rates by 50 basis points in February and March and then another 25 basis points in May, after which Europe’s Central Bank will pause for a few months.

Trading recommendations
  • Support levels: 1.0780, 1.0710, 1.0650, 1.0597, 1.0535, 1.0497, 1.0480
  • Resistance levels: 1.0846, 1.0867

The trend on the EUR/USD currency pair on the hourly time frame is still bullish. The price is forming a price corridor and is trading at the level of the moving averages. The MACD indicator has become inactive, while signs of divergence persist. Under such market conditions, buy trades are best considered from the support level of 1.0780, with confirmation on intraday time frames in the form of a false breakout of the level. Sell deals can be considered from the resistance level of 1.0846, but better with confirmation in the form of a reverse initiative.

Alternative scenario: if the price breaks down through the support level of 1.0710 and fixes below it, the downtrend will likely resume.

EUR/USD
News feed for 2023.01.20:
  • – US FOMC Member Williams Speaks at 01:35 (GMT+2).
  • – Eurozone ECB President Lagarde Speaks at 12:00 (GMT+2);
  • – US FOMC Member Harker Speaks at 16:00 (GMT+2);
  • – US Existing Home Sales (m/m) at 17:00 (GMT+2);
  • – US FOMC Member Waller Speaks at 20:00 (GMT+2).

The GBP/USD currency pair

Technical indicators of the currency pair:
  • Prev Open: 1.2345
  • Prev Close: 1.2390
  • % chg. over the last day: +0.36 %

Demand for the dollar is generally declining as markets begin to price in the scenario that the Federal Reserve is at the end of its tightening cycle, while the British pound and the euro still have “room” as the central banks in England and the ECB plan to continue raising interest rates. The economic situation in the UK is worse than in the Eurozone. The strong labor market is a positive factor for the Bank of England in the tightening cycle. But high inflation has left manufacturing activity, the service sector, and the real estate market already on the verge of recession. Economists expect the Bank of England to raise its key interest rate from 3.5% to 4% at its meeting in February.

Trading recommendations
  • Support levels: 1.2296, 1.2220, 1.2145, 1.2080, 1.2000, 1.1928, 1.1875, 1.1684
  • Resistance levels: 1.2383, 1.2446, 1.2519

From the technical point of view, the trend on the GBP/USD currency pair on the hourly time frame is bullish. The price is trading above the levels of the moving averages. The MACD indicator is in the positive zone, but the presence of divergence and the daily resistance is still limiting the further growth of quotes. Under such market conditions, it is better to look for buy trades on intraday time frames from the support level of 1.2296, but with confirmation. Sell trades are best sought from the resistance level of 1.2383 but also better with confirmation on the lower time frames.

Alternative scenario: if the price breaks down through the 1.2080 support level and fixes above it, the downtrend will likely resume.

GBP/USD
News feed for 2023.01.20:
  • – UK Retail Sales (m/m) at 09:00 (GMT+2).

The USD/JPY currency pair

Technical indicators of the currency pair:
  • Prev Open: 128.88
  • Prev Close: 128.42
  • % chg. over the last day: -0.36 %

Japan’s nationwide core consumer price index rose from 3.7% to 4.0% in annual terms, a 41-year high. While well below the still exorbitant levels of inflation in the United States, the United Kingdom, and elsewhere, the figure is well above the Bank of Japan’s 2% inflation target. Rising inflation in Japan only adds to the likelihood that the central bank will reverse the policy to a tightening cycle in the spring.

Trading recommendations
  • Support levels: 128.16, 127.53, 126.19
  • Resistance levels: 130.05, 131.34, 132.37, 132.95, 133.23, 134.45, 135.88

From the technical point of view, the medium-term trend on the currency pair USD/JPY is still bearish. The price did not manage to consolidate above the priority level, but within the day, buying pressure will prevail. The MACD indicator is positive again. It is best to look for buy trades from the support level of 128.16, but only with confirmation on intraday time frames. Sell positions can be searched from the resistance level of 130.05, provided that there is a reverse reaction.

Alternative scenario: If the price fixes above the resistance level of 131.34, the uptrend will be renewed with a high probability.

USD/JPY
News feed for 2023.01.20:
  • – Japan National Core Consumer Price Index at 01:30 (GMT+2).

The USD/CAD currency pair

Technical indicators of the currency pair:
  • Prev Open: 1.3485
  • Prev Close: 1.3466
  • % chg. over the last day: -0.14 %

The Canadian dollar is a commodity currency and is highly correlated with instruments such as the dollar index and oil prices. Oil prices increased about 1% on Thursday despite rising inventories. The main trigger for the rise is optimism about China’s opening. Oil demand in China is up nearly 1 million BPD from the previous month. The International Energy Agency said that global oil demand might reach a record high in 2023 as China lifts blockages and restrictions. Considering the current supply levels in the market, it will put upward pressure on oil prices, which will strengthen the Canadian dollar.

Trading recommendations
  • Support levels: 1.3445, 1.3396, 1.3212
  • Resistance levels: 1.3513, 1.3561, 1.3594, 1.3632, 1.3700

From the point of view of technical analysis, the trend on the USD/CAD currency pair is close to changing to a bullish one. The MACD indicator has become positive and buying pressure prevails during the day. Under such market conditions, sell transactions can be considered from the resistance level of 1.3513, but with additional confirmation in the form of a false breakout, as the level has already been tested. Buy deals should be considered from the support level of 1.3445 or 1.3396, but only with short targets and confirmation.

Alternative scenario: if the price breaks out and consolidates above the resistance level of 1.3513, the uptrend will likely resume.

USD/CAD
News feed for 2023.01.20:
  • – Canada Retail Sales (m/m) at 15:30 (GMT+2).

By JustMarkets


This article reflects a personal opinion and should not be interpreted as an investment advice, and/or offer, and/or a persistent request for carrying out financial transactions, and/or a guarantee, and/or a forecast of future events.

Dollar tumbles after disappointing US data

By ForexTime

Concerns about an incoming economic slowdown have hit markets, while continued hawkish rhetoric by Fed speakers has added to negative risk sentiment.

  • Asian stocks have traded mixed with most major indices rangebound following the negative handover from Wall Street.
  • The dollar had a choppy session yesterday on the back of the BoJ meeting and softer data and is in the red to kick off this morning’s session.
  • Gold is trying to hold onto to recent highs and remains above $1900.

Weak US economic data spurred further speculation that inflation is peaking, and policymakers may be nearing the end of their hiking cycles.

US retail sales fell more than expected, industrial production declined and US PPI also slid more than forecast.

But while slowing inflation has been a positive for markets, worries about slowing economic growth have started to bite as well.

This did actually push the DXY to new cycle lows below 102 on more dovish Fed rate expectations, with the May lows also offering immediate support to the benchmark US dollar index, for now.

A further capitulation in dollar bulls could invite bears to push the DXY into sub-100 levels.


BoJ seen to bow to the inevitable

The yen has reversed nearly all its losses from yesterday’s spike higher in USD/JPY, even after the BoJ defied hawkish speculation yesterday that it would widen its yield curve control band further.

Policymakers are seen eventually changing or abandoning the YCC policy when Governor Kuroda steps down in April after he laid the groundwork in December with only the third change to the yield cap in seven years.

That window when he hands over the baton of the BoJ governing board may herald more extreme volatility in the yen.

USD/JPY has been at the forefront of the broad dollar decline since October.

Intervention helped near the highs just shy of 152. Easing US CPI prints, especially in November saw huge moves to the downside.

The upper part of the long-term descending channel, with its series of lower highs and lower lows, was nearly touched yesterday on the spike high after the BoJ meeting, only to be repelled by USDJPY’s 21-day simple moving average (SMA).

But the sharp about-turn looks strongly bearish with funds loading up on long yen positions in anticipation of more BoJ policy changes going forward.


Forex-Time-LogoArticle by ForexTime

ForexTime Ltd (FXTM) is an award winning international online forex broker regulated by CySEC 185/12 www.forextime.com

Ichimoku Cloud Analysis 18.01.2023 (GBPUSD, USDJPY, AUDUSD)

By RoboForex.com

GBPUSD, “Great Britain Pound vs US Dollar”

The pair is testing the resistance level. The instrument is going above the Ichimoku Cloud, which implies an uptrend. A test of the Kijun-Sen line is expected at 1.2170, followed by growth to 1.2485. An additional signal confirming the growth will be a bounce off the lower border of the ascending channel. The scenario can be cancelled by a breakaway of the lower border of the Cloud and securing under 1.2005, which will entail further falling to 1.1910.

EURUSD
Risk Warning: the result of previous trading operations do not guarantee the same results in the future

USDJPY, “US Dollar vs Japanese Yen”

The currency pair is correcting in a descending channel. The instrument is going below the Cloud, which implies a downtrend. A test of the upper border of the Cloud is expected at 131.60, followed by falling to 125.45. An additional signal confirming the decline will be a bounce off the upper border of the descending channel. The scenario can be cancelled by a breakaway of the upper border of the Cloud and securing above 132.75, which will entail further growth to 133.65. The decline can be confirmed by a breakaway of the lower border of the bullish channel and securing under 129.05.

BRENT
Risk Warning: the result of previous trading operations do not guarantee the same results in the future

AUDUSD, “Australian Dollar vs US Dollar”

The currency pair is pushing off the signal lines of the indicator. The instrument is going above the Cloud, which implies an uptrend. A test of the upper border of the our is expected at 0.6840, followed by growth to 0.7125. An additional signal confirming the growth will be a breakaway of the lower border of the Cloud and securing under 0.6775, which will indicate further falling to 0.6685.

USDCAD

Article By RoboForex.com

Attention!
Forecasts presented in this section only reflect the author’s private opinion and should not be considered as guidance for trading. RoboForex LP bears no responsibility for trading results based on trading recommendations described in these analytical reviews.

Murrey Math Lines 18.01.2023 (USDJPY, USDCAD)

By RoboForex.com

USDJPY, “US Dollar vs Japanese Yen”

On H4, the quotes are under the 200-day Moving Average which indicates a downtrend. The RSI is nearing the overbought area. As a result, a bounce off 4/8 (131.25) is expected, followed by falling to the support level of 2/8 (128.12). The scenario can be cancelled by rising over the resistance level of 4/8 (131.25). In this case, the pair will continue correcting and might reach 5/8 (132.81).

AUDUSDH4
Risk Warning: the result of previous trading operations do not guarantee the same results in the future

On M15, the lower line of VoltyChannel is too far away from the current price, so falling can only be initiated by a bounce off 4/8 (131.25) on H4.

AUDUSD_M15
Risk Warning: the result of previous trading operations do not guarantee the same results in the future

USDCAD, “US Dollar vs Canadian Dollar”

On H4, the quotes are also under the 200-day Moving Average, which indicates prevalence of a downtrend. The RSI has broken through the support level. As a result, we expect a downward breakaway of 3/8 (1.3366) and falling to the support level of 2/8 (1.3305). The scenario can be cancelled by rising over the resistance level of 5/8 (1.3488), which might lead to a trend reversal and growth to 6/8 (1.3549).

NZDUSD_H4
Risk Warning: the result of previous trading operations do not guarantee the same results in the future

On M15, a breakaway of the lower line of VoltyChannel will increase the probability of further price falling.

NZDUSD_M15

Article By RoboForex.com

Attention!
Forecasts presented in this section only reflect the author’s private opinion and should not be considered as guidance for trading. RoboForex LP bears no responsibility for trading results based on trading recommendations described in these analytical reviews.

The Analytical Overview of the Main Currency Pairs on 2023.01.18

By JustMarkets

The EUR/USD currency pair

Technical indicators of the currency pair:
  • Prev Open: 1.0820
  • Prev Close: 1.0787
  • % chg. over the last day: -0.30 %

The ZEW German Economic Sentiment Index, jumped in January, outperforming the previous month’s reading. The ZEW Business Sentiment Index is considered a leading indicator of economic activity. The positive reading, the first since February 2022, indicates a marked improvement in economic conditions over the next six months, while the prospect of further declining inflation has improved expectations for consumer sectors. The ZEW index for the Eurozone also jumped. The increase in the indicators had little impact on the EUR/USD exchange rate, but there are more and more factors for a stronger euro.

Trading recommendations
  • Support levels: 1.0780, 1.0710, 1.0650, 1.0597, 1.0535, 1.0497, 1.0480
  • Resistance levels: 1.0833, 1.0875

The trend on the EUR/USD currency pair on the hourly time frame is still bullish. But the price is trading below the moving averages, rebounding from the daily resistance level. The MACD indicator has become negative, with signs of divergence persisting. Inside the day, sales begin to prevail. Under such market conditions, buy trades are best considered from the support level of 1.0780, with confirmation on intraday time frames as a false breakdown of the level. Sell deals can be considered from the resistance level of 1.0833, but better with confirmation in the form of a reverse initiative.

Alternative scenario: if the price breaks down through the support level of 1.0700 and fixes below it, the downtrend will likely resume.

EUR/USD
News feed for 2023.01.18:
  • – Eurozone Consumer Price Index (m/m) at 12:00 (GMT+2);
  • – US Retail Sales (m/m) at 15:30 (GMT+2);
  • – US Producer Price Index (m/m) at 15:30 (GMT+2);
  • – US Industrial Production (m/m) at 16:15 (GMT+2);
  • – US FOMC Member Harker Speaks at 21:00 (GMT+2).

The GBP/USD currency pair

Technical indicators of the currency pair:
  • Prev Open: 1.2194
  • Prev Close: 1.2287
  • % chg. over the last day: +0.76 %

The UK unemployment rate remained at 3.7%, but average earnings rose to 6.4% from 6.1% the previous month, the highest rate of growth. In real terms (adjusted for inflation), wages fell by 2.6%, one of the biggest declines of all time. In other words, people’s wages went up, but purchasing power went down because of record inflation. The combination of high inflation, rising wages, and a strong labor market may well incline the Bank of England to raise rates more than expected at next month’s meeting.

Trading recommendations
  • Support levels: 1.2220, 1.2145, 1.2080, 1.2000, 1.1928, 1.1875, 1.1684
  • Resistance levels: 1.2288, 1.2308, 1.2431, 1.2519

From the technical point of view, the trend on the GBP/USD currency pair on the hourly time frame is bullish. The price is slowly rising, forming narrow price corridors. As a rule, such narrowing of liquidity led to sharp impulse movements. The MACD indicator became positive, but the presence of divergence and the presence of the daily resistance level limits the further growth of quotes. Under such market conditions, it is better to look for buy deals on intraday time frames from the support level of 1.2220, but with confirmation. It is better to look for sell deals from the resistance level of 1.2288 or 1.2308, but it is also better with a confirmation in the form of a false breakout or a change in the structure on the lower time frames.

Alternative scenario: if the price breaks down through the 1.2080 support level and fixes above it, the downtrend will likely resume.

GBP/USD
News feed for 2023.01.18:
  • – UK Consumer Price Index (m/m) at 09:00 (GMT+2).

The USD/JPY currency pair

Technical indicators of the currency pair:
  • Prev Open: 128.48
  • Prev Close: 128.15
  • % chg. over the last day: -0.26 %

The Japanese yen dropped more than 2% after the Bank of Japan’s monetary policy meeting. The Bank of Japan left all policy settings unchanged. This includes the discount rate (maintained at -0.1%) and the 10-year bond yield target of around 0%. Policymakers also mentioned that they would continue to buy bonds with a degree of flexibility. This underscores the Central Bank’s intention to continue to control the yield curve as planned. This disappointed investors who had hoped for the first steps of monetary policy normalization.

Trading recommendations
  • Support levels: 129.65, 129.12, 128.09, 127.08, 126.19
  • Resistance levels: 131.34, 132.37, 132.95, 133.23, 134.45, 135.88

From the technical point of view, the medium-term trend on the currency pair USD/JPY is close to changing to bullish. The price is trading above the levels of the moving averages but below the change in priority. The MACD indicator has become positive and indicates overbought. Buy trades are best considered after a slight correction from support levels of 129.65 or 129.12, but only with intraday confirmation. Sell deals can be looked for from the resistance level of 131.34 or 132.73 on the condition of a reverse reaction or false breakout.

Alternative scenario: If the price fixes above the resistance level of 132.73, the uptrend will be renewed with a high probability.

USD/JPY
News feed for 2023.01.18:
  • – Japan BoJ Interest Rate Decision at 05:00 (GMT+2);
  • – Japan BoJ Monetary Policy Statement at 05:00 (GMT+2);
  • – Japan BoJ Outlook Report at 05:00 (GMT+2);
  • – Japan Industrial Production (m/m) at 06:30 (GMT+2);
  • – Japan BoJ Press Conference (Tentative).

The USD/CAD currency pair

Technical indicators of the currency pair:
  • Prev Open: 1.3400
  • Prev Close: 1.3388
  • % chg. over the last day: -0.09 %

In Canada, the consumer price level fell from 6.8% to 6.3% year-over-year. Core inflation (which excludes food and energy prices) also declined from 5.8% to 5.4% y/y. The decline in the cost of living was mainly due to a 13% drop in fuel prices. But food prices rose another 0.3% in the last month. While the official inflation rate is still more than double the Bank of Canada’s target, it is now at its lowest level in almost a year. Economists believe the central bank is likely to raise the benchmark interest rate by at least another 0.25%.

Trading recommendations
  • Support levels: 1.3352, 1.3212
  • Resistance levels: 1.3459, 1.3513, 1.3561, 1.3594, 1.3632, 1.3700

From the point of view of technical analysis, the trend on the USD/CAD currency pair is bearish. The price is traded in the price corridor. As a rule, such accumulation of liquidity leads to sharp impulse movements. The MACD indicator has become inactive. Under such market conditions, it is best to wait for the impulse exit and only then act. Buy trades should be considered from the support level of 1.3352, but only with short targets and confirmation. Sell deals are better to consider in the intraday time frames from the resistance level of 1.3459, but with a confirmation in the form of a reverse initiative or a false breakout.

Alternative scenario: if the price breaks out and consolidates above the resistance level of 1.3500, the uptrend will likely resume.

USD/CAD
There is no news feed for today.

By JustMarkets


This article reflects a personal opinion and should not be interpreted as an investment advice, and/or offer, and/or a persistent request for carrying out financial transactions, and/or a guarantee, and/or a forecast of future events.

Implications for the Demise of US Dollar Hegemony

Source: Michael Ballanger  (1/17/23) 

Michael Ballanger of GGM Advisory Inc. reviews the current state of the U.S. dollar to tell you where he believes it is heading.

It was only a few months ago that the world witnessed an event in the Middle East that can only be classified as a “watershed event.” For the first time since Chevron first discovered oil in the Dhahran, Saudi Arabia, a world leader not belonging to the U.S.-dominated NATO alliance, was greeted with all of the pomp and circumstance usually reserved for the United States.

When Chinese President Xi Jinping stepped off the aircraft back in December, he was greeted with such respect by Saudi leader Mohammed bin Salman that the international media made great fanfare out of it while the U.S. MSM downplayed it as if it were an inconsequential state visit.

As we move into the New Year, one of the forecasts about which I am constantly reading is the imminent arrival of the “New World Order” in which the World Economic Forum (“WEF”) led by Klaus Schwab rearranges global priorities by way of seismic changes in politics, economics, and medicine.

The spin doctors conger up images of Dr. Evil-type characters holed up in a luxurious retreat in the Swiss Alps, hovering over a map of the world as they divide up the regions like Monopoly pieces. Unfortunately, there actually is a shift occurring in the way the world works, but it lacks the theatrics of an Ian Fleming novel or a movie by James Cameron. The shift that is occurring at Hemingway-esque speed (first slowly, then suddenly in reference to his bankruptcy) is the demise of the not-so-mighty U.S. dollar.

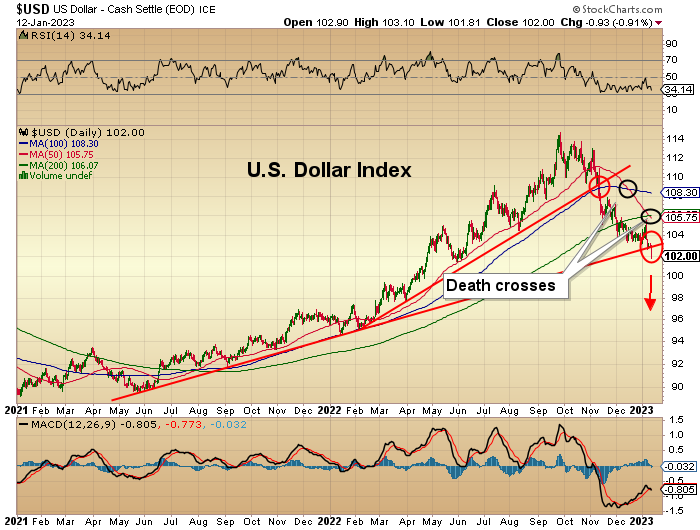
From a technical perspective, the dollar index is comprised of a basket of currencies (more appropriately referred to as a “basket-case of currencies” like the energy-starved Yen and Euro), but it generally represents the major influence on the commodity prices or as the CPI-watchers like to say “input prices.” I am focused on this because the greenback’s raging ascent, which began in the summer of 2021, put in a major top in late September of last year on the exact day that I marked the turn, which was when the Bank of England did a ferocious one-eighty and instead of selling 10-year gilts to reduce the balance sheet, they were forced to buy gilts in order to rescue their insolvent pension funds.

Since then, two uptrend lines have been vanquished at around 109 and 103, with the first of the greatly-revered “death crosses” occurring last December at around 108 and the second this week around 106. The “death cross” occurs when the one moving average crosses below the second. In this case, the 50-DMA crossed below the 100-DMA in December, with the 50-DMA crossing below the 200-DMA this week.

Historically, these are very powerful signals that speak to the longer-term trend of markets, and the reason I am focused on the dollar is that its behavior can be a predictive tool for monetary and foreign policies.

2022 was a year in which the U.S. financial press was preoccupied with inflation, and it was the CPI bogeyman that hit 9% in the third quarter that was on the minds and lips of all of the Fed governors led by numero uno inflationista Jerome Powell. In order to eliminate the embedding of the dreaded “inflationary psychology,” Powell allowed the Fed Funds rate to advance more in nine months than had ever been experienced in all the years of Federal Reserve Board’s “management” of monetary policy.

What troubles me greatly as we head into 2023 is that the inflation rate in the United States (and Canada) skyrocketed during a period in which the American currency experienced the biggest rise since 1980 and 1994. The past sixteen years have seen the USD move from the low 70’s to the recent 114-plus level allowing the strength of the dollar to negate the effect of rising input prices.

From the summer of 2021 and all through 2022, as CPI began to soar, the strong dollar should have had a moderating impact on input prices, but due to supply chain shocks and fiscal handouts in the form of “stimmy cheques,” input prices were not dulled by the strong dollar.

When I see the chart of the dollar index and ponder the ramifications of its effect upon input prices within an extended period of weakness, I have to wonder how on earth the Fed is going to launch into “pivot” mode during a period of dollar weakness. One also has to wonder how the dollar can be retreating given the typically bullish effect of rising yields on the domestic currency.

The answer lies in the ability of markets to discount future events and what I think the dollar weakness is telling us is that the American economy may no longer be the aphrodisiac for global investment flows. It may just be that the debt monster plaguing the world’s largest deadbeat nation may be the proverbial chickens coming home to roost. Foreign investors typically favor the U.S. dollar during periods when they get a preferential return on their principal; what if the new focus has morphed into a concern of the return OF their principal? Solvency is never a concern until it is one, and with the US$32 trillion debt load, there is going to be a need to refinance that debt at rates far higher than a year ago.

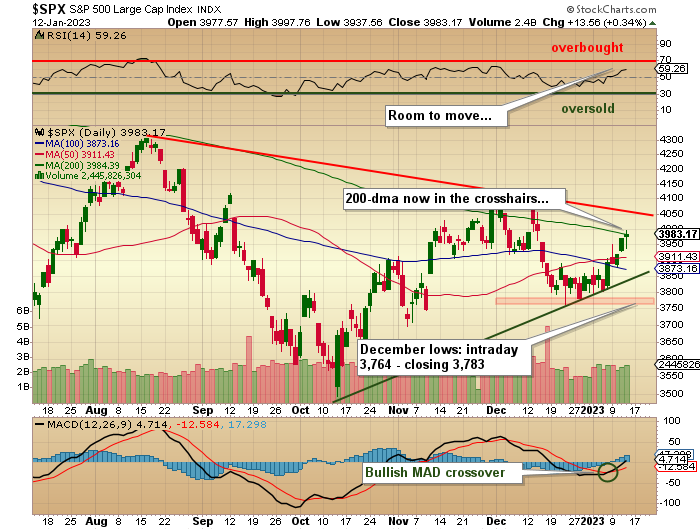
I turned positive on stocks in late September with the Bank of England now forever in my servitude as their move to save their pension funds set the theme for the balance of 2022. I wrote back in December that I was not going to call the October 13th low for the S&P at 3,491.58 as “THE” low until I watched the late December-early January tape action. Now that the Santa Claus Rally and the First Five Days indicators registered positive outcomes, I am confident that the October low was indeed the low for the bear market and that we could see an extended rally into at least the second quarter.

However, there is an indicator called the “December low indicator” that says that if the market takes out its prior December low in the first quarter of the year, then all “BUY” signals are negated, and new lows are on the horizon. The levels that I will use as a stop-loss range is between 3,783 and 3,764 (closing low and intraday low for December).

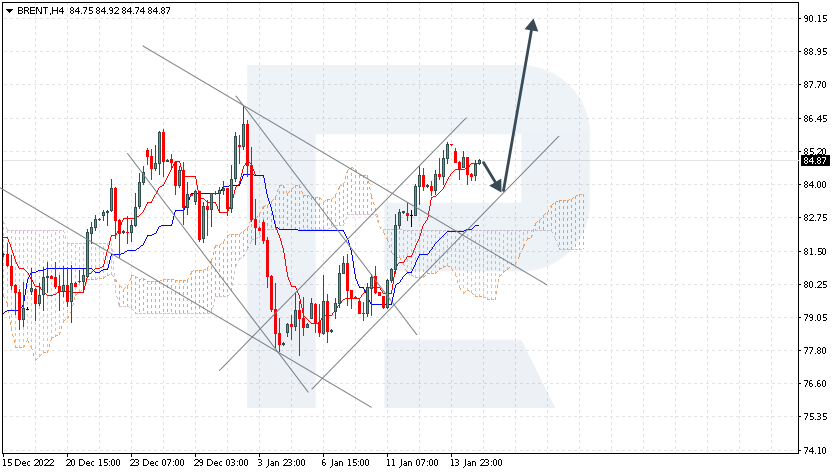
The first week of trading allowed gold to break out of an oppressive band of resistance between US$1,825 and US$1,875 after which it touched US$1,912 before succumbing to profit-taking.

Also, the relative strength indicator just poked its head above 70 and now resides in overbought territory. That does not mean gold should be sold because it can stay overbought for weeks before reversing. It does mean that one should defer new purchases until the overbought conditions get worked off.

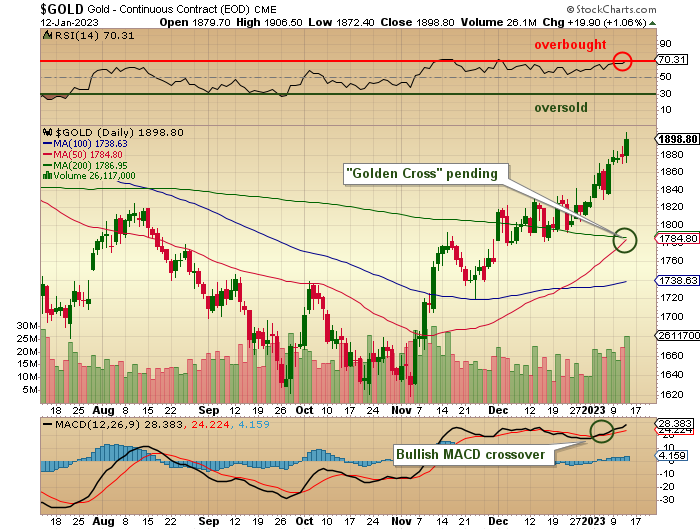
Now, despite the elevated RSI reading, the 50-DMA is about to surpass the 200-DMA, constituting a “Golden Cross” (the opposite of the “Death Cross”), and that could serve as an offset to the RSI reading. If gold can get comfortably above the US$1,900 level and stay there, we will get the cross next week, which is a powerful longer-term signal for the gold market. The next major resistance for the spot is around US$2,000, and then the all-time highs of around US$2,087.

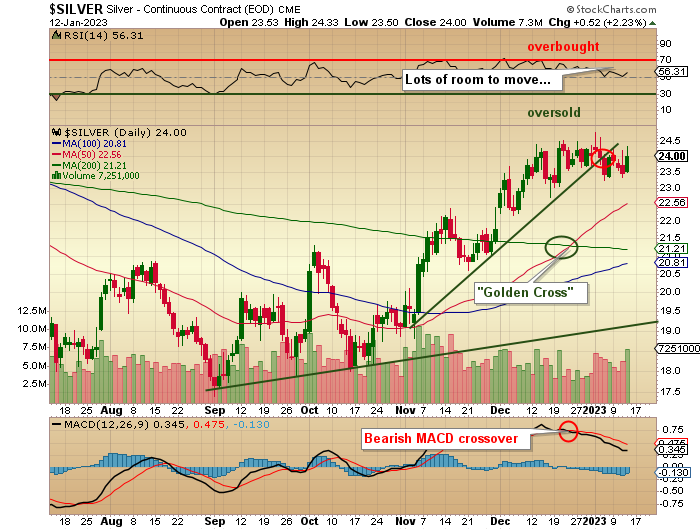
The only problem I have right now with the entire precious metals complex is that this week, unlike the period of September 27th until New Year’s, silver is underperforming gold, which is a big non-confirmation and a near-term negative. Silver usually acts as an early warning device, and when it starts to lag gold, a near-term top usually arrives for the entire complex.

There was a bearish MACD crossover (“sell signal”) just before Christmas, and since then, silver has been in a range between US$23.25 and US$24.75, with resistance sitting in the US$26.00-26.50 range. I think it resolves to the upside in Q1/2023, but it may need a retest back to the 50-DMA around US$22.70 first.

Top-rated Getchell Gold Corp. (GTCH:CSE; GGLDF:OTCQB) reported more positive drill results from Fondaway Canyon, where they have recently upgraded their resource estimate to 2,059,900 ounces of in-ground gold with all zones open along strike and to depth. I get bombarded with emails asking why the stock price continues to languish, and while it is terribly frustrating, it is perfectly understandable.

The answer lies in the recently-reported sentiment numbers for the American Association of Individual Investors (“AAII”), which came in at 20.5% bulls, one of three record-low readings for the month of December, which represented the first time it has occurred since the survey began in 1987!

The AAII is a broad representation of the average retail investor which is typically the type of investor that buys junior resource stocks. With the brutal performance of the small-cap stocks last year, the average investor is licking his/her wounds with portfolio values down savagely in many sectors.

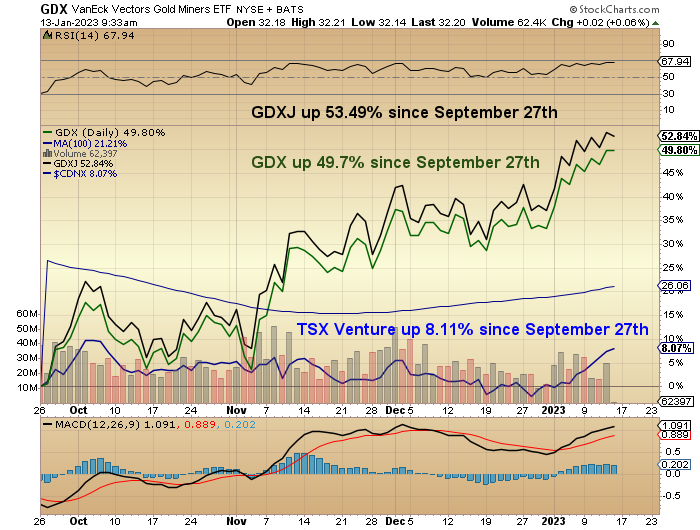
Those investors holding or buying the senior and intermediate miners (GDX/GDXJ) are ahead 49.7% and 53.49%, respectively, in those two ETF’s while the poor TSX Venture Exchange, which houses the junior developers and explorers is up a paltry 8.11% despite raging precious metals prices and copper at $4.15/pound. The microcap juniors are simply lagging behind their bigger brethren, and in time, the inevitable rotation will occur as fund flows begin to favor the little guys.

When sentiment amongst the resource investors (and the AAII) begins to heal, investment flows will move initially to those developers with a resource (such as Getchell) and then ultimately to the explorers. If one is looking for leverage, buying in-ground ounces at US$15.65 per ounce in the State of Nevada is a no-brainer which means Getchell Gold is just that.

Next week I will take the reading of the S&P on the sixteenth (Monday) which is the third of the December-January early warning numbers that I monitor. It will show a decent advance for the month (Approx. 2%) which leaves month-end as the last reading. If I get an up January, then all components of the January Barometer will have passed the test, and from at least a statistically-historical perspective, 2023 should be a bull market year. I think that 2023 will actually turn out to be a stock-picker’s market where fundamentals and valuation will be far more important than momentum or “the story.” I would welcome that with open arms.

I get frequently asked how I can be a bull when earnings are decelerating so rapidly amidst an inflationary backdrop and a hostile Fed. The only answer I have lies in a phrase that I have used for years and that is “Never underestimate the replacement power of equities (stocks) within an inflationary spiral.” From what I read and hear, there is an absolute mountain of cash on the sidelines from either real estate sales of stock market profits taken in 2021, but it is definitely out there, and I suspect that at the first sign of monetary policy relief, there will be a tsunami of buy-side volume piling into the quality names.

Michael Ballanger Disclaimer:

This letter makes no guarantee or warranty on the accuracy or completeness of the data provided. Nothing contained herein is intended or shall be deemed to be investment advice, implied or otherwise. This letter represents my views and replicates trades that I am making but nothing more than that. Always consult your registered advisor to assist you with your investments. I accept no liability for any loss arising from the use of the data contained on this letter. Options and junior mining stocks contain a high level of risk that may result in the loss of part or all invested capital and therefore are suitable for experienced and professional investors and traders only. One should be familiar with the risks involved in junior mining and options trading and we recommend consulting a financial adviser if you feel you do not understand the risks involved.

Disclosures:

1) Michael J. Ballanger: I, or members of my immediate household or family, own securities of the following companies mentioned in this article: All. I personally am, or members of my immediate household or family are, paid by the following companies mentioned in this article: My company, Bonaventure Explorations Ltd., has a consulting relationship with: None.

2) The following companies mentioned in this article are billboard sponsors of Streetwise Reports: None. Click here for important disclosures about sponsor fees. As of the date of this article, an affiliate of Streetwise Reports has a consulting relationship with: None. Please click here for more information.

3) Statements and opinions expressed are the opinions of the author and not of Streetwise Reports or its officers. The author is wholly responsible for the validity of the statements. The author was not paid by Streetwise Reports for this article. Streetwise Reports was not paid by the author to publish or syndicate this article. Streetwise Reports requires contributing authors to disclose any shareholdings in, or economic relationships with, companies that they write about. Streetwise Reports relies upon the authors to accurately provide this information and Streetwise Reports has no means of verifying its accuracy.

4) This article does not constitute investment advice. Each reader is encouraged to consult with his or her individual financial professional and any action a reader takes as a result of information presented here is his or her own responsibility. By opening this page, each reader accepts and agrees to Streetwise Reports’ terms of use and full legal disclaimer. This article is not a solicitation for investment. Streetwise Reports does not render general or specific investment advice and the information on Streetwise Reports should not be considered a recommendation to buy or sell any security. Streetwise Reports does not endorse or recommend the business, products, services or securities of any company mentioned on Streetwise Reports.

5) From time to time, Streetwise Reports LLC and its directors, officers, employees or members of their families, as well as persons interviewed for articles and interviews on the site, may have a long or short position in securities mentioned. Directors, officers, employees or members of their immediate families are prohibited from making purchases and/or sales of those securities in the open market or otherwise from the time of the decision to publish an article until three business days after the publication of the article. The foregoing prohibition does not apply to articles that in substance only restate previously published company releases.

As of the date of this article, officers and/or employees of Streetwise Reports LLC (including members of their household) own securities of Getchell Gold Corp., a company mentioned in this article.


EURUSD H4: Bears ready to pounce if Bulls fail to breach key resistance

By ForexTime

The EURUSD on the H4 time frame was in an uptrend until 16 January when a last higher top was recorded at 1.08735.

A closer look at the Momentum Oscillator reveals negative divergence between point “a” and “b” when comparing the tops at 1.08671 and 1.08735. This could have alerted technically inclined traders that the bullish trend might lose power.

After the higher top at 1.08735, the price dropped through the 15 and 34 Simple Moving Averages and the Momentum Oscillator followed by moving into bearish territory.

A possible critical support level formed when a lower bottom was recorded on 18 January at 1.07654. The bulls are currently trying to drive the price higher.

If the price of EURUSD breaks through the critical support level at 1.07654, then three possible price targets may be projected from there.

Attaching the Fibonacci tool to the lower bottom at 1.07654 and dragging it to near a resistance level that was created on 17 January at 1.08734, the following targets may be anticipated:

  • The first target can be estimated at 1.06987 (161.8%).
  • The second price target may be calculated at 1.05907 (261.8%).
  • The third and final target can be expected at 1.04160 (423.6%).

If the resistance level at 1.08734 is broken, the above scenario must be re-examined.

After all, this could be a case of Euro bulls consolidating around 1.087, before mustering enough mass to punch past the immediate resistance levels that had thwarted EURUSD’s upside since last week.


As long as the bears continue their negative mindset and supply continues overcoming demand, the outlook for the EURUSD currency pair will remain bearish.


Forex-Time-LogoArticle by ForexTime

ForexTime Ltd (FXTM) is an award winning international online forex broker regulated by CySEC 185/12 www.forextime.com

Ichimoku Cloud Analysis 17.01.2023 (EURUSD, BRENT, USDCAD)

By RoboForex.com

EURUSD, “Euro vs US Dollar”

The currency pair is pushing off the signal lines of the indicator. The instrument is going above the Ichimoku Cloud, implying an uptrend. A test of the Kijun-Sen line is expected at 1.0775, followed by growth to 1.1005. An additional signal confirming the growth will be a bounce off the lower border of the bullish channel. The scenario can be cancelled by a breakaway of the lower border of the Cloud and securing under 1.0575, which will indicate further falling to 1.0485.

EURUSD
Risk Warning: the result of previous trading operations do not guarantee the same results in the future

BRENT

Oil is testing the Tenkan-Sen line of the indicator. The instrument is going above the Ichimoku Cloud, which implies an uptrend. A test of the support area at 84.00 is expected, followed by growth to 90.00. An additional signal confirming the growth will be a bounce off the lower border of the ascending channel. The scenario can be cancelled by a breakaway of the lower border of the Cloud and securing under 77.00, which will entail further falling to 73.00.

BRENT
Risk Warning: the result of previous trading operations do not guarantee the same results in the future

USDCAD, “US Dollar vs Canadian Dollar”

The currency pair is correcting inside a Triangle pattern. The instrument is going under the Ichimoku Cloud, which implies a downtrend. A test of the resistance level at 1.3405 is expected, followed by falling to 1.3165. An additional signal confirming the decline will be a bounce off the upper border of the Triangle pattern. The scenario can be cancelled by a breakaway of the upper border of the Cloud and securing above 1.3545, which will indicate growth to 1.3635. The decline may be confirmed by a breakaway of the lower border of the Triangle pattern and securing above 1.3295.

USDCAD

Article By RoboForex.com

Attention!
Forecasts presented in this section only reflect the author’s private opinion and should not be considered as guidance for trading. RoboForex LP bears no responsibility for trading results based on trading recommendations described in these analytical reviews.