By ForexTime
The Australian Dollar has been the best-performing G10 currency against the US dollar so far in 2023.
AUDUSD currently also boasts a year-to-date advance of more than 3.7% at the time of writing.

And the Aussie’s performance could be impacted by the Reserve Bank of Australia’s first policy meeting of the year, to be held amidst these other potential market-moving events over the coming week:
Monday, February 6
- AUD: Australia January inflation, 4Q retail sales
- EUR: Germany January inflation, December factory orders; Eurozone December retail sales
Tuesday, February 7
- AUD: Reserve Bank of Australia rate decision
- EUR: Germany December industrial production
- USD: Fed Chair Jerome Powell interview
- US President Joe Biden delivers State of the Union address
Wednesday, February 8
- USD: New York Fed President John Williams speech
- Earnings by Disney, Uber
Thursday, February 9
- SEK: Sweden rate decision
- GBP: BOE Governor Andrew Bailey speech
- USD: US weekly initial jobless claims
- Pepsico quarterly earnings
Friday, February 10
- JPY: Japan January PPI
- CNH: China January CPI and PPI
- AUD: RBA releases updated quarterly economic forecasts and policy outlook
- GBP: UK December/4Q GDP, industrial production; BOE Chief Economist Huw Pill speech
- USD: US February consumer sentiment
- CAD: Canada January unemployment
The RBA is set to trigger a hike of 25 basis points (bps) next week.
If so:
- that would be the RBA’s fourth consecutive 25bps hike, and would be half the size of the 50bps hikes delivered on four separate occasions between June and September 2022.
- the RBA would’ve raised its benchmark cash rate by a cumulative 325bps over the past 12 months (assuming next week’s hike is indeed 25bps), bringing its Cash Rate Target up to 3.35% from the record low of 0.10% just 10 months ago.
In other words, next week’s hike may be the RBA’s last in a policy tightening campaign that began back in May 2022.
Why is the RBA easing up on its rate hikes?
The RBA even contemplated pausing its rate hikes even at its December policy meeting, for fear of doing too much damage to the Australian economy.
Recall that central banks hike interest rates in order to “destroy demand” and subdue inflation.
And there have been enough signs that the RBA hikes are taking their toll:
- December’s mortgage approvals slumped 4.2%, while retail sales contracted 3.9% (vs. Nov)
- Unemployment edged higher to 3.5% in December, while 14,600 jobs were lost that month
- Inflation is expected to have peaked at 8.4% in December, and should moderate over the course of 2023 (look out for the RBA’s updated forecasts on Friday, Feb 10th).
How might the RBA’s decision impact AUDUSD?
- If the RBA grows more concerned about incurring too much damage on its economy and opts for a:
- smaller-than-25bps hike next week (perhaps just 15bps?)
- leaves it cash rate unchanged, or …
- strongly suggests that the end of its rate-hiking campaign is truly close at hand
… any of the above “dovish” outcomes may prompt the unwinding of some of AUD’s stellar year-to-date gains.
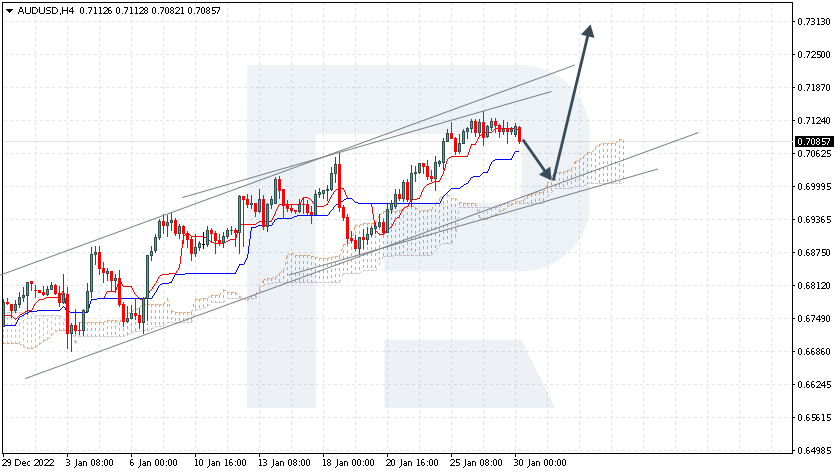
Look out for initial support at AUDUSD’s 21-day simple moving average (SMA) which currently sits just around the psychologically-important 0.7000 level.
- However, if the RBA suggests it can’t yet pause its rate hikes, given that December’s consumer price index (CPI) exceeded expectations at 8.4% to mark a 32-year high, that should translate into more AUD strength.Recall that, generally, the economy that can better withstand interest rates moving higher tends to see its currency strengthen.
Aussie bulls could then take such “hawkish” cues by the RBA to launch AUDUSD closer towards the early-June peak at 0.72830.
At the time of writing, Bloomberg’s FX model points to a 71% chance that AUDUSD trades within the 0.6925 to 0.7199 range over the next one-week period.

Why has AUD been soaring?
One word = China.
Australia is very much exposed to China, with the latter accounting for about 40% of Australia’s exports ranging from wine, lobsters, and of course, coal.
As China-Australia trade tensions thaw, the land Down Under stands to reap the benefits as the world’s second largest economy continues with its reopening.
Furthermore, the Australian economy is expected to fare much better in 2023 and be the exception to the forecasted global recession this year, as recently predicted by the IMF.
Hence, such optimism has seen AUD advance against all of its G10 peers since the start of the year, with AUDUSD yesterday punching its way to its highest levels since June, before easing slightly.
However, prices have been consolidating around the 50% Fibonacci retracement level for AUDUSD’s peak-to-trough performance over the past two years.
But before next week’s RBA decision, markets must first digest today’s US jobs report!
Note that the support/resistance levels above are derived from AUDUSD’s price action at the time this Week Ahead article is published, hours before the release of the US nonfarm payrolls due later today (Friday, February 3rd).
Signs that the US jobs market is weakening:
- lower-than-forecasted 189,000 jobs created in January
- higher-than-expected 3.6% unemployment rate
… would burnish hopes that the Fed has to pause its rate hikes sooner rather than later.
Such expectations might potentially drag the US dollar lower while offering a boost to AUDUSD.
In other words, today’s NFP report could have major sway on AUDUSD’s performance, even before the RBA would have its potential say on the Aussie.
![]() Article by ForexTime
Article by ForexTime
ForexTime Ltd (FXTM) is an award winning international online forex broker regulated by CySEC 185/12 www.forextime.com