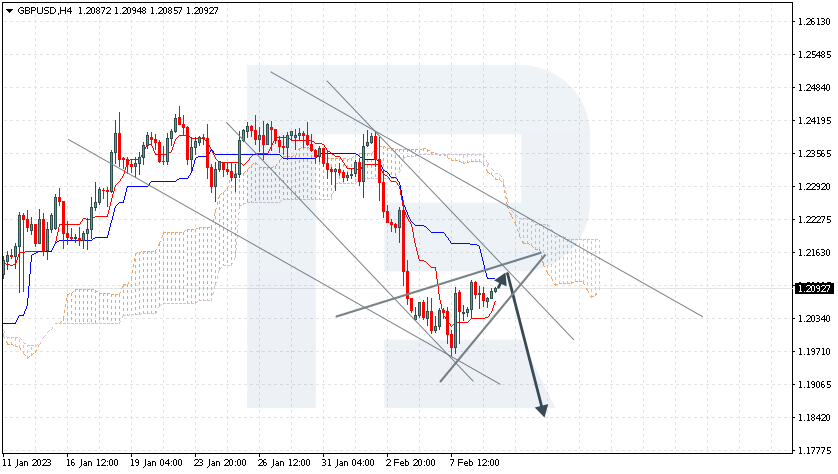
GBPUSD is correcting in a Wedge reversal pattern. The instrument is going below the Ichimoku Cloud, which suggests a downtrend. A test of the Kijun-Sen line at 1.2120 is expected, followed by falling to 1.1845. An additional signal confirming the decline will be a bounce off the upper border of the descending channel. The scenario can be cancelled by a breakaway of the upper border of the Cloud and securing above 1.2250, which will mean further growth to 1.2345. The scenario can be confirmed by a breakaway of the lower border of the Wedge and securing under 1.2035.
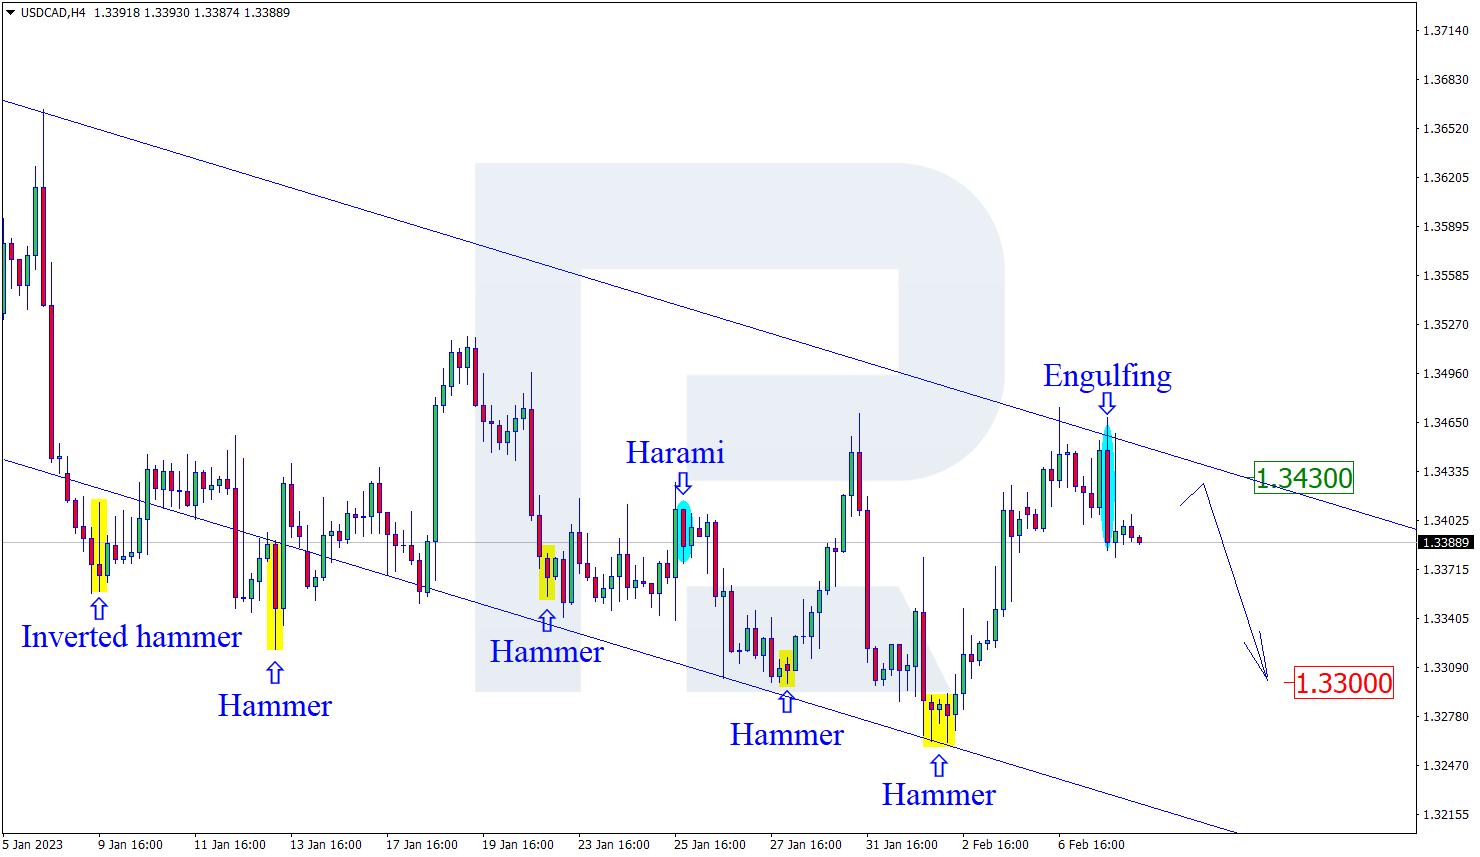
USDCAD, “US Dollar vs Canadian Dollar”
USDCAD is pushing off the resistance level. The instrument is going above the Ichimoku Cloud, which suggests an uptrend. A test of the Tenkan-Sen line of the Cloud at 1.3405 is expected, followed by growth to 1.3565. An additional signal confirming the decline will be a bounce off the lower border of the bullish channel. The scenario can be cancelled by a breakaway of the lower border of the Cloud and securing under 1.3310, which will mean further falling to 1.3205. The scenario can be confirmed by a breakaway of the upper border of the descending channel and securing above 1.3495.
AUDUSD, “Australian Dollar vs US Dollar”
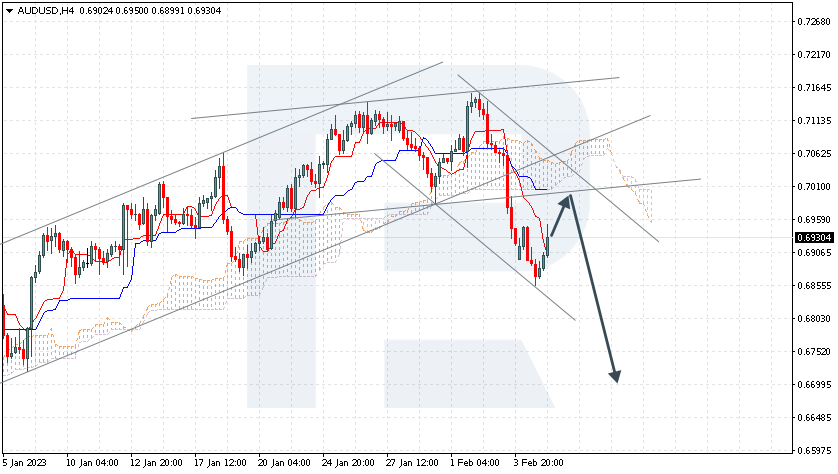
AUDUSD is growing before falling. The instrument is going below the Ichimoku Cloud, which suggests a downtrend. A test of the Kijun-Sen line at 0.6980 is expected, followed by falling to 0.6775. An additional signal confirming the decline will be a bounce off the upper border of the descending channel. The scenario can be cancelled by a breakaway of the upper border of the Cloud and securing above 0.7055, which will mean further growth to 0.7145. The decline can be confirmed by a breakaway of the lower border of the bullish channel and securing under 0.6895.
Attention! Forecasts presented in this section only reflect the author’s private opinion and should not be considered as guidance for trading. RoboForex LP bears no responsibility for trading results based on trading recommendations described in these analytical reviews.
According to the ECB Governing Council spokesman Martins Kazaks, the central bank should raise interest rates to levels that will “significantly” constrain the economy. At the same time, the politician added that rate hikes might have to be maintained after the March meeting. That said, the peak in borrowing costs will have to be maintained for some time to ensure that the eurozone’s strongest price spike is subdued. Analysts are predicting that the ECB will raise the rate by 0.5% at the March meeting and a 0.25% rate hike in May.
The trend on the EUR/USD currency pair on the hourly time frame is bearish. The price is forming a narrow corridor. But the false breakdown zone below 1.0710 works as support and does not let the price go lower. The MACD indicator has become inactive, and sellers’ pressure is weak. Under such market conditions, buy trades are best considered from the support level of 1.0710, but with confirmation since the level has already been tested. Sell deals can be considered from the resistance level of 1.0838, but better with confirmation in the form of a reverse initiative.
Alternative scenario: if the price breaks down through the resistance level of 1.0967 and fixes above it, the uptrend will likely resume.
News feed for 2023.02.09:
– German Consumer Price Index at 09:00 (GMT+2);
– Eurozone Economic Forecasts (m/m) at 12:00 (GMT+2);
– US Initial Jobless Claims (w/w) at 15:30 (GMT+2).
The GBP/USD currency pair
Technical indicators of the currency pair:
Prev Open: 1.2037
Prev Close: 1.2070
% chg. over the last day: +0.27 %
Strikes remain a problem for the UK government. On March 15, civil servants are planning another strike. On the same day, Chancellor of the Exchequer Jeremy Hunt will present his financial plan, and there will be additional pressure to revise payroll requests possibly. Since the strike is undermining the UK economy, this is a negative for the British currency. Friday’s GDP data may serve as an additional catalyst for price movement.
Trading recommendations
Support levels: 1.2059, 1.2000, 1.1930
Resistance levels: 1.2147, 1.2202, 1.2311, 1.2416
From the technical point of view, the trend on the GBP/USD currency pair on the hourly time frame is bearish. The price is trading at the level of the moving averages. A false breakdown zone was formed below the level of 1.2000. The MACD indicator has become positive. Under such market conditions, it is better to look for buy deals on intraday time frames from the support level of 1.2059 or 1.2000, but with a confirmation in the form of an impulse initiative. It is best to look for sell deals after a pullback. The best resistance levels are 1.2147 and 1.2202, but it is also better with a confirmation in the form of a reverse initiative.
Alternative scenario: if the price breaks out through the 1.2416 resistance level and fixes above it, the uptrend will likely resume.
News feed for 2023.02.09:
– UK Monetary Policy Report Hearings at 11:45 (GMT+2).
The USD/JPY currency pair
Technical indicators of the currency pair:
Prev Open: 131.05
Prev Close: 131.43
% chg. over the last day: +0.29 %
Most Japanese inflation indicators show that price growth has no signs of easing, despite the Bank of Japan holding firm to its forecast that inflation will return to the 2% target in the first half of this year. In addition, rising wage growth (+4.8%) is also raising concerns about the wage and price spiral. This inflationary pressure has sparked rumors that the Bank of Japan will simply be forced to abandon its soft monetary policy.
Trading recommendations
Support levels: 130.34, 129.68, 129.98, 129.19, 129.04, 128.16
Resistance levels: 131.58, 132.95, 133.23
From the technical point of view, the medium-term trend on the currency pair USD/JPY is bullish. The price is trading at the level of moving averages. Above the level of 131.58, a false breakout area was formed, which is now acting as resistance. The MACD indicator has become inactive. It is better to look for buy deals from the support level of 130.34 or 129.68, but only with confirmation on the lower time frames. Sell deals can be sought from the resistance level of 131.59, but it is also better with confirmation.
Alternative scenario: If the price fixes below the support level of 128.16, the downtrend will be renewed with a high probability.
There is no news feed for today.
The USD/CAD currency pair
Technical indicators of the currency pair:
Prev Open: 1.3386
Prev Close: 1.3446
% chg. over the last day: +0.35 %
Oil prices rose yesterday due to supply chain problems in Turkey because of the earthquake. In addition, the inventory data from the American Petroleum Institute (API) showed a 2.18 million barrels decline instead of a projected increase of the same amount. The Canadian dollar is a commodity currency, so rising oil prices help to strengthen the Canadian currency. However, it is always worth keeping in mind that an excessive rise in oil prices may increase inflation again.
From the point of view of technical analysis, the trend on the USD/CAD currency pair is bullish. The price is forming a wide-volatile sideways trend. The MACD indicator is positive again. Sell deals should be considered from the resistance level of 1.3442 but on the condition of a false breakout, as the level has already been tested. Buy trades can be considered from the support of 1.3385 or 1.3333, but with additional confirmation in the form of an impulse initiative.
Alternative scenario: if the price breaks down and consolidates below the support level of 1.3263, the downtrend will likely resume.
This article reflects a personal opinion and should not be interpreted as an investment advice, and/or offer, and/or a persistent request for carrying out financial transactions, and/or a guarantee, and/or a forecast of future events.
On H4, the pair has formed an Engulfing reversal pattern. The instrument is now going by the pattern in a descending wave. The goal of the decline might be 1.3300; then the price may break through the support level and continue the downtrend. However, the price may pull back to 1.3430 before falling.
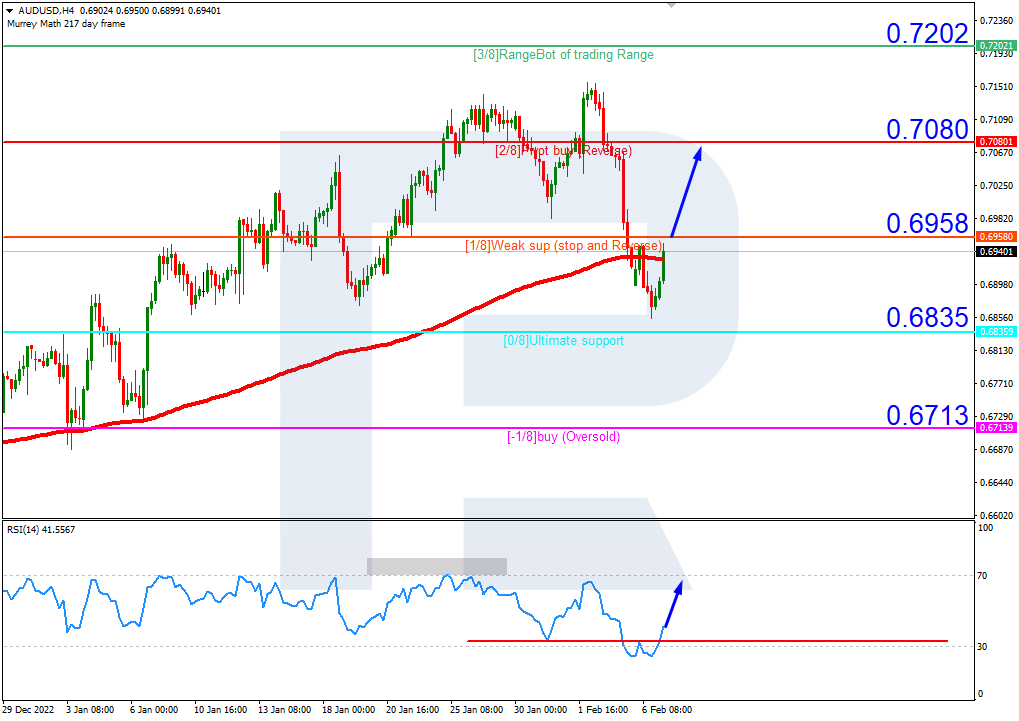
AUDUSD, “Australian Dollar vs US Dollar”
On H4, the pair has formed a Hammer reversal pattern. The instrument is now going by the signal in an ascending wave. The goal of the growth might be 0.7070. Upon testing the resistance level, the quotes might break through it and continue growing. However, the price may pull back to 0.6925 and continue the uptrend after the correction.
USDCHF, “US Dollar vs Swiss Franc”
On H4, at the resistance level, the pair has formed a Hanging Man reversal pattern. The instrument is now going by the signal in a descending wave. The goal of the decline might be 0.9155. Upon testing the support level, the pair might break through it and continue developing the downtrend. However, the price may pull back to 0.9250 before declining.
Attention! Forecasts presented in this section only reflect the author’s private opinion and should not be considered as guidance for trading. RoboForex LP bears no responsibility for trading results based on trading recommendations described in these analytical reviews.
On Tuesday, Federal Reserve Chairman Jerome Powell reiterated that inflation is slowing but reaffirmed the need for it to continue rising. Morgan Stanley predicts that the US Federal Reserve will end its tightening cycle at the May meeting at 5.00-5.25%, after which it will take a long pause. According to the Fed’s rate monitoring tool, expectations of a rate hike in March are almost entirely factored into prices, while the probability of a rate hike in May jumped from 38% to 69%.
The trend on the EUR/USD currency pair on the hourly time frame is bearish. Yesterday the price formed a false breakdown zone, which can now act as a support zone. The MACD indicator is in the negative zone, but sellers’ pressure is weak. Under such market conditions, buy trades are better to be considered from the support level of 1.0710. Sell deals can be considered from the resistance level of 1.0838, but better with confirmation in the form of reverse initiative.
Alternative scenario: if the price breaks down through the resistance level of 1.0967 and fixes above it, the uptrend will likely resume.
News feed for 2023.02.8:
– US FOMC Member Williams Speaks at 16:15 (GMT+2);
– US FOMC Member Waller Speaks at 20:45 (GMT+2).
The GBP/USD currency pair
Technical indicators of the currency pair:
Prev Open: 1.2020
Prev Close: 1.2047
% chg. over the last day: +0.22 %
Friday’s US jobs report continues to support the dollar index and, in turn, limits GBP/USD quotes recovery attempts. Market participants estimate a higher Fed peak rate for 2023 than the Bank of England (BoE). Given the problems in the UK economy, the Bank of England is much closer to completing its rate hike cycle. The Bank of England will likely hold another 0.25% hike at its next meeting, but that will not narrow the interest rate differential between the BoE and the US Fed, which is negative for the pound.
Trading recommendations
Support levels: 1.2000, 1.1930
Resistance levels: 1.2147, 1.2202, 1.2311, 1.2416
From the technical point of view, the trend on the GBP/USD currency pair on the hourly time frame is bearish. The price is trading at the level of the moving averages. A false breakdown zone was formed below the level of 1.2000. The MACD indicator has become positive. Under such market conditions, it is better to look for buy deals on intraday time frames from the support level of 1.2000, but with confirmation in the form of reverse initiative. It is best to look for sell trades after the pullback, as the price has deviated strongly from the moving averages. The best resistance levels are 1.2147 and 1.2202, but it is also better with a confirmation in the form of the reverse initiative.
Alternative scenario: if the price breaks out through the 1.2416 resistance level and fixes above it, the uptrend will likely resume.
There is no news feed for today.
The USD/JPY currency pair
Technical indicators of the currency pair:
Prev Open: 132.63
Prev Close: 131.07
% chg. over the last day: -1.19 %
Solid payroll data has once again sparked rumors that the Bank of Japan might reconsider its ultra-soft monetary policy after all. Even though it is just a rumor, the Japanese Yen managed to appreciate slightly against the dollar. A lot will depend on who becomes the next governor of the Bank of Japan. A more hawkish politician might reverse the trend in the USD/JPY currency pair, while a more dovish candidate who will continue with the current soft monetary policy will lead to even more weakness in the Japanese currency as the interest rate differential between the Bank of Japan and the US Fed continues to widen.
Trading recommendations
Support levels: 130.34, 129.98, 129.19, 129.04, 128.16
Resistance levels: 131.58, 132.95, 133.23
From the technical point of view, the medium-term trend on the currency pair USD/JPY is bullish. The price has corrected to the “discount” area but hasn’t reached the support level, which is why one more decrease in quotes is possible. The MACD indicator has become negative. It is better to look for buy deals from the support level of 130.34, but only with confirmation on the lower time frames. Sell deals can be searched from the resistance level of 131.59, but it is also better with confirmation.
Alternative scenario: If the price fixes below the support level of 128.16, the downtrend will be renewed with a high probability.
There is no news feed for today.
The USD/CAD currency pair
Technical indicators of the currency pair:
Prev Open: 1.3444
Prev Close: 1.3397
% chg. over the last day: -0.35 %
Just two weeks ago, when the Bank of Canada raised its interest rate, analysts were certain that this was the last rate hike. But yesterday, the BoC head dispelled those predictions, pointing out that it was too early to think about lowering rates, and it was not entirely clear if the Bank of Canada had raised rates enough. The Canadian dollar strengthened yesterday on the back of a 4% rise in oil prices. Oil prices were supported by continuing bets on consumption growth in China, as well as the fact that all operations at the Turkish oil export terminal with a capacity of 1 million barrels per day in Ceyhan were halted after a major earthquake. This terminal exports Azeris crude oil to international markets.
From the point of view of technical analysis, the trend on the USD/CAD currency pair is bullish. Yesterday the price formed a false break zone above the level of 1.3442, which will act as resistance. The MACD indicator has become negative, and there is slight seller pressure. Sell deals should be considered from the resistance of 1.3442 in case of a reversal in the intraday time frames since it has already been tested. Buy trades could be considered from the 1.3333 support level, but with additional confirmation in the form of an impulse initiative.
Alternative scenario: if the price breaks down and consolidates below the support level of 1.3263, the downtrend will likely resume.
This article reflects a personal opinion and should not be interpreted as an investment advice, and/or offer, and/or a persistent request for carrying out financial transactions, and/or a guarantee, and/or a forecast of future events.
On H4, the quotes have broken through the 200-day Moving Average upwards, which indicates possible development of an uptrend. The RSI has broken through the resistance line. Hence, a breakaway of 1/8 (0.6958) upwards should be expected, followed by growth to the resistance level of 2/8 (0.7080). The scenario can be cancelled by a downward breakaway of the support level of 0/8 (0.6958). In this case, the pair may drop to -1/8 (0.6713).
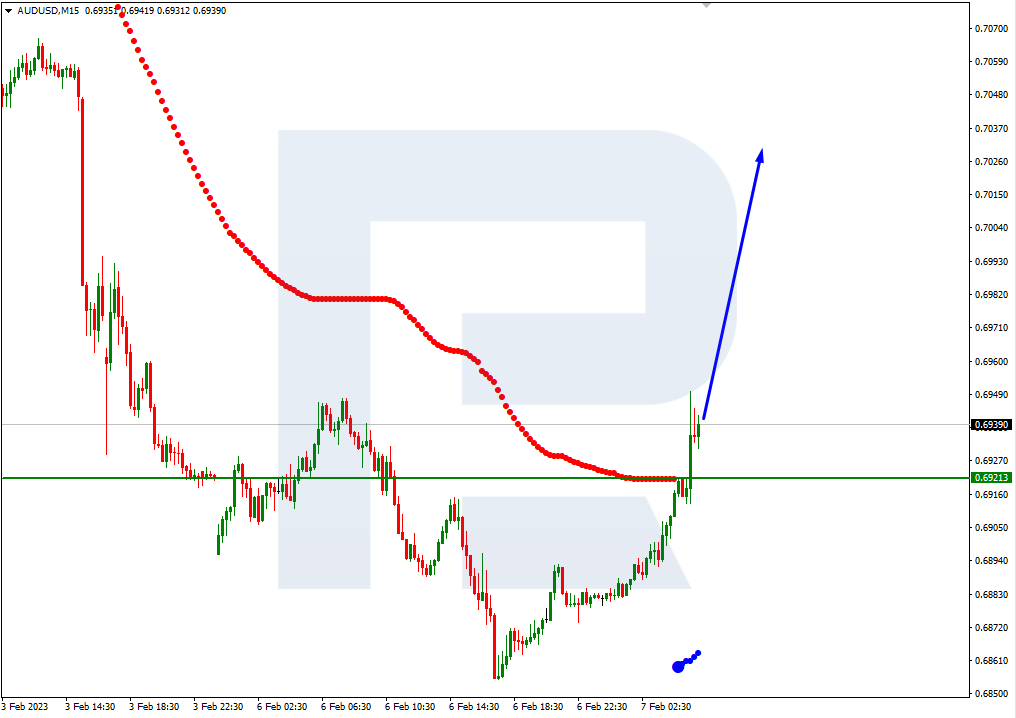
On M15, the upper border of VoltyChannel is broken away. This increases the probability of further price growth.
NZDUSD, “New Zealand Dollar vs US Dollar”
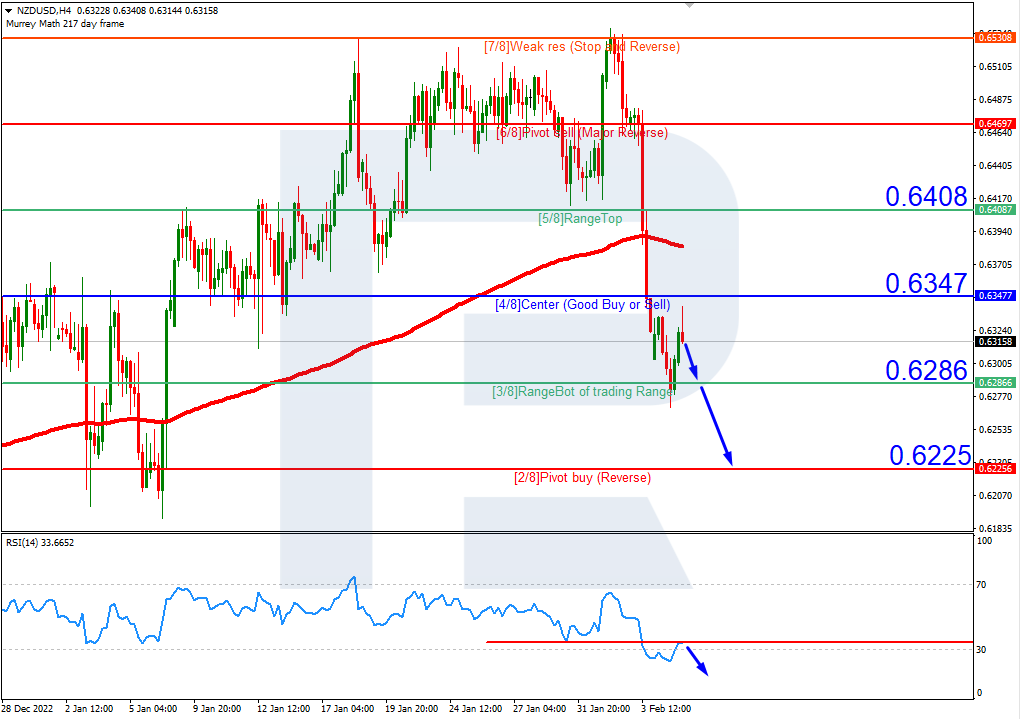
On H4, the quotes are under the 200-day Moving Average, which indicates prevalence of a downtrend. The RSI is testing the resistance line. As a result, a downward breakaway of 3/8 (0.6286) is expected, followed by falling to the support level of 2/8 (0.6225). The scenario can be cancelled by rising over the resistance level of 4/8 (0.6347). In this case, the pair may rise to 5/8 (0.6408).
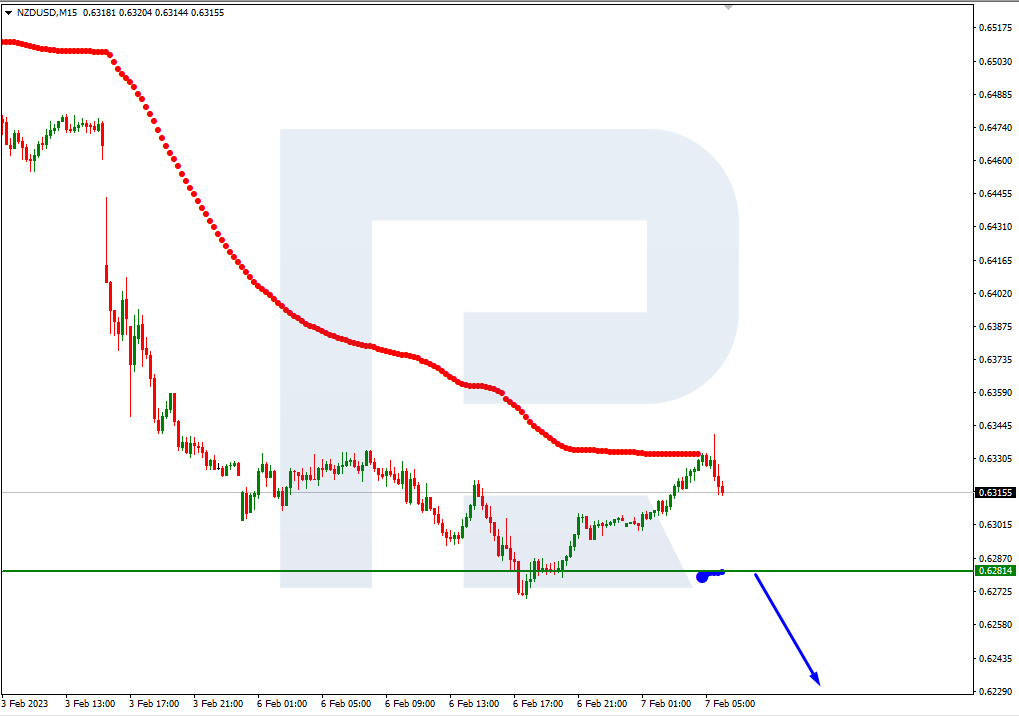
On M15, falling of the price can be additionally supported by a breakaway of the lower border of VoltyChannel.
Attention! Forecasts presented in this section only reflect the author’s private opinion and should not be considered as guidance for trading. RoboForex LP bears no responsibility for trading results based on trading recommendations described in these analytical reviews.
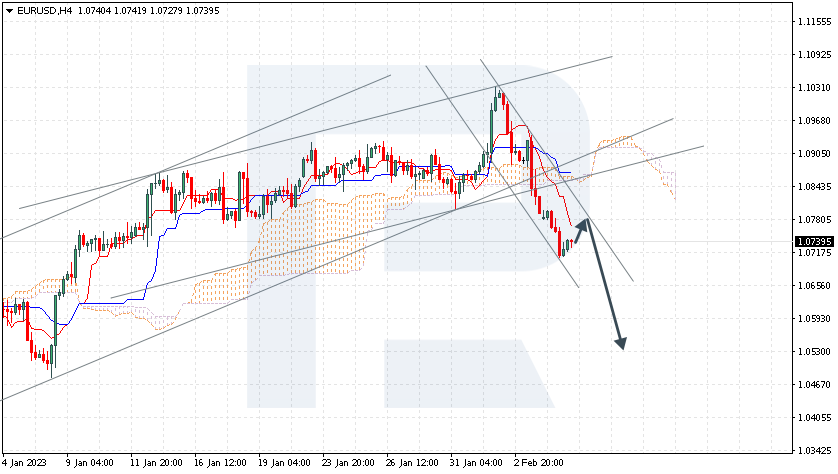
EURUSD is descending by a bearish channel. The instrument is going below the Ichimoku Cloud, which suggests a downtrend. A test of the Tenkan-Sen line at 1.0780 is expected, followed by falling to 1.0530. An additional signal confirming the decline will be a bounce off the upper border of the descending channel. The scenario can be cancelled by a breakaway of the upper border of the Cloud and securing above 1.0975, which will mean further growth to 1.1065.
GBPUSD, “Great Britain Pound vs US Dollar”
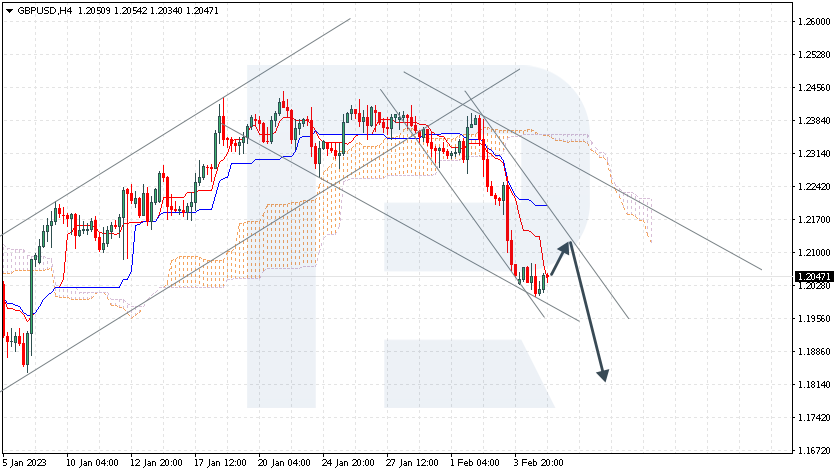
GBPUSD is testing the Tenkan-Sen line. The instrument is going below the Ichimoku Cloud, which suggests a downtrend. A test of the Kijun-Sen line at 1.2125 is expected, followed by falling to 1.1815. An additional signal confirming the decline will be a bounce off the upper border of the descending channel. The scenario can be cancelled by a breakaway of the upper border of the Cloud and securing above 1.2265, which will mean further growth to 1.2355.
AUDUSD, “Australian Dollar vs US Dollar”
AUDUSD is pushing off the signal lines of the Cloud. The instrument is going below the Ichimoku Cloud, which suggests a downtrend. A test of the lower border of the Cloud at 0.7005 is expected, followed by falling to 0.6695. An additional signal confirming the decline will be a bounce off the lower border of the bullish channel. The scenario can be cancelled by a breakaway of the upper border of the Cloud and securing above 0.7115, which will mean further growth to 0.7205.
Attention! Forecasts presented in this section only reflect the author’s private opinion and should not be considered as guidance for trading. RoboForex LP bears no responsibility for trading results based on trading recommendations described in these analytical reviews.
The dollar jumped to a four-week high against the euro on Monday. Unexpectedly strong US jobs data last week raised the possibility that the US Federal Reserve will continue to raise interest rates to fight inflation. This news is still being “digested” by market participants. But it should be noted that despite the hawkish statements of the US Fed representatives, the ECB also continues to raise rates aggressively and plans to make another 0.5% increase in March. Therefore, traders should not count on a prolonged EUR/USD downtrend.
The trend on the EUR/USD currency pair on the hourly time frame has changed to bearish. The price is trading below the moving averages. The MACD indicator is deeply negative, but there are the first signs of divergence. Under such market conditions, waiting for a small pullback is best, as the price has deviated strongly from the moving averages. Buy trades are best considered from the support level of 1.0710, but confirmation in the form of a reverse reaction on the lower time frames is needed. Sell deals can be considered from the resistance level of 1.0838, but it is also better with confirmation in the form of a reverse initiative.
Alternative scenario: if the price breaks down through the resistance level of 1.0967 and fixes above it, the uptrend will likely resume.
News feed for 2023.02.07:
– German Industrial Production (m/m) at 09:00 (GMT+2);
– US Trade Balance (m/m) at 15:30 (GMT+2);
– US Fed Chair Powell Speaks at 19:00 (GMT+2).
The GBP/USD currency pair
Technical indicators of the currency pair:
Prev Open: 1.2029
Prev Close: 1.2020
% chg. over the last day: -0.07 %
The British pound has been showing weakness lately. Economic data has not been strong enough to strengthen the pound compared to its peers, while ongoing strikes and the threat of more strikes in the coming weeks undermine sentiment. A recent International Monetary Fund (IMF) update indicated that the UK economy would contract by 0.6% this year, almost one percentage point below their previous estimate.
From the technical point of view, the trend on the GBP/USD currency pair on the hourly time frame has changed to bearish. The price is trading below the moving averages. The MACD indicator is in the negative zone, but there are the first signals of divergence. Under such market conditions, it is better to look for buy trades on intraday time frames from the support level of 1.2035, but with confirmation in the form of reverse initiative. It is best to look for sell deals after a slight pullback, as the price has strongly deviated from the moving averages. The best resistance levels are 1.2147 and 1.2228, but it is also better with a confirmation in the form of the reverse initiative.
Alternative scenario: if the price breaks out through the 1.2416 resistance level and fixes above it, the uptrend will likely resume.
There is no news feed for today.
The USD/JPY currency pair
Technical indicators of the currency pair:
Prev Open: 132.39
Prev Close: 132.63
% chg. over the last day: +0.18 %
The Nikkei newspaper, citing anonymous sources in the government and the ruling party, reported yesterday that Masayoshi Amamiya, deputy governor of the Bank of Japan, is running for the post of the next governor. According to Saxo strategists, Amamiya is considered the most “dovish” among the contenders. Market participants believe that Amamiya will continue Governor Kuroda’s soft stimulus policy. The Japanese yen rapidly declined against the dollar on the back of this news.
Trading recommendations
Support levels: 131.11, 130.34, 129.98, 129.19, 129.04, 128.16
Resistance levels: 132.95, 133.23
From the technical point of view, the medium-term trend on the currency pair USD/JPY has changed to bullish. The price strongly deviated from the moving averages. The MACD indicator is in the positive zone with signs of overbuying and divergence, which limits the further growth of quotes. It is better to look for buy deals after a slight correction to the support levels in the “discount” zone – 130.34 or 129.19, but only with a confirmation on the lower time frames. At least, it is necessary to wait for the correction to the level of 131.11. Sell deals can be sought after an impulse return below the psychological level of 132.00, which will form a false breakout area above the level.
Alternative scenario: If the price fixes below the support level of 128.16, the downtrend will be renewed with a high probability.
There is no news feed for today.
The USD/CAD currency pair
Technical indicators of the currency pair:
Prev Open: 1.3309
Prev Close: 1.3445
% chg. over the last day: +1.02 %
Yesterday’s business activity data from Ivey showed a high jump from August 2022. Despite the rise in business activity, this might be the first sign of trouble ahead for Canada’s Central Bank. Increased business activity could lead to increased demand and spending by consumers, which could have an indirect effect on inflation. The Canadian dollar also remains under pressure due to uncertainty in the oil market. The outlook for the Canadian dollar in 2023 will largely depend on commodity prices, how the US dollar behaves, and whether central banks manage to avoid a major recession.
From the point of view of technical analysis, the trend on the USD/CAD currency pair has changed to bullish. But the price reached the daily resistance level of 1.3472 and slightly corrected to the moving averages, breaking through the trend line. The MACD indicator is in the positive zone, but there are first signs of weakness. Sell deals should be considered from the resistance level of 1.3434 in case of a reversal in the intraday time frames. Buy trades can be considered from the 1.3333 support level, but with additional confirmation in the form of an impulse initiative.
Alternative scenario: if the price breaks down and consolidates below the support level of 1.3263, the downtrend will likely resume.
News feed for 2023.02.07:
– Canada Trade Balance (m/m) at 15:30 (GMT+2);
– Canada BoC Gov Macklem’s Speech at 19:30 (GMT+2).
This article reflects a personal opinion and should not be interpreted as an investment advice, and/or offer, and/or a persistent request for carrying out financial transactions, and/or a guarantee, and/or a forecast of future events.
On H4, the quotes are above the 200-day Moving Average, indicating prevalence of an uptrend. The RSI is nearing the oversold area. Currently, we expect a test of 4/8 (1.0742), a bounce off it, and growth to the resistance level of 5/8 (1.0742). The scenario can be cancelled by a downward breakaway of the support level of 4/8 (1.0742), in which case the trend might reverse, and the price may drop to 3/8 (1.0620).
On M15, an additional signal confirming growth of the price will be a breakaway of the upper border of VoltyChannel.
GBPUSD, “Great Britain Pound vs US Dollar”
On H4, the quotes have broken through the 200-day Moving Average and are now below it, which indicates possible development of a downtrend. However, the RSI is in the oversold area. As a result, the quotes are expected to rise above 3/8 (1.2085) and then reach the resistance level of 4/8 (1.2207). The scenario can be cancelled by a downward breakaway of 2/8 (1.1962). In this case, the quotes should keep falling and reach 1/8 (1.1840).
On M15, a breakaway of the upper border of VoltyChannel will increase the probability of price growth to 4/8 (1.2207) on H4.
Attention! Forecasts presented in this section only reflect the author’s private opinion and should not be considered as guidance for trading. RoboForex LP bears no responsibility for trading results based on trading recommendations described in these analytical reviews.
On Monday, the market major is neutral near 1.0800. The market has got all the info at hand: the decision of the Federal Reserve System to lift the interest rate by 25 base points and the confirmation of the ECB mood for it has lifted the rate by 50 base points.
The Fed will go on lifting the rate smoothly but is “mentally” preparing to put an end to the cycle. As for the ECB, it is decisive about lifting the rate until it gets inflation under control. As long as it lost quite a lot of time on monitoring the situation, things look quite logical.
The US employment market in January proved strong. The unemployment rate dropped to 3.4%, average wage grew by 0.3% m/m as expected. 517 thousand new workplaces were created by the NFP report, which is much more than forecast. The data taken together gave great support to the USD.
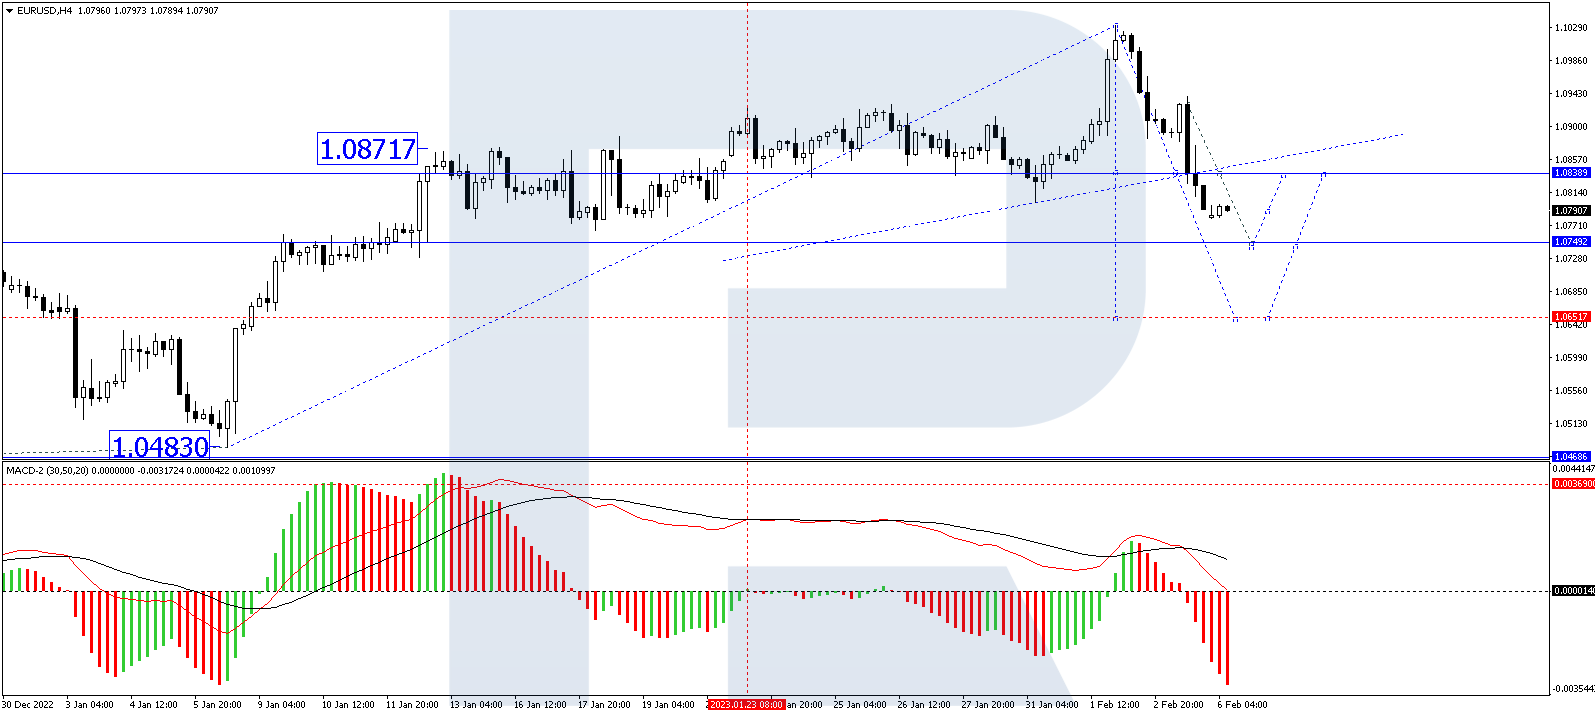
On H4, EURUSD has completed a wave of decline to 1.0840. Practically, this level has become a breakthrough for the ascending channel. At the moment, the market formed a consolidation range around this point, and with an escape downwards it opened a pathway for decline to 1.0750. After it is reached, a correction to 1.0840 should follow, and after that – a decline to 1.0650. Technically, this scenario is confirmed by the MACD. Its signal line is heading strictly downwards, getting ready to break through the zero level.
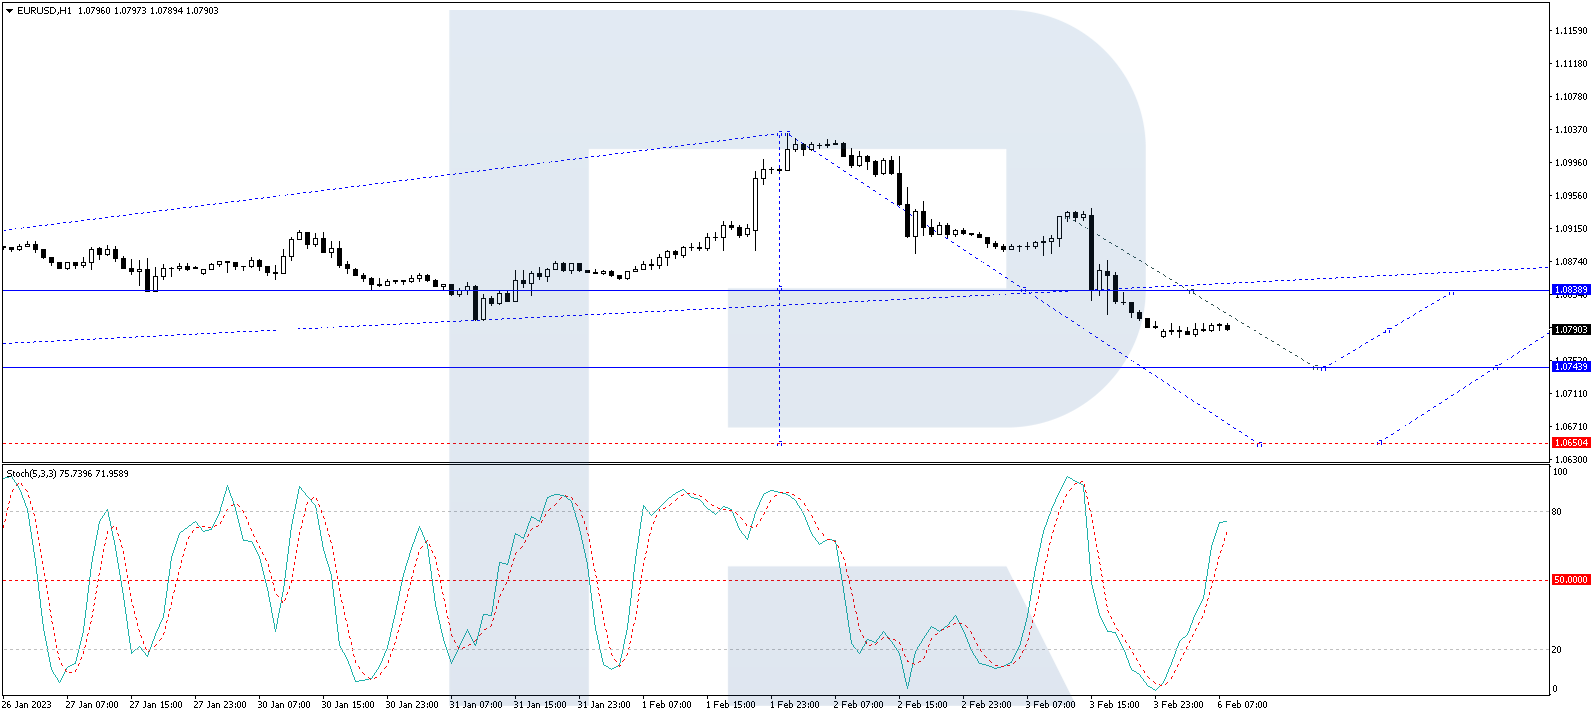
On H1, the pair has formed a structure of a consolidation range around 1.0840. With an escape downwards, a pathway for decline to 1.0750 will open. Then a correction up to 1.0840 and a decline to 1.0650 should follow. Technically, this scenario is confirmed by the Stochastic oscillator. Its signal line is above 50. A decline to 20 is expected.
Disclaimer
Any forecasts contained herein are based on the author’s particular opinion. This analysis may not be treated as trading advice. RoboForex bears no responsibility for trading results based on trading recommendations and reviews contained herein.
According to the US Bureau of Labor Statistics, total Nonfarm Payrolls rose by 517K in January (forecast 190K, forecast 223K), and the unemployment rate declined to 3.4% (forecast 3.6%, forecast 3.5%). The very strong labor market data leaves more leeway for the US Federal Reserve to keep raising rates. This brought panic back into the market as investors rushed to sell stocks and buy dollars. Financial markets are currently pricing in another 25 basis point rate hike at the US Fed’s March meeting and another 50 basis point hike from the ECB. In the medium term, a reduction in the interest rate spread should play for the European currency’s strengthening.
The trend on the EUR/USD currency pair on the hourly time frame has changed to bearish. The price broke through the priority change level and consolidated lower. The MACD indicator is deeply negative, with no signs of a reversal. Under such market conditions, it is best to wait for a small pullback as the price has deviated strongly from the moving averages. Buy trades are best considered from the support level of 1.0781, but confirmation in the form of a reversal on the lower time frames is needed. Sell deals can be considered from the resistance level of 1.0838, but it is also better with confirmation in the form of a reverse initiative.
Alternative scenario: if the price breaks down through the resistance level of 1.0967 and fixes above it, the uptrend will likely resume.
News feed for 2023.02.06:
– Eurozone Retail Sales (m/m) at 12:00 (GMT+2);
– ECB President Lagarde’s Speech at 20:00 (GMT+2).
The GBP/USD currency pair
Technical indicators of the currency pair:
Prev Open: 1.2224
Prev Close: 1.2052
% chg. over the last day: -1.43 %
The Bank of England said last week that the UK is still set for a recession this year, but it will probably not be as deep as previously feared because of falling energy prices and weaker market interest rate expectations. Analysts believe that the current rate level of 4% may be the cap rate for the UK. The Monetary Policy Committee of England (MPC) abandoned the wording “may require a further increase in the bank rate,” which was constantly present in the meeting minutes. But everything will depend on the next inflation and GDP data. If inflation proves to be more robust and widespread, the Bank of England may hold another rate hike.
Trading recommendations
Support levels: 1.2035, 1.2000, 1.1930
Resistance levels: 1.2182, 1.2228, 1.2311, 1.2416
From the technical point of view, the trend on the GBP/USD currency pair on the hourly time frame has changed to bearish. The price declined sharply on the news on Friday and consolidated below the priority change level. The MACD indicator is in the negative zone with no signs of a reversal. Under such market conditions, it is better to look for buy trades on intraday time frames from the support level of 1.2000, but with confirmation in the form of a reverse initiative. It is best to look for sell deals after the pullback, as the price has deviated strongly from the moving averages. The best resistance levels are 1.2147 and 1.2228, but it is also better with a confirmation in the form of the reverse initiative.
Alternative scenario: if the price breaks out through the 1.2416 resistance level and fixes above it, the uptrend will likely resume.
News feed for 2023.02.06:
– UK Construction PMI (m/m) at 11:30 (GMT+2).
The USD/JPY currency pair
Technical indicators of the currency pair:
Prev Open: 128.65
Prev Close: 131.18
% chg. over the last day: +1.96 %
A sharp jump in the dollar index on the back of strong US labor market data led to an increase in USD/JPY quotes on Friday. The US Fed has more leeway to raise rates further, while the Bank of Japan continues to hold rates at negative levels and maintain its stimulative policy, even though inflation in the country is at a 42-year high and is expected to rise further. An increase in the interest rate differential will have a negative impact on the Japanese Yen, with Japan’s GDP growth not being able to offset this impact.
Trading recommendations
Support levels: 129.98, 129.19, 129.04, 128.16
Resistance levels: 132.37, 132.95, 133.23
From the technical point of view, the medium-term trend on the currency pair USD/JPY has changed to bullish. The price strongly deviated from the moving averages. The MACD indicator is in the positive zone with signs of overbought but without divergence. It is better to look for buy trades after a slight correction to the support levels in the “discount” zone — 129.98 or 129.19, but only with confirmation on the lower time frames. At a minimum, it is necessary to wait for the correction to the level of 131.10. Sell deals can be sought after the impulse return of the price below the level of 131.58, which will form a false breakout area above the level.
Alternative scenario: If the price fixes below the support level of 128.16, the downtrend will be renewed with a high probability.
There is no news feed for today.
The USD/CAD currency pair
Technical indicators of the currency pair:
Prev Open: 1.3314
Prev Close: 1.3389
% chg. over the last day: +0.64 %
The Canadian dollar is a commodity currency and is dependent on instruments such as the dollar index and oil. Oil prices dropped sharply on Friday on the back of a stronger dollar index. The market is also pressured by sanctions on Russian oil products, which came into force on February 5. At the same time, traders should not forget about oil reserves, which have reached their highest level since the summer of 2021. What’s next? China’s opening continues. Hence traders should expect demand to increase. Russian oil will be limited in price, and the amount of Russian oil on the market will decrease. All this might lead to a new jump in oil prices, but only after the strategic reserves start to decline.
From the point of view of technical analysis, the trend on the USD/CAD currency pair is bearish. But the price is close to the priority change level, and the buyers prevail inside the day. The MACD indicator is in the positive zone, but there are the first signs of weakness. Sell deals should be considered from the resistance level at 1.3424 or 1.3448 in case there is a reversal in the intraday time frames. Buy trades could be considered from the 1.3333 support level, but with additional confirmation in the form of an impulse initiative.
Alternative scenario: if the price breaks out and consolidates above the resistance level of 1.3424, the uptrend will likely resume.
This article reflects a personal opinion and should not be interpreted as an investment advice, and/or offer, and/or a persistent request for carrying out financial transactions, and/or a guarantee, and/or a forecast of future events.