By JustMarkets
The EUR/USD currency pair
- Prev Open: 1.0718
- Prev Close: 1.0735
- % chg. over the last day: +0.16 %
The US inflation rate declined from 6.5% to 6.4% (forecast 6.2%) annually, while core inflation, which excludes food and energy prices, also declined from 5.7% to 5.6% (forecast 5.5%). Although inflationary pressures are easing, the fall in inflation is not happening as quickly as the US Federal Reserve had predicted. This factor increases the likelihood that the US Fed will hold one or two more interest rate hikes before pausing. Therefore, in the short term, the dollar has fundamental reasons to strengthen. On the other hand, the ECB is now acting more aggressively than the US Fed, and the narrowing of the interest rate differential should play in favor of a stronger euro in the medium term.
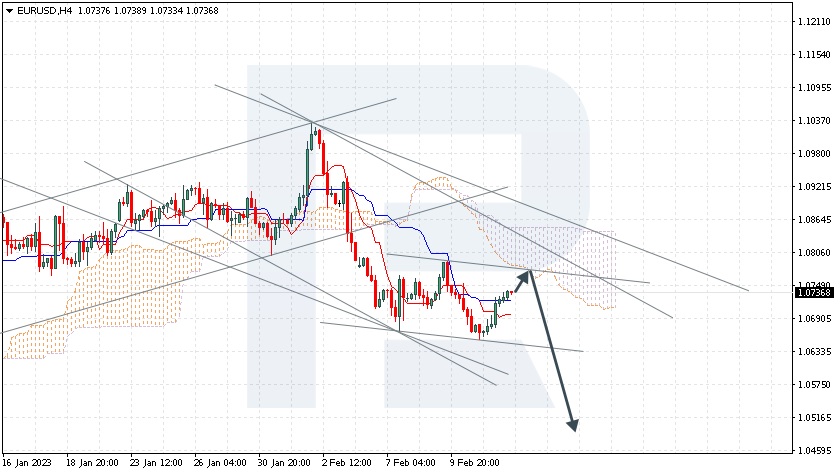
- Support levels: 1.0686, 1.0597
- Resistance levels: 1.0838, 1.0906, 1.0926, 1.0967, 1.1017, 1.1077
The trend on the EUR/USD currency pair on the hourly time frame is bearish. The price is forming a wide corridor. Yesterday, the liquidity above the level of 1.0791 was tested, after which the price returned to the balance. The MACD indicator became inactive. Under such market conditions, buy trades are best considered on the lower time frames from the support level of 1.0686. Sell deals can be considered from the resistance level of 1.0839, but it is better with confirmation in the form of reverse initiative on the lower time frames.
Alternative scenario: if the price breaks down through the resistance level of 1.0926 and fixes above it, the uptrend will likely resume.

- – Spanish Consumer Price Index (m/m) at 10:00 (GMT+2);
- – Eurozone Industrial Production (m/m) at 12:00 (GMT+2);
- – US Retail Sales (m/m) at 15:30 (GMT+2);
- – US NY Empire State Manufacturing Index (m/m) at 15:30 (GMT+2);
- – Eurozone ECB President Lagarde Speaks at 16:00 (GMT+2);
- – US Industrial Production (m/m) at 16:15 (GMT+2).
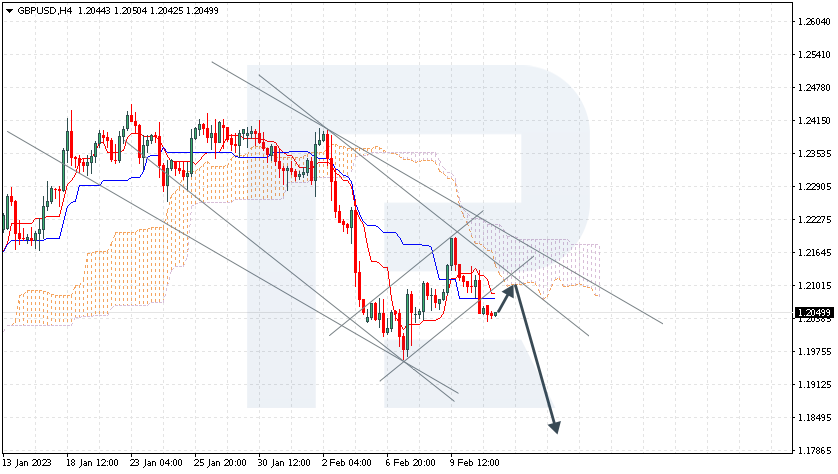
The GBP/USD currency pair
- Prev Open: 1.2132
- Prev Close: 1.2174
- % chg. over the last day: +0.35 %
The GBP/USD quotes strengthened on Tuesday after UK employment figures beat estimates. The unemployment rate remained at 3.7% while the economy added 74K jobs last month, with expectations of 40K. But the potential for growth in quotes was limited by stronger-than-expected January US consumer price indices that resulted in an increase in Treasury bond yields. Expectations for the Fed’s final rate could rise slightly, which would create a favorable environment for the US dollar, and threaten the pound’s recovery, especially if the rate differential widens.
- Support levels: 1.2082, 1.2000, 1.1930
- Resistance levels: 1.2188, 1.2311, 1.2416
From the technical point of view, the trend on the GBP/USD currency pair on the hourly time frame is bearish. At the moment, the price is trading above the moving averages, and there is a slight buying pressure inside the day. The MACD indicator has become inactive. Under such market conditions, buy trades are better to look for on intraday time frames from the support level of 1.2200, but with confirmation in the form of initiative and short targets. Sell trades are best sought after a pullback from the resistance level of 1.2188 but are also better with confirmation in the form of a reverse initiative.
Alternative scenario: if the price breaks out through the 1.2416 resistance level and fixes above it, the uptrend will likely resume.

- – UK Consumer Price Index (m/m) at 09:00 (GMT+2);
- – UK Producer Price Index (m/m) at 09:00 (GMT+2).
The USD/JPY currency pair
- Prev Open: 132.40
- Prev Close: 133.08
- % chg. over the last day: +0.87 %
The Japanese government on Tuesday introduced Kazuo Ueda as a candidate for the next governor of the Bank of Japan, suggesting the academic and former Bank of Japan policymaker will replace Haruhiko Kuroda. The new leadership is said to be attuned to the complex challenges facing the central bank, from addressing the side effects of years of monetary policy easing that has distorted bond markets and widened the Bank of Japan’s balance sheet. Ueda’s nomination, along with those of two deputy governors, Ryozo Himino, a former Financial Services Agency commissioner, and Shinichi Uchida, the Central Bank’s executive director, is expected to be approved by mid-March. Given that Ueda will not dramatically change monetary policy, the Japanese yen continued its decline.
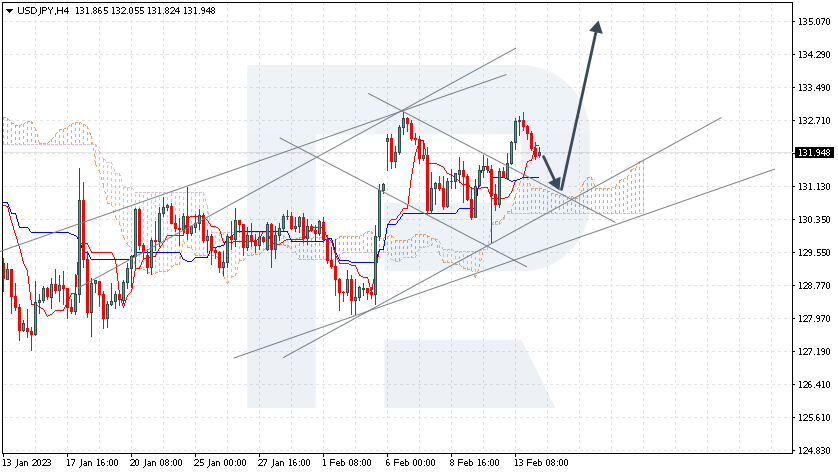
- Support levels: 131.43, 129.68, 129.98, 129.19, 129.04, 128.16
- Resistance levels: 133.47, 134.65
From the technical point of view, the medium-term trend on the currency pair USD/JPY is bullish. The price is forming a wide-volatile corridor. The MACD indicator is in the positive zone, but there are signs of divergence. Buying pressure is present, but it is limited. It is better to look for buy deals from the support level of 131.43, but only with confirmation on the lower time frames. Sell deals can be sought after an impulse return of the price to the balance below the level of 132.89.
Alternative scenario: If the price fixes below the support level of 128.16, the downtrend will be renewed with a high probability.

The USD/CAD currency pair
- Prev Open: 1.3331
- Prev Close: 1.3335
- % chg. over the last day: +0.03 %
The Canadian dollar is a commodity currency, so it highly depends on instruments such as the dollar index and oil. A decline in oil prices on the back of rising inventories and a strengthening dollar index are negative factors for the Canadian currency. Higher than expected US inflation data added to fears of more hawkish actions by the Federal Reserve, which caused the dollar to rise. At the moment, the interest rate differential between the US Fed and the Bank of Canada is only 0.25%, so any rise in oil prices would help to strengthen the Canadian economy.
- Support levels: 1.3333, 1.3295, 1.3212
- Resistance levels: 1.3416, 1.3496, 1.3520, 1.3554, 1.3595
From the point of view of technical analysis, the trend on the USD/CAD currency pair is bullish. The price corrected up to the priority change level, after which there was a sharp rebound. The MACD indicator became positive, and buyers would dominate during the day. Buy trades can be considered from the support at 1.3333, but with additional confirmation on the lower time frames, as the level has already been tested. Sell deals should be considered from the resistance level of 1.3416 but on the condition of a reverse reaction.
Alternative scenario: if the price breaks down and consolidates below the support level of 1.3263, the downtrend will likely resume.

- – Canada Manufacturing Sales (m/m) at 15:30 (GMT+2);
- – US Crude Oil Reserves (w/w) at 17:30 (GMT+2).
By JustMarkets
This article reflects a personal opinion and should not be interpreted as an investment advice, and/or offer, and/or a persistent request for carrying out financial transactions, and/or a guarantee, and/or a forecast of future events.