By InvestMacro
Here are the latest charts and statistics for the Commitment of Traders (COT) data published by the Commodities Futures Trading Commission (CFTC).
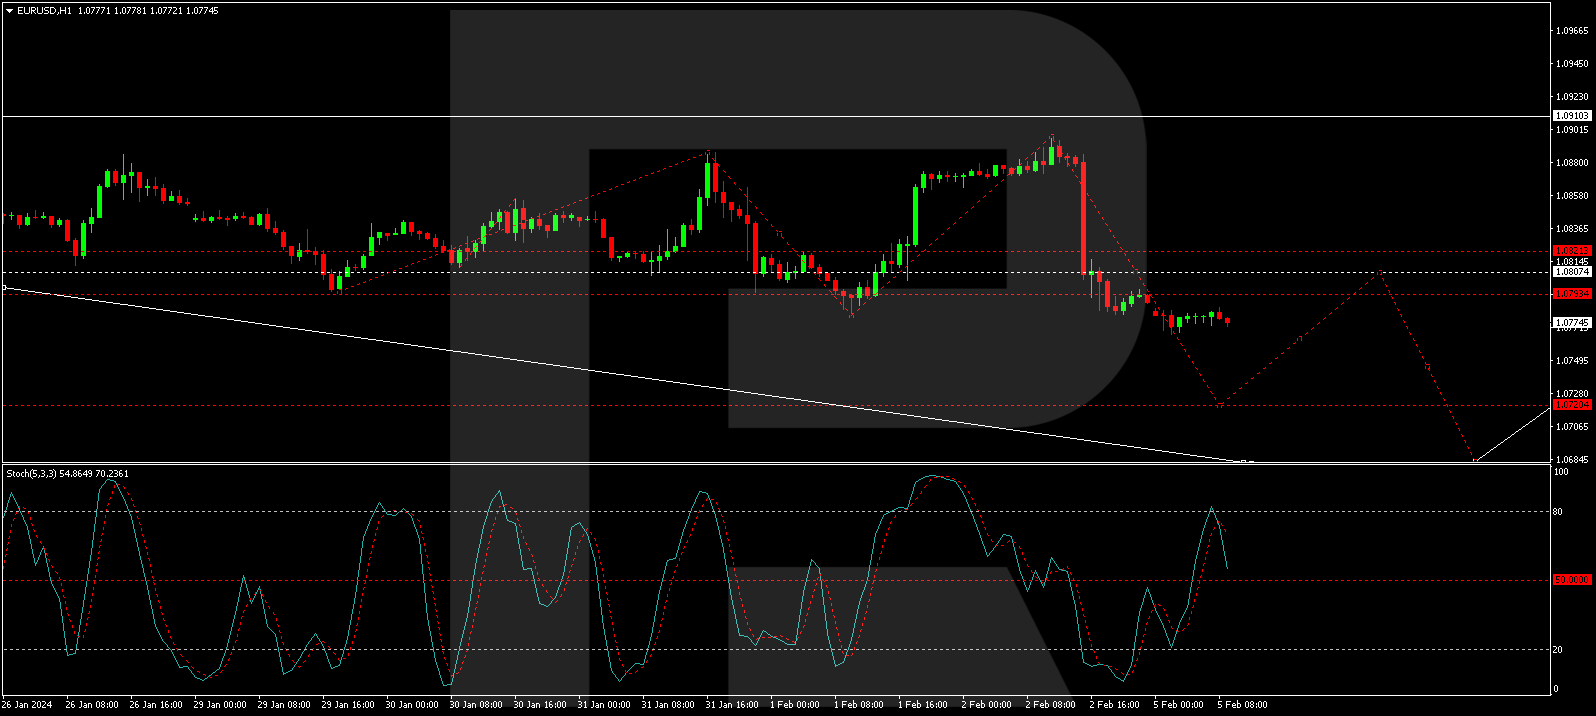
The latest COT data is updated through Tuesday January 30th and shows a quick view of how large market participants (for-profit speculators and commercial traders) were positioned in the futures markets. All currency positions are in direct relation to the US dollar where, for example, a bet for the euro is a bet that the euro will rise versus the dollar while a bet against the euro will be a bet that the euro will decline versus the dollar.
Weekly Speculator Changes led by New Zealand Dollar & Canadian Dollar
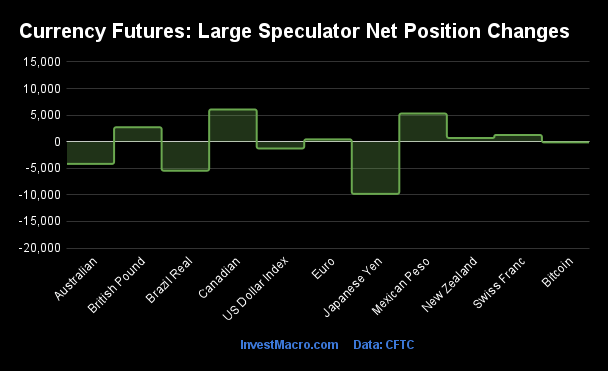
The COT currency market speculator bets were higher this week as six out of the eleven currency markets we cover had higher positioning while the other five markets had lower speculator contracts.
Leading the gains for the currency markets was the Canadian Dollar (6,063 contracts) with the Mexican Peso (5,294 contracts), British Pound (2,716 contracts), the Swiss Franc (1,267 contracts), the New Zealand Dollar (703 contracts) and the EuroFX (447 contracts) also showing positive weeks.
The currencies seeing declines in speculator bets on the week were the Japanese Yen (-9,810 contracts) the Brazilian Real (-5,452 contracts), the Australian Dollar (-4,175 contracts), the US Dollar Index (-1,275 contracts) and Bitcoin (-137 contracts) also recording lower bets on the week.
Japanese Yen Speculators add to their bearish bets as yen falls
Highlighting the COT currency’s data this week is recent the drop in sentiment for the Japanese yen speculators. Large speculative yen positions dropped for a third straight week this week and for the fourth time out of the past five weeks. The decline over the last three weeks is a total of -24,506 contracts that has taken the speculative level from -55,949 net contracts on January 9th to this week’s total at -80,455 net contracts. The current level is now at the most bearish standing since December 12th.
The yen had seen a respite from the negative speculative bets in December and January (going from -104,956 contracts on December 5th to -55,949 on January 9th) as market watchers had been expecting the Bank of Japan (BOJ) will eventually look to end its negative interest rate policy. However, the BOJ has largely maintained their interest rate policy and thrown cold water onto the yen bulls (possibly) premature hopes.
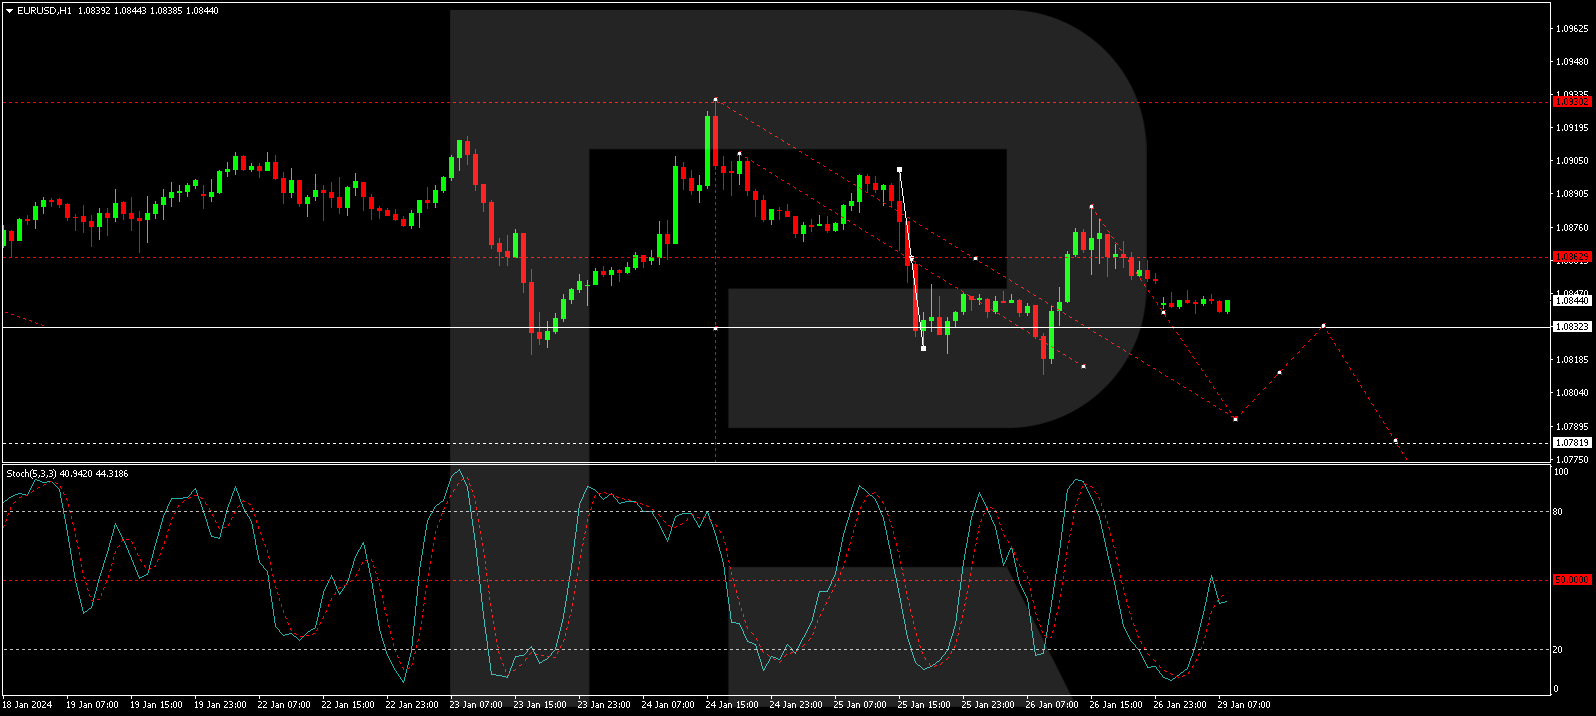
The yen exchange rate (versus the US Dollar) has been on the back-foot now for four out of the past five weeks after having made gains through November and December. The US Dollar had fallen versus the yen and brought the USDJPY currency pair to the 140.25 mark in late December which was the best level for the yen since July. Since starting the new year, the yen has been declining and this week the USDJPY closed at approximately the 148.30 level – an almost 6 percent gain for the USD versus the yen since January 1st.
Major Currencies – Speculators Leaderboard
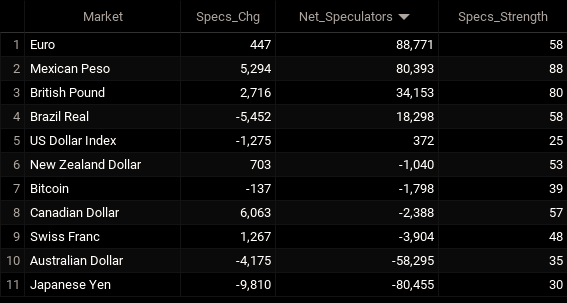
Legend: Weekly Speculators Change | Speculators Current Net Position | Speculators Strength Score compared to last 3-Years (0-100 range)
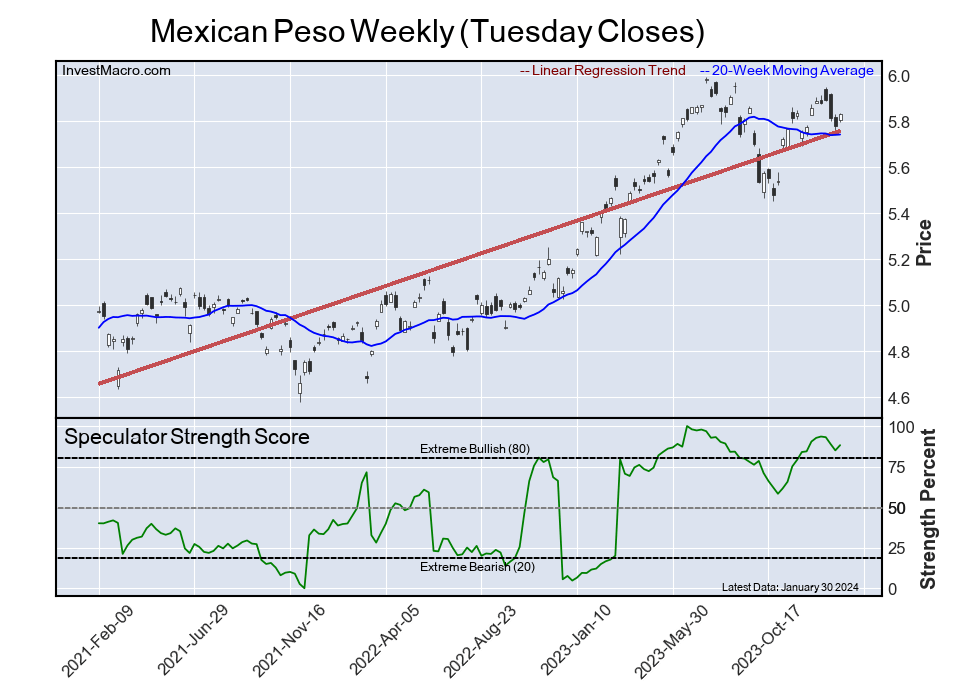
Strength Scores led by Mexican Peso & British Pound
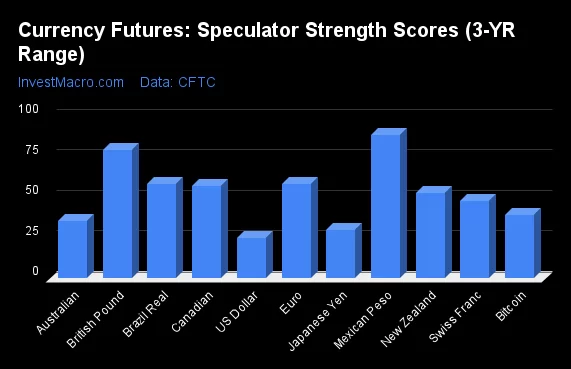
COT Strength Scores (a normalized measure of Speculator positions over a 3-Year range, from 0 to 100 where above 80 is Extreme-Bullish and below 20 is Extreme-Bearish) showed that the Mexican Peso (88 percent) and the British Pound (79 percent) lead the currency markets this week. The EuroFX (58 percent), the Brazilian Real (58 percent) and the Canadian Dollar (57 percent) come in as the next highest in the weekly strength scores.
On the downside, the US Dollar Index (25 percent) and the Japanese Yen (30 percent) come in at the lowest strength levels currently. The next lowest strength scores are the Australian Dollar (35 percent) and the Bitcoin (39 percent).
Strength Statistics:
US Dollar Index (24.7 percent) vs US Dollar Index previous week (26.9 percent)
EuroFX (58.1 percent) vs EuroFX previous week (57.9 percent)
British Pound Sterling (79.5 percent) vs British Pound Sterling previous week (77.6 percent)
Japanese Yen (29.7 percent) vs Japanese Yen previous week (35.6 percent)
Swiss Franc (47.8 percent) vs Swiss Franc previous week (44.2 percent)
Canadian Dollar (57.1 percent) vs Canadian Dollar previous week (52.0 percent)
Australian Dollar (35.4 percent) vs Australian Dollar previous week (39.2 percent)
New Zealand Dollar (52.7 percent) vs New Zealand Dollar previous week (50.9 percent)
Mexican Peso (88.2 percent) vs Mexican Peso previous week (85.0 percent)
Brazilian Real (58.2 percent) vs Brazilian Real previous week (65.3 percent)
Bitcoin (39.3 percent) vs Bitcoin previous week (41.4 percent)
Canadian Dollar & British Pound top the 6-Week Strength Trends
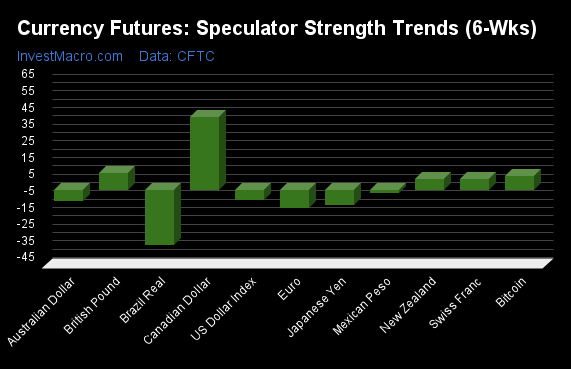
COT Strength Score Trends (or move index, calculates the 6-week changes in strength scores) showed that the Canadian Dollar (44 percent) and the British Pound (10 percent) lead the past six weeks trends for the currencies. Bitcoin (8 percent), the Swiss Franc (6 percent) and the New Zealand Dollar (6 percent) are the next highest positive movers in the latest trends data.
The Brazilian Real (-33 percent) leads the downside trend scores currently with the EuroFX (-11 percent), Japanese Yen (-9 percent) and the Australian Dollar (-7 percent) following next with lower trend scores.
Strength Trend Statistics:
US Dollar Index (-6.0 percent) vs US Dollar Index previous week (-26.9 percent)
EuroFX (-11.0 percent) vs EuroFX previous week (-25.1 percent)
British Pound Sterling (9.9 percent) vs British Pound Sterling previous week (6.8 percent)
Japanese Yen (-9.3 percent) vs Japanese Yen previous week (6.3 percent)
Swiss Franc (6.2 percent) vs Swiss Franc previous week (26.5 percent)
Canadian Dollar (43.6 percent) vs Canadian Dollar previous week (39.3 percent)
Australian Dollar (-7.0 percent) vs Australian Dollar previous week (-1.6 percent)
New Zealand Dollar (6.1 percent) vs New Zealand Dollar previous week (30.6 percent)
Mexican Peso (-2.2 percent) vs Mexican Peso previous week (0.6 percent)
Brazilian Real (-33.1 percent) vs Brazilian Real previous week (-29.7 percent)
Bitcoin (8.3 percent) vs Bitcoin previous week (6.1 percent)
Individual COT Forex Markets:
US Dollar Index Futures:
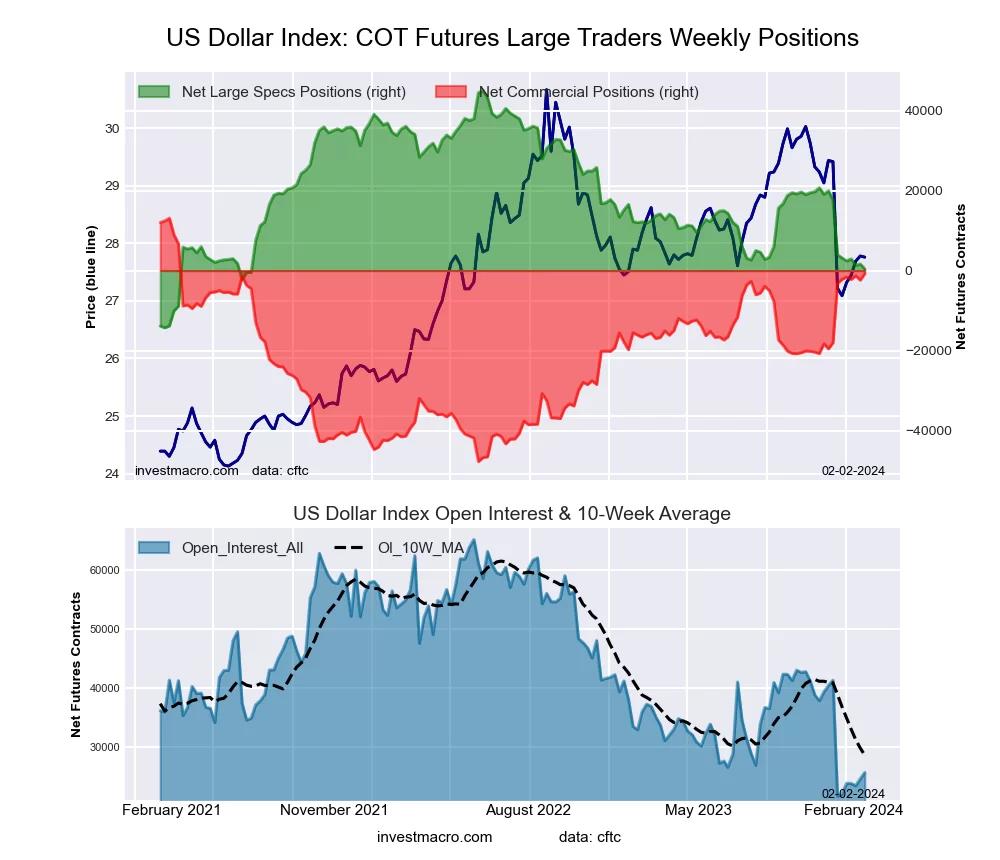 The US Dollar Index large speculator standing this week came in at a net position of 372 contracts in the data reported through Tuesday. This was a weekly decline of -1,275 contracts from the previous week which had a total of 1,647 net contracts.
This week’s current strength score (the trader positioning range over the past three years, measured from 0 to 100) shows the speculators are currently Bearish with a score of 24.7 percent. The commercials are Bullish with a score of 77.2 percent and the small traders (not shown in chart) are Bearish-Extreme with a score of 15.4 percent.
Price Trend-Following Model: Downtrend
Our weekly trend-following model classifies the current market price position as: Downtrend. The current action for the model is considered to be: Hold – Maintain Short Position.
| US DOLLAR INDEX Statistics | SPECULATORS | COMMERCIALS | SMALL TRADERS |
| – Percent of Open Interest Longs: | 67.0 | 15.4 | 11.2 |
| – Percent of Open Interest Shorts: | 65.5 | 18.3 | 9.8 |
| – Net Position: | 372 | -739 | 367 |
| – Gross Longs: | 17,238 | 3,964 | 2,878 |
| – Gross Shorts: | 16,866 | 4,703 | 2,511 |
| – Long to Short Ratio: | 1.0 to 1 | 0.8 to 1 | 1.1 to 1 |
| NET POSITION TREND: | | | |
| – Strength Index Score (3 Year Range Pct): | 24.7 | 77.2 | 15.4 |
| – Strength Index Reading (3 Year Range): | Bearish | Bullish | Bearish-Extreme |
| NET POSITION MOVEMENT INDEX: | | | |
| – 6-Week Change in Strength Index: | -6.0 | 4.0 | 13.5 |
Euro Currency Futures:
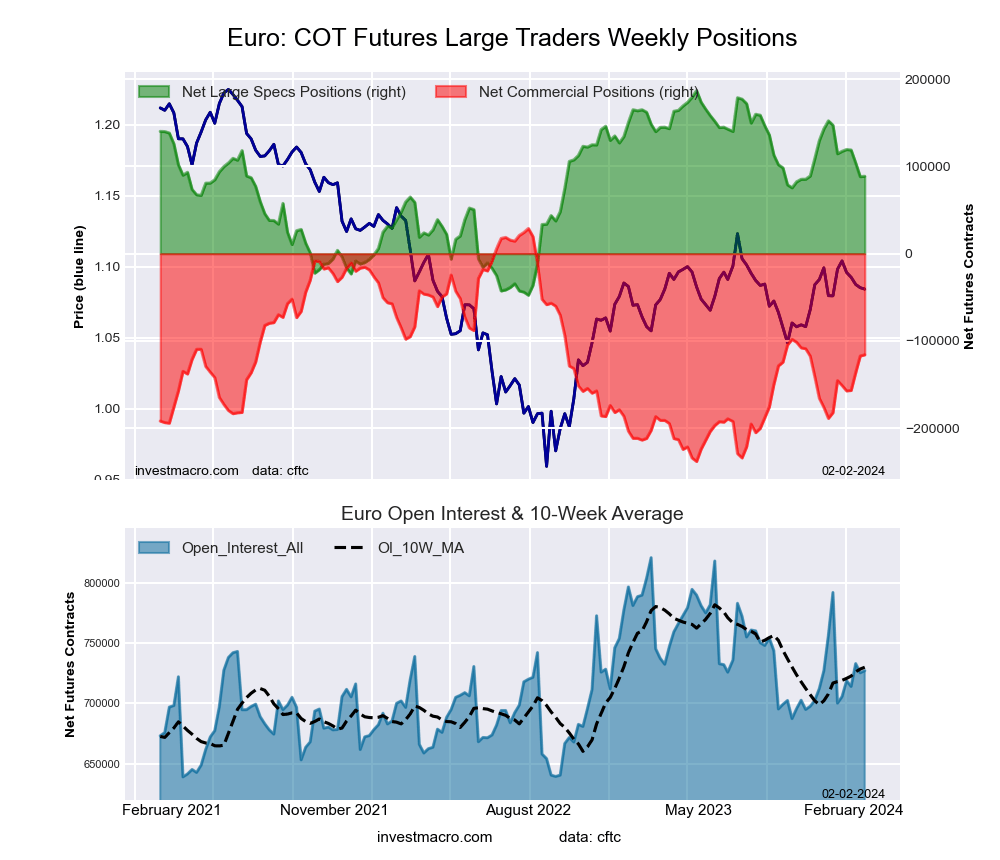 The Euro Currency large speculator standing this week came in at a net position of 88,771 contracts in the data reported through Tuesday. This was a weekly boost of 447 contracts from the previous week which had a total of 88,324 net contracts.
This week’s current strength score (the trader positioning range over the past three years, measured from 0 to 100) shows the speculators are currently Bullish with a score of 58.1 percent. The commercials are Bearish with a score of 45.8 percent and the small traders (not shown in chart) are Bearish with a score of 22.4 percent.
Price Trend-Following Model: Uptrend
Our weekly trend-following model classifies the current market price position as: Uptrend. The current action for the model is considered to be: Hold – Maintain Long Position.
| EURO Currency Statistics | SPECULATORS | COMMERCIALS | SMALL TRADERS |
| – Percent of Open Interest Longs: | 27.6 | 59.4 | 10.8 |
| – Percent of Open Interest Shorts: | 15.3 | 75.4 | 7.1 |
| – Net Position: | 88,771 | -116,006 | 27,235 |
| – Gross Longs: | 200,360 | 432,311 | 78,589 |
| – Gross Shorts: | 111,589 | 548,317 | 51,354 |
| – Long to Short Ratio: | 1.8 to 1 | 0.8 to 1 | 1.5 to 1 |
| NET POSITION TREND: | | | |
| – Strength Index Score (3 Year Range Pct): | 58.1 | 45.8 | 22.4 |
| – Strength Index Reading (3 Year Range): | Bullish | Bearish | Bearish |
| NET POSITION MOVEMENT INDEX: | | | |
| – 6-Week Change in Strength Index: | -11.0 | 11.1 | -6.1 |
British Pound Sterling Futures:
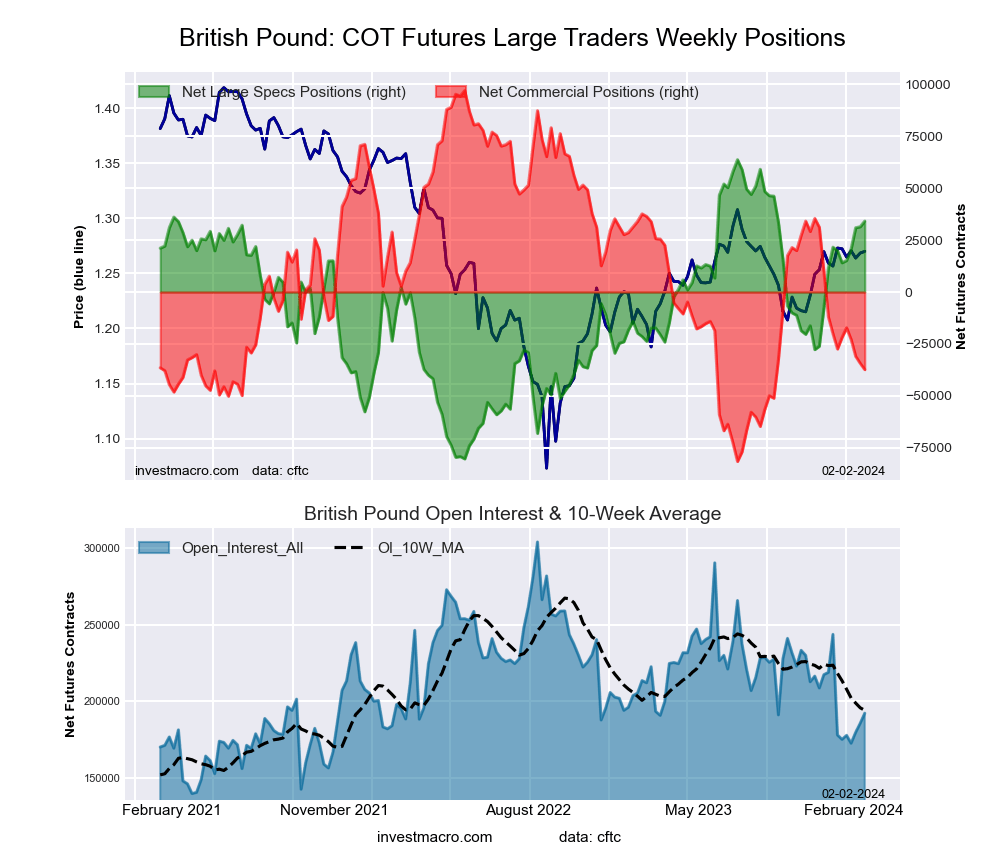 The British Pound Sterling large speculator standing this week came in at a net position of 34,153 contracts in the data reported through Tuesday. This was a weekly lift of 2,716 contracts from the previous week which had a total of 31,437 net contracts.
This week’s current strength score (the trader positioning range over the past three years, measured from 0 to 100) shows the speculators are currently Bullish with a score of 79.5 percent. The commercials are Bearish with a score of 24.8 percent and the small traders (not shown in chart) are Bullish with a score of 64.4 percent.
Price Trend-Following Model: Uptrend
Our weekly trend-following model classifies the current market price position as: Uptrend. The current action for the model is considered to be: Hold – Maintain Long Position.
| BRITISH POUND Statistics | SPECULATORS | COMMERCIALS | SMALL TRADERS |
| – Percent of Open Interest Longs: | 40.3 | 37.7 | 15.4 |
| – Percent of Open Interest Shorts: | 22.5 | 57.2 | 13.7 |
| – Net Position: | 34,153 | -37,380 | 3,227 |
| – Gross Longs: | 77,499 | 72,532 | 29,604 |
| – Gross Shorts: | 43,346 | 109,912 | 26,377 |
| – Long to Short Ratio: | 1.8 to 1 | 0.7 to 1 | 1.1 to 1 |
| NET POSITION TREND: | | | |
| – Strength Index Score (3 Year Range Pct): | 79.5 | 24.8 | 64.4 |
| – Strength Index Reading (3 Year Range): | Bullish | Bearish | Bullish |
| NET POSITION MOVEMENT INDEX: | | | |
| – 6-Week Change in Strength Index: | 9.9 | -5.6 | -8.4 |
Japanese Yen Futures:
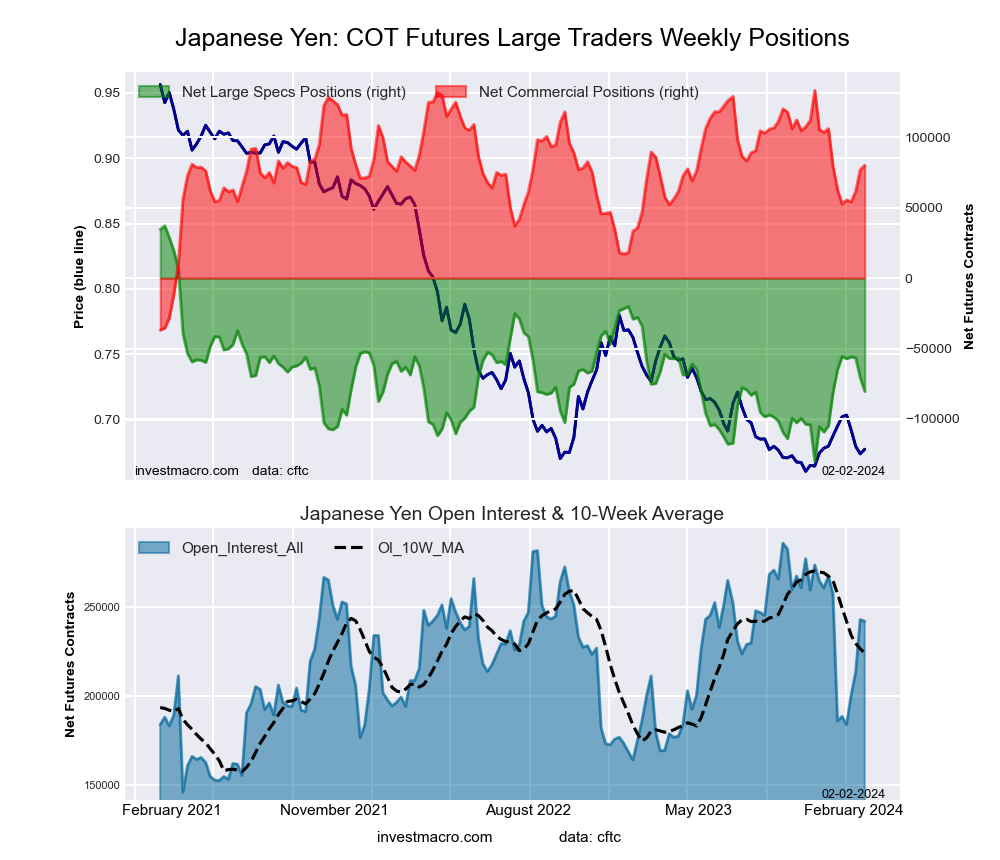 The Japanese Yen large speculator standing this week came in at a net position of -80,455 contracts in the data reported through Tuesday. This was a weekly decline of -9,810 contracts from the previous week which had a total of -70,645 net contracts.
This week’s current strength score (the trader positioning range over the past three years, measured from 0 to 100) shows the speculators are currently Bearish with a score of 29.7 percent. The commercials are Bullish with a score of 68.8 percent and the small traders (not shown in chart) are Bullish-Extreme with a score of 83.6 percent.
Price Trend-Following Model: Weak Uptrend
Our weekly trend-following model classifies the current market price position as: Weak Uptrend. The current action for the model is considered to be: Hold – Maintain Long Position.
| JAPANESE YEN Statistics | SPECULATORS | COMMERCIALS | SMALL TRADERS |
| – Percent of Open Interest Longs: | 18.6 | 61.6 | 17.3 |
| – Percent of Open Interest Shorts: | 51.8 | 28.4 | 17.2 |
| – Net Position: | -80,455 | 80,134 | 321 |
| – Gross Longs: | 44,918 | 148,972 | 41,873 |
| – Gross Shorts: | 125,373 | 68,838 | 41,552 |
| – Long to Short Ratio: | 0.4 to 1 | 2.2 to 1 | 1.0 to 1 |
| NET POSITION TREND: | | | |
| – Strength Index Score (3 Year Range Pct): | 29.7 | 68.8 | 83.6 |
| – Strength Index Reading (3 Year Range): | Bearish | Bullish | Bullish-Extreme |
| NET POSITION MOVEMENT INDEX: | | | |
| – 6-Week Change in Strength Index: | -9.3 | 10.3 | -5.9 |
Swiss Franc Futures:
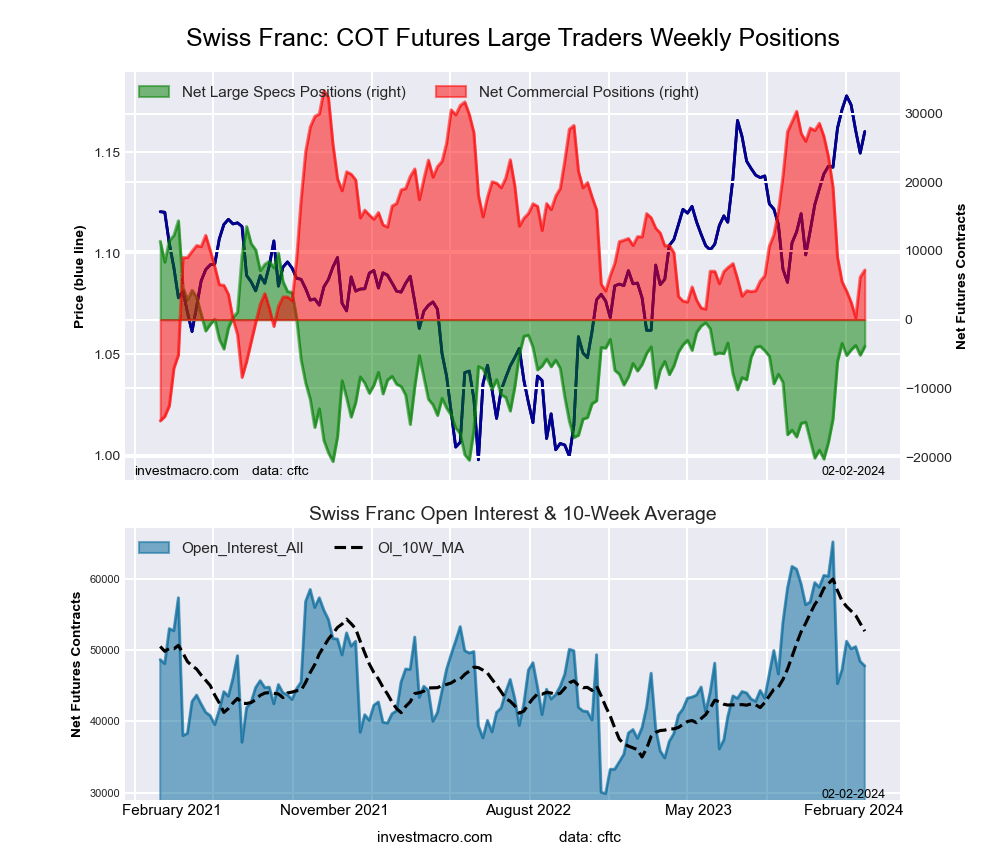 The Swiss Franc large speculator standing this week came in at a net position of -3,904 contracts in the data reported through Tuesday. This was a weekly rise of 1,267 contracts from the previous week which had a total of -5,171 net contracts.
This week’s current strength score (the trader positioning range over the past three years, measured from 0 to 100) shows the speculators are currently Bearish with a score of 47.8 percent. The commercials are Bearish with a score of 45.7 percent and the small traders (not shown in chart) are Bullish with a score of 60.2 percent.
Price Trend-Following Model: Uptrend
Our weekly trend-following model classifies the current market price position as: Uptrend. The current action for the model is considered to be: Hold – Maintain Long Position.
| SWISS FRANC Statistics | SPECULATORS | COMMERCIALS | SMALL TRADERS |
| – Percent of Open Interest Longs: | 21.2 | 52.8 | 25.9 |
| – Percent of Open Interest Shorts: | 29.4 | 37.7 | 32.8 |
| – Net Position: | -3,904 | 7,222 | -3,318 |
| – Gross Longs: | 10,137 | 25,245 | 12,368 |
| – Gross Shorts: | 14,041 | 18,023 | 15,686 |
| – Long to Short Ratio: | 0.7 to 1 | 1.4 to 1 | 0.8 to 1 |
| NET POSITION TREND: | | | |
| – Strength Index Score (3 Year Range Pct): | 47.8 | 45.7 | 60.2 |
| – Strength Index Reading (3 Year Range): | Bearish | Bearish | Bullish |
| NET POSITION MOVEMENT INDEX: | | | |
| – 6-Week Change in Strength Index: | 6.2 | -3.9 | -1.5 |
Canadian Dollar Futures:
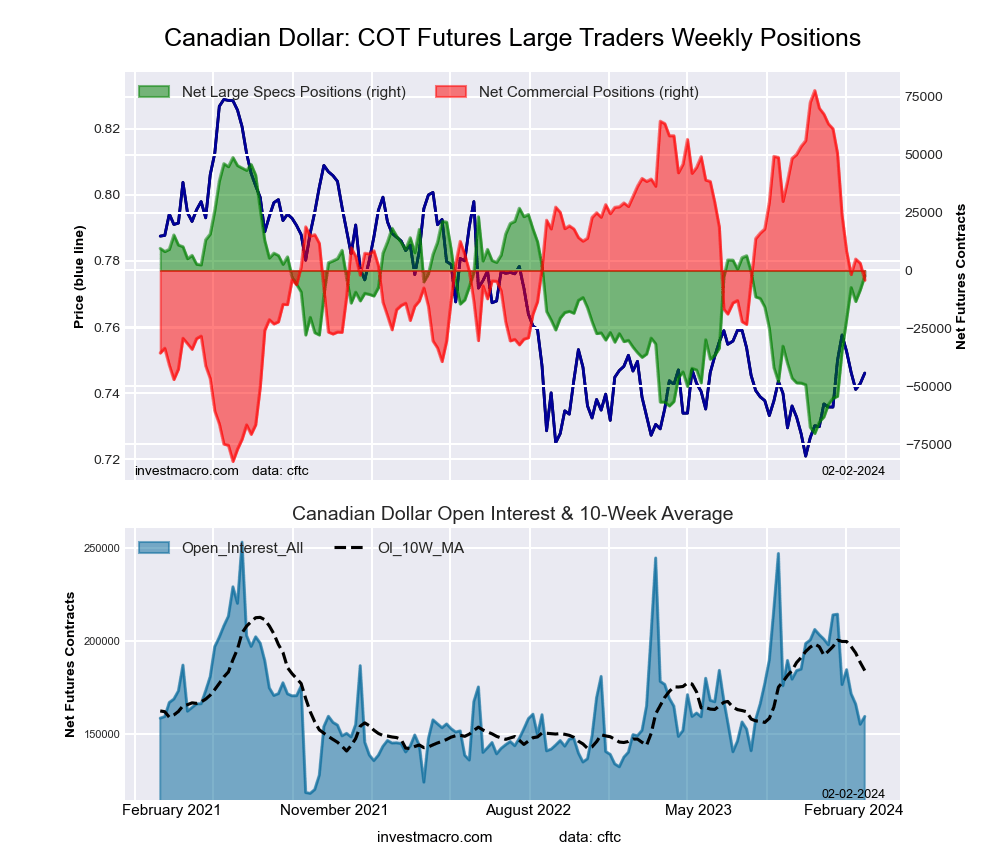 The Canadian Dollar large speculator standing this week came in at a net position of -2,388 contracts in the data reported through Tuesday. This was a weekly lift of 6,063 contracts from the previous week which had a total of -8,451 net contracts.
This week’s current strength score (the trader positioning range over the past three years, measured from 0 to 100) shows the speculators are currently Bullish with a score of 57.1 percent. The commercials are Bearish with a score of 48.9 percent and the small traders (not shown in chart) are Bearish with a score of 37.4 percent.
Price Trend-Following Model: Uptrend
Our weekly trend-following model classifies the current market price position as: Uptrend. The current action for the model is considered to be: Hold – Maintain Long Position.
| CANADIAN DOLLAR Statistics | SPECULATORS | COMMERCIALS | SMALL TRADERS |
| – Percent of Open Interest Longs: | 24.5 | 54.4 | 20.1 |
| – Percent of Open Interest Shorts: | 26.0 | 57.1 | 16.0 |
| – Net Position: | -2,388 | -4,200 | 6,588 |
| – Gross Longs: | 39,101 | 86,763 | 32,032 |
| – Gross Shorts: | 41,489 | 90,963 | 25,444 |
| – Long to Short Ratio: | 0.9 to 1 | 1.0 to 1 | 1.3 to 1 |
| NET POSITION TREND: | | | |
| – Strength Index Score (3 Year Range Pct): | 57.1 | 48.9 | 37.4 |
| – Strength Index Reading (3 Year Range): | Bullish | Bearish | Bearish |
| NET POSITION MOVEMENT INDEX: | | | |
| – 6-Week Change in Strength Index: | 43.6 | -34.2 | 6.3 |
Australian Dollar Futures:
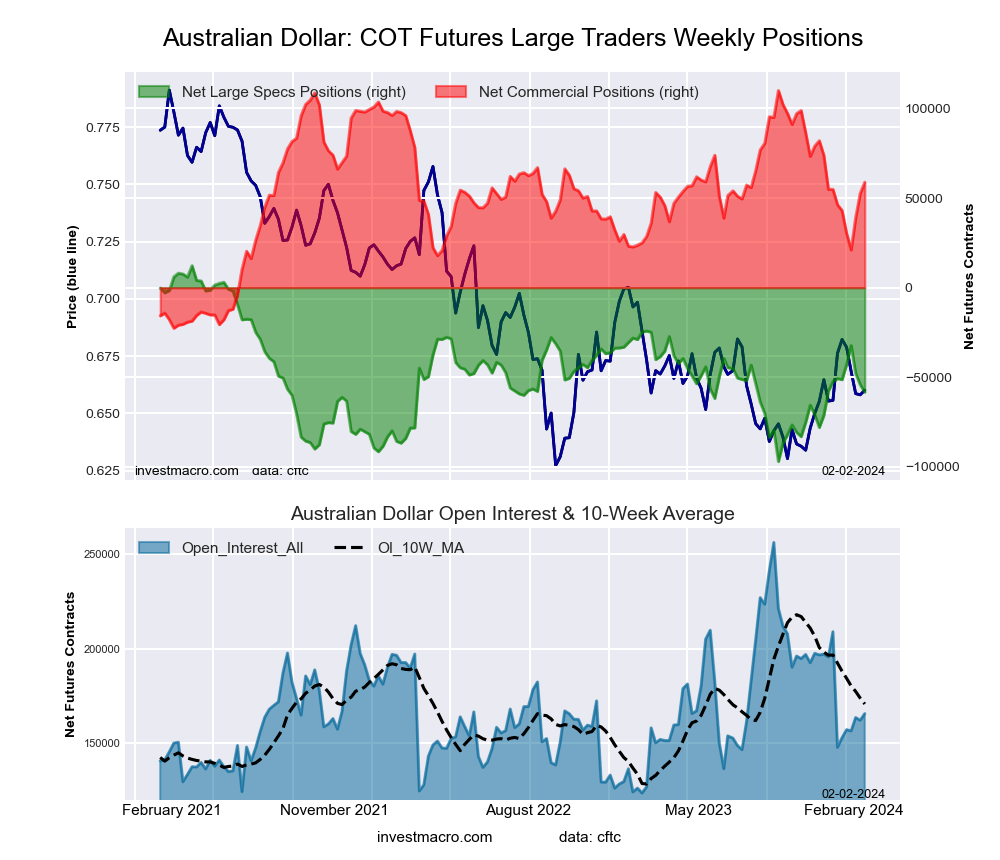 The Australian Dollar large speculator standing this week came in at a net position of -58,295 contracts in the data reported through Tuesday. This was a weekly decrease of -4,175 contracts from the previous week which had a total of -54,120 net contracts.
This week’s current strength score (the trader positioning range over the past three years, measured from 0 to 100) shows the speculators are currently Bearish with a score of 35.4 percent. The commercials are Bullish with a score of 61.4 percent and the small traders (not shown in chart) are Bullish with a score of 51.1 percent.
Price Trend-Following Model: Weak Uptrend
Our weekly trend-following model classifies the current market price position as: Weak Uptrend. The current action for the model is considered to be: Hold – Maintain Long Position.
| AUSTRALIAN DOLLAR Statistics | SPECULATORS | COMMERCIALS | SMALL TRADERS |
| – Percent of Open Interest Longs: | 22.3 | 59.1 | 13.2 |
| – Percent of Open Interest Shorts: | 57.5 | 23.6 | 13.6 |
| – Net Position: | -58,295 | 58,847 | -552 |
| – Gross Longs: | 36,956 | 97,888 | 21,902 |
| – Gross Shorts: | 95,251 | 39,041 | 22,454 |
| – Long to Short Ratio: | 0.4 to 1 | 2.5 to 1 | 1.0 to 1 |
| NET POSITION TREND: | | | |
| – Strength Index Score (3 Year Range Pct): | 35.4 | 61.4 | 51.1 |
| – Strength Index Reading (3 Year Range): | Bearish | Bullish | Bullish |
| NET POSITION MOVEMENT INDEX: | | | |
| – 6-Week Change in Strength Index: | -7.0 | 9.5 | -12.0 |
New Zealand Dollar Futures:
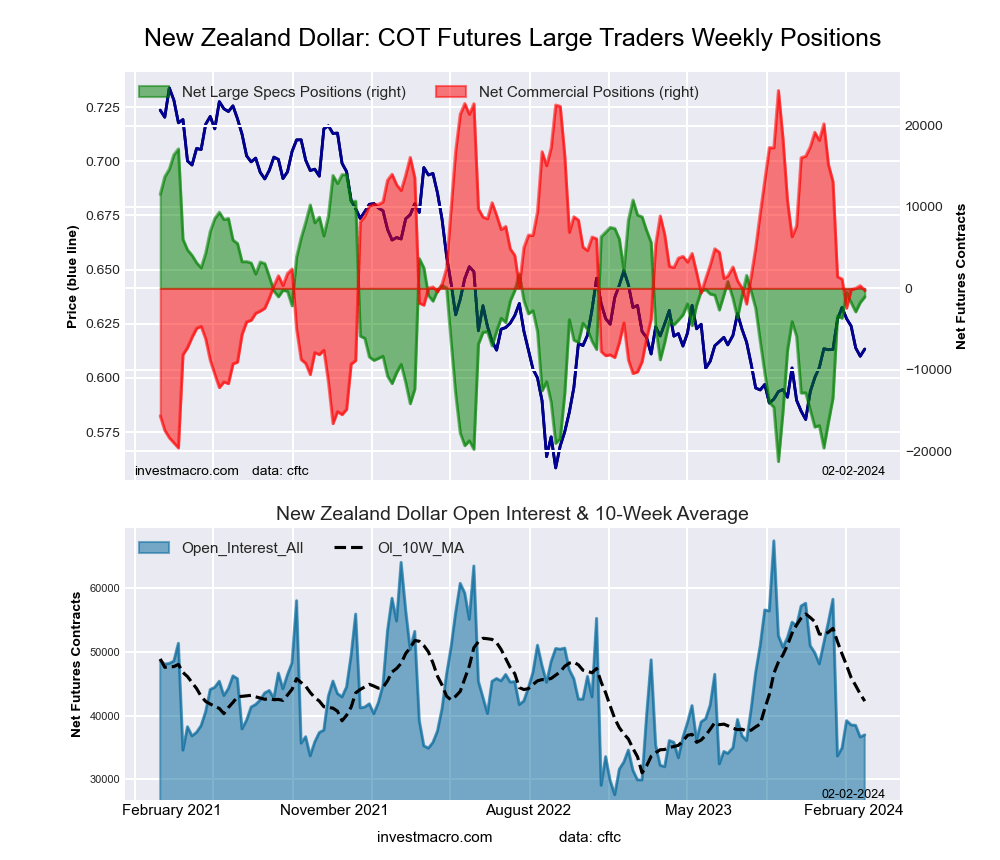 The New Zealand Dollar large speculator standing this week came in at a net position of -1,040 contracts in the data reported through Tuesday. This was a weekly gain of 703 contracts from the previous week which had a total of -1,743 net contracts.
This week’s current strength score (the trader positioning range over the past three years, measured from 0 to 100) shows the speculators are currently Bullish with a score of 52.7 percent. The commercials are Bearish with a score of 44.0 percent and the small traders (not shown in chart) are Bullish with a score of 66.4 percent.
Price Trend-Following Model: Uptrend
Our weekly trend-following model classifies the current market price position as: Uptrend. The current action for the model is considered to be: Hold – Maintain Long Position.
| NEW ZEALAND DOLLAR Statistics | SPECULATORS | COMMERCIALS | SMALL TRADERS |
| – Percent of Open Interest Longs: | 38.2 | 45.1 | 12.4 |
| – Percent of Open Interest Shorts: | 41.0 | 45.9 | 8.8 |
| – Net Position: | -1,040 | -289 | 1,329 |
| – Gross Longs: | 14,114 | 16,682 | 4,588 |
| – Gross Shorts: | 15,154 | 16,971 | 3,259 |
| – Long to Short Ratio: | 0.9 to 1 | 1.0 to 1 | 1.4 to 1 |
| NET POSITION TREND: | | | |
| – Strength Index Score (3 Year Range Pct): | 52.7 | 44.0 | 66.4 |
| – Strength Index Reading (3 Year Range): | Bullish | Bearish | Bullish |
| NET POSITION MOVEMENT INDEX: | | | |
| – 6-Week Change in Strength Index: | 6.1 | -3.9 | -7.7 |
Mexican Peso Futures:
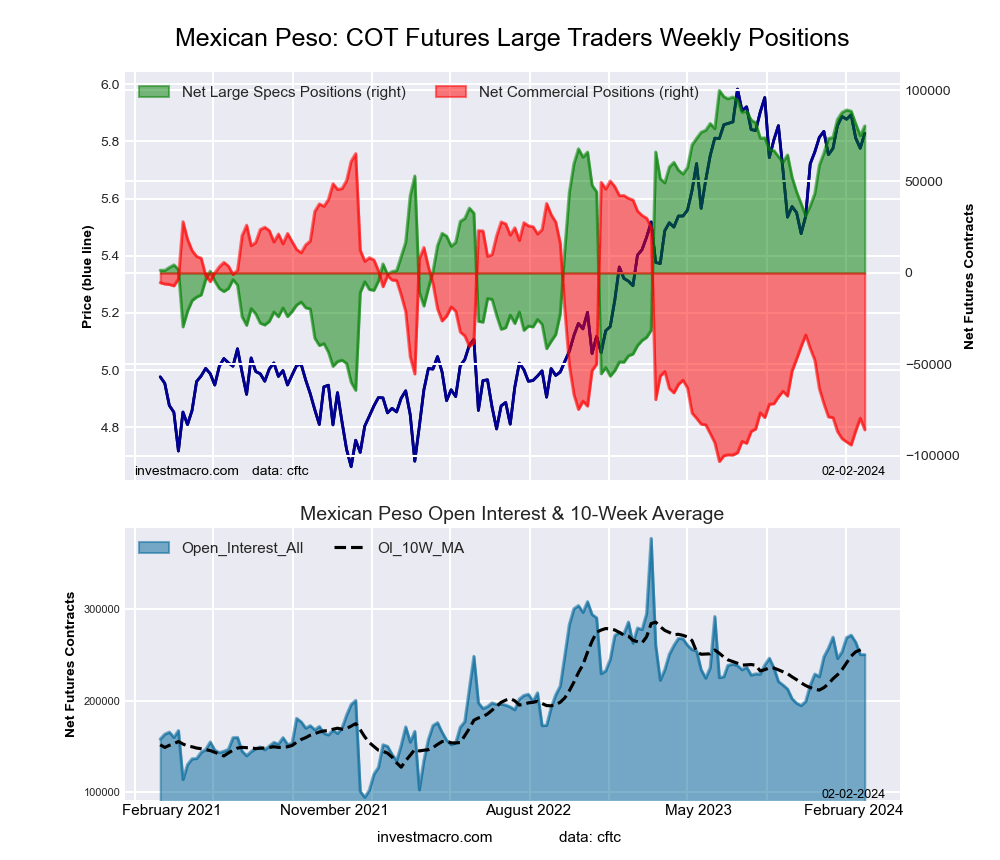 The Mexican Peso large speculator standing this week came in at a net position of 80,393 contracts in the data reported through Tuesday. This was a weekly gain of 5,294 contracts from the previous week which had a total of 75,099 net contracts.
This week’s current strength score (the trader positioning range over the past three years, measured from 0 to 100) shows the speculators are currently Bullish-Extreme with a score of 88.2 percent. The commercials are Bearish-Extreme with a score of 10.3 percent and the small traders (not shown in chart) are Bearish with a score of 45.1 percent.
Price Trend-Following Model: Uptrend
Our weekly trend-following model classifies the current market price position as: Uptrend. The current action for the model is considered to be: Hold – Maintain Long Position.
| MEXICAN PESO Statistics | SPECULATORS | COMMERCIALS | SMALL TRADERS |
| – Percent of Open Interest Longs: | 53.1 | 41.6 | 3.1 |
| – Percent of Open Interest Shorts: | 21.0 | 75.8 | 1.0 |
| – Net Position: | 80,393 | -85,717 | 5,324 |
| – Gross Longs: | 132,808 | 103,931 | 7,803 |
| – Gross Shorts: | 52,415 | 189,648 | 2,479 |
| – Long to Short Ratio: | 2.5 to 1 | 0.5 to 1 | 3.1 to 1 |
| NET POSITION TREND: | | | |
| – Strength Index Score (3 Year Range Pct): | 88.2 | 10.3 | 45.1 |
| – Strength Index Reading (3 Year Range): | Bullish-Extreme | Bearish-Extreme | Bearish |
| NET POSITION MOVEMENT INDEX: | | | |
| – 6-Week Change in Strength Index: | -2.2 | 0.6 | 16.9 |
Brazilian Real Futures:
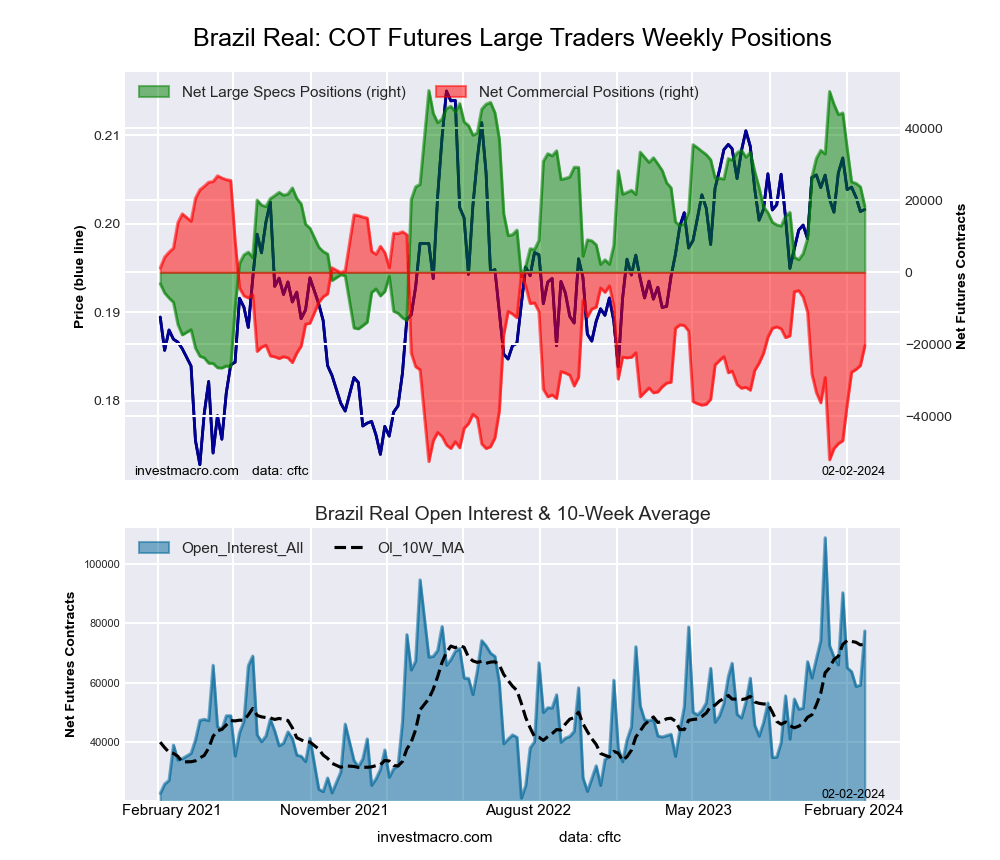 The Brazilian Real large speculator standing this week came in at a net position of 18,298 contracts in the data reported through Tuesday. This was a weekly decline of -5,452 contracts from the previous week which had a total of 23,750 net contracts.
This week’s current strength score (the trader positioning range over the past three years, measured from 0 to 100) shows the speculators are currently Bullish with a score of 58.2 percent. The commercials are Bearish with a score of 40.5 percent and the small traders (not shown in chart) are Bullish with a score of 54.2 percent.
Price Trend-Following Model: Weak Uptrend
Our weekly trend-following model classifies the current market price position as: Weak Uptrend. The current action for the model is considered to be: Hold – Maintain Long Position.
| BRAZIL REAL Statistics | SPECULATORS | COMMERCIALS | SMALL TRADERS |
| – Percent of Open Interest Longs: | 48.1 | 38.1 | 4.4 |
| – Percent of Open Interest Shorts: | 24.5 | 64.4 | 1.6 |
| – Net Position: | 18,298 | -20,424 | 2,126 |
| – Gross Longs: | 37,248 | 29,454 | 3,388 |
| – Gross Shorts: | 18,950 | 49,878 | 1,262 |
| – Long to Short Ratio: | 2.0 to 1 | 0.6 to 1 | 2.7 to 1 |
| NET POSITION TREND: | | | |
| – Strength Index Score (3 Year Range Pct): | 58.2 | 40.5 | 54.2 |
| – Strength Index Reading (3 Year Range): | Bullish | Bearish | Bullish |
| NET POSITION MOVEMENT INDEX: | | | |
| – 6-Week Change in Strength Index: | -33.1 | 34.2 | -15.1 |
Bitcoin Futures:
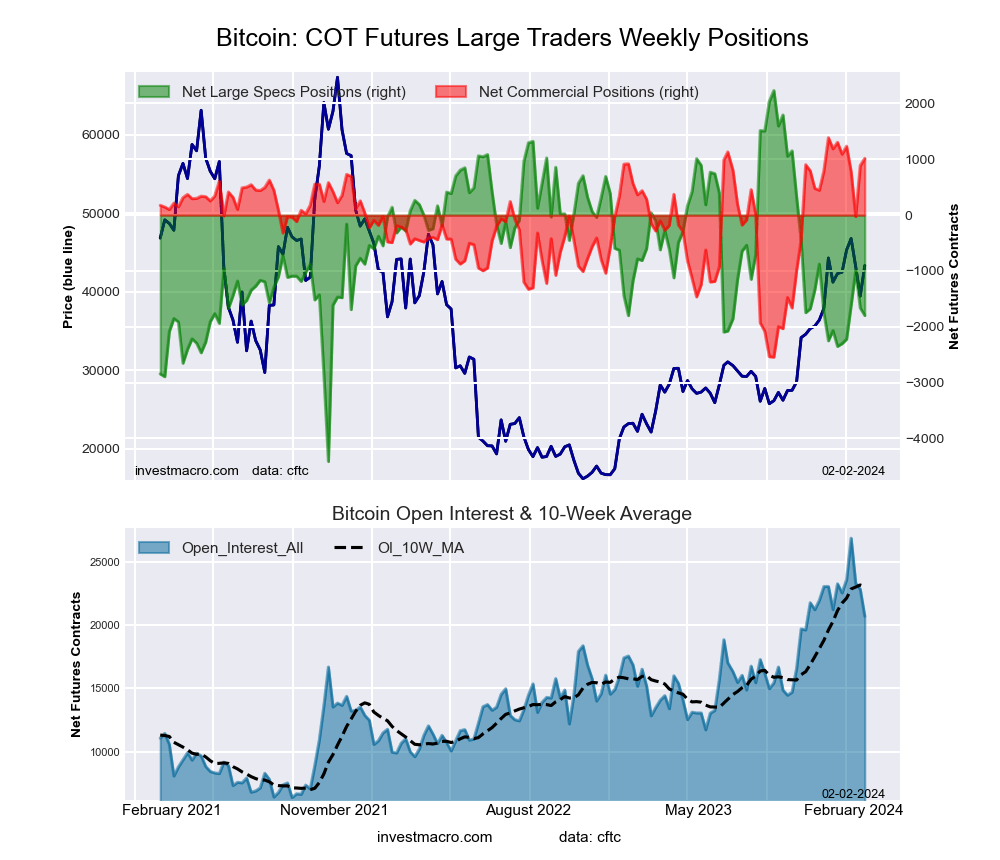 The Bitcoin large speculator standing this week came in at a net position of -1,798 contracts in the data reported through Tuesday. This was a weekly decline of -137 contracts from the previous week which had a total of -1,661 net contracts.
This week’s current strength score (the trader positioning range over the past three years, measured from 0 to 100) shows the speculators are currently Bearish with a score of 39.3 percent. The commercials are Bullish-Extreme with a score of 90.6 percent and the small traders (not shown in chart) are Bearish with a score of 30.7 percent.
Price Trend-Following Model: Uptrend
Our weekly trend-following model classifies the current market price position as: Uptrend. The current action for the model is considered to be: Hold – Maintain Long Position.
| BITCOIN Statistics | SPECULATORS | COMMERCIALS | SMALL TRADERS |
| – Percent of Open Interest Longs: | 79.9 | 6.1 | 6.9 |
| – Percent of Open Interest Shorts: | 88.6 | 1.1 | 3.2 |
| – Net Position: | -1,798 | 1,017 | 781 |
| – Gross Longs: | 16,519 | 1,253 | 1,435 |
| – Gross Shorts: | 18,317 | 236 | 654 |
| – Long to Short Ratio: | 0.9 to 1 | 5.3 to 1 | 2.2 to 1 |
| NET POSITION TREND: | | | |
| – Strength Index Score (3 Year Range Pct): | 39.3 | 90.6 | 30.7 |
| – Strength Index Reading (3 Year Range): | Bearish | Bullish-Extreme | Bearish |
| NET POSITION MOVEMENT INDEX: | | | |
| – 6-Week Change in Strength Index: | 8.3 | -7.3 | -6.0 |
Article By InvestMacro – Receive our weekly COT Newsletter
*COT Report: The COT data, released weekly to the public each Friday, is updated through the most recent Tuesday (data is 3 days old) and shows a quick view of how large speculators or non-commercials (for-profit traders) were positioned in the futures markets.
The CFTC categorizes trader positions according to commercial hedgers (traders who use futures contracts for hedging as part of the business), non-commercials (large traders who speculate to realize trading profits) and nonreportable traders (usually small traders/speculators) as well as their open interest (contracts open in the market at time of reporting). See CFTC criteria here.