
By RoboForex Analytical Department
The EUR/USD currency pair saw an uptick, reaching 1.0944 at the onset of the final week of November. This movement indicates a weakening of the US dollar against the Euro.
Key to this shift is the upcoming release of the Core Personal Consumption Expenditures (PCE) Price Index, a crucial measure watched closely by the US Federal Reserve. The Core PCE index, reflecting the primary personal spending of US citizens, is a significant indicator for the Federal Reserve in shaping its credit and monetary policies. The index had previously shown a 0.3% month-over-month increase, but expectations for October point to a potential slowdown to a 0.2% rise.
A slowdown in inflation, as indicated by the Core PCE index, could lead to a softer stance from the Federal Reserve regarding interest rate hikes. This prospect could further contribute to the weakening of the US dollar. From a broader perspective, a decrease in inflation is generally viewed positively for the economy, as it eases financial pressures on consumers and businesses.
Technical Analysis of the EUR/USD Currency Pair
Free Reports:
 Download Our Metatrader 4 Indicators – Put Our Free MetaTrader 4 Custom Indicators on your charts when you join our Weekly Newsletter
 Get our Weekly Commitment of Traders Reports - See where the biggest traders (Hedge Funds and Commercial Hedgers) are positioned in the futures markets on a weekly basis.
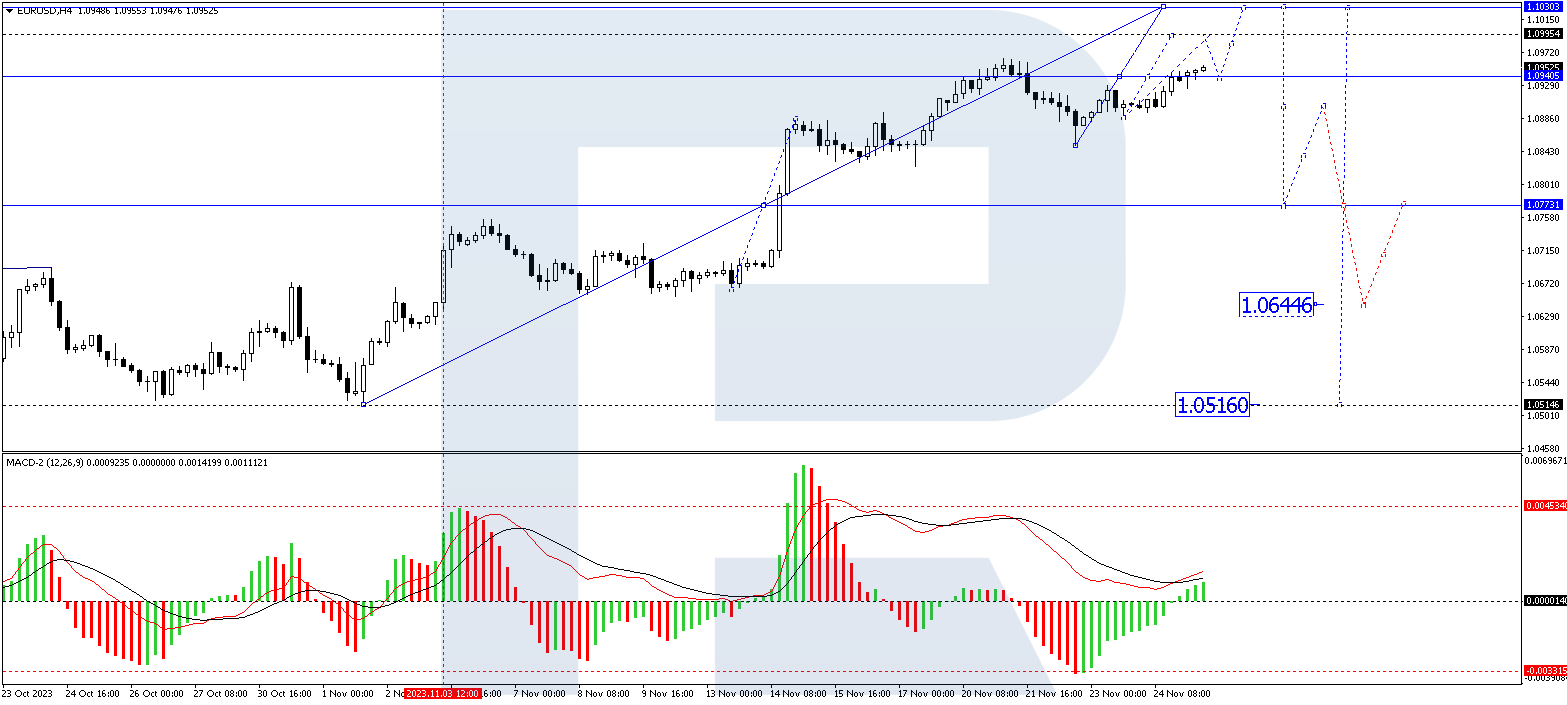
In the H4 chart of the EUR/USD pair, a consolidation pattern around 1.0940 has emerged, suggesting a potential breakout. The analysis predicts an upward move to 1.0990, followed by a possible pullback to 1.0940, and then another rise to 1.1030. This bullish outlook is supported by the Moving Average Convergence Divergence (MACD) indicator, which shows its signal line above zero and oriented upwards.
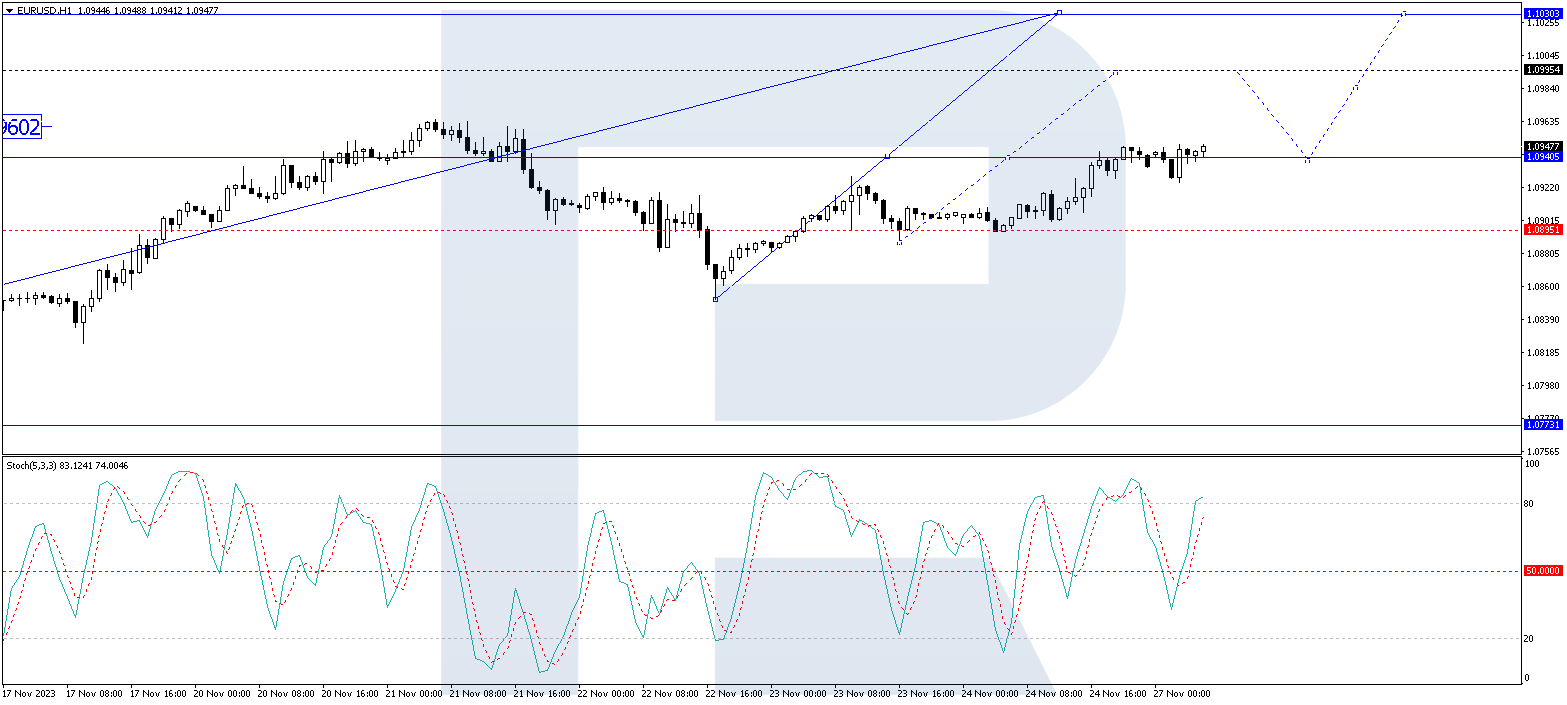
Similarly, the H1 chart for the EUR/USD pair displays a narrow consolidation around 1.0940. The market is anticipated to break upwards from this range, possibly reaching a local target of 1.0990. Upon hitting this level, a correction back to 1.0940 is expected. The Stochastic oscillator, with its signal line currently above 80, suggests the potential for a downward adjustment towards 50, supporting this forecast.
Disclaimer
Any forecasts contained herein are based on the author’s particular opinion. This analysis may not be treated as trading advice. RoboForex bears no responsibility for trading results based on trading recommendations and reviews contained herein.

- Geopolitical and macroeconomic conditions continue to pressure market sentiment Jul 20, 2026
- USD/JPY Poised to Continue Gains as Expensive Oil and Lack of Support Weigh on Yen Jul 20, 2026
- COT Metals Charts: Weekly Speculator Bets led by Copper & Steel Jul 18, 2026
- COT Bonds Charts: Weekly Speculator Bets led by 2-Year, SOFR 3M & 5-Year Bonds Jul 18, 2026
- COT Energy Charts: Weekly Speculator Bets led by Brent Oil & Heating Oil Jul 18, 2026
- COT Soft Commodities Charts: Weekly Speculator Bets led by Wheat, Corn & Soybean Meal Jul 18, 2026
- The Bank of Canada kept its interest rate unchanged. Platinum prices reached a three‑week high Jul 16, 2026
- Stock indices rose after the release of US inflation data. China’s GDP slowed sharply Jul 15, 2026
- GBP/USD Awaits Political News: What Will Happen Next Jul 15, 2026
- USD/JPY Holds at Highs: Pressure Lingers on Yen Jul 14, 2026
