By InvestMacro | COT | Data Tables | COT Leaders | Downloads | COT Newsletter

Here are the latest charts and statistics for the Commitment of Traders (COT) data published by the Commodities Futures Trading Commission (CFTC).
The latest COT data is updated through Tuesday April 12th and shows a quick view of how large traders (for-profit speculators and commercial entities) were positioned in the futures markets. All currency positions are in direct relation to the US dollar where, for example, a bet for the euro is a bet that the euro will rise versus the dollar while a bet against the euro will be a bet that the euro will decline versus the dollar.
Highlighting the COT currency data was the further rise of bearish bets in the Japanese yen currency futures contracts. Yen speculators pushed their bearish bets higher for a fifth straight week this week and for the sixth time in the past seven weeks. Over the past five weeks, yen bets have fallen by a total of -55,971 contracts, going from a total of -55,856 net positions on March 8th to a total of -111,827 net positions this week. Speculator positions have now slid all the way to the lowest standing of the past one hundred and eight-three weeks, dating back to October 9th of 2019.
This recent weakness in yen positions and the yen price has taken place while open interest has been increasing which shows an accelerating downtrend as prices have been falling as more traders have been entering the market on the bearish side. The speculator strength index is also showing that the Japanese yen positions are at a bearish extreme position with the strength index at a zero percent level (strength index is the current speculator standing compared to past three years, above 80 is bullish extreme, below 20 is bearish extreme).
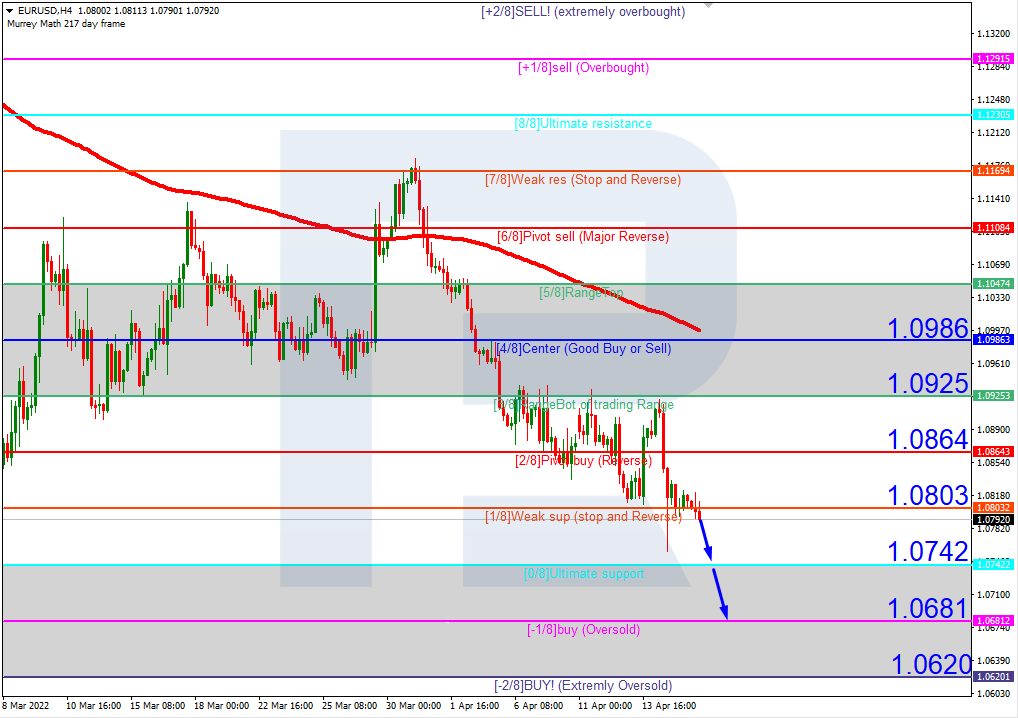
The fundamental backdrop has been the major driver of yen weakness. The Bank of Japan has continued on with its stimulus program and has not indicated any plans to move interest rates off their near-zero level while other central banks around the world have put the breaks on their stimulus actions and have started hiking their interest rates to try to tame inflationary pressures. The yen this week hit the lowest level in twenty years against the US dollar as the USDJPY currency pair trades above the 126.00 level. The other major currencies have all hit multi-year highs versus the yen as well.
Overall, the currencies with higher speculator bets this week were the Euro (11,690 contracts), Brazil real (603 contracts), New Zealand dollar (1,280 contracts), Canadian dollar (5,235 contracts), Bitcoin (411 contracts), Australian dollar (8,798 contracts) and the Mexican peso (14,050 contracts).
The currencies with declining bets were the US Dollar Index (-2,215 contracts), Japanese yen (-7,998 contracts), Swiss franc (-1,549 contracts) and the British pound sterling (-11,296 contracts).
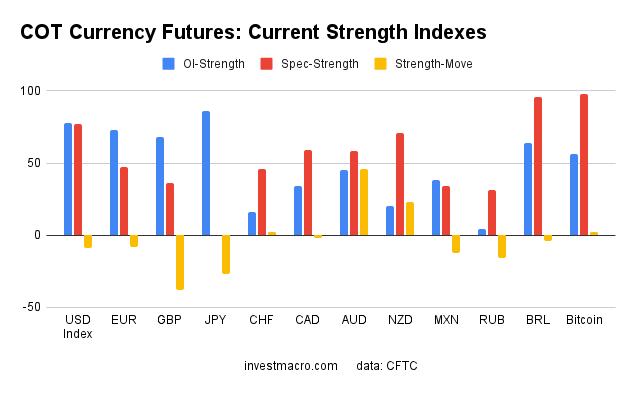 Speculator strength standings for each Currency where strength index is current net position compared to past three years, above 80 is bullish extreme, below 20 is bearish extreme
OI Strength = Current Open Interest level compared to last 3 years range
Spec Strength = Current Net Speculator level compared to last 3 years range
Strength Move = Six week change of Spec Strength
| Apr-12-2022 | OI | OI-Index | Spec-Net | Spec-Index | Com-Net | COM-Index | Smalls-Net | Smalls-Index |
|---|
| USD Index | 54,836 | 78 | 29,637 | 77 | -36,045 | 15 | 6,408 | 87 |
| EUR | 678,607 | 73 | 39,060 | 47 | -60,750 | 59 | 21,690 | 10 |
| GBP | 246,152 | 68 | -53,054 | 36 | 70,949 | 72 | -17,895 | 19 |
| JPY | 245,403 | 86 | -111,827 | 0 | 131,902 | 100 | -20,075 | 13 |
| CHF | 41,231 | 16 | -13,942 | 46 | 22,299 | 56 | -8,357 | 39 |
| CAD | 155,390 | 34 | 12,158 | 59 | -33,450 | 35 | 21,292 | 72 |
| AUD | 150,939 | 45 | -28,715 | 58 | 17,876 | 32 | 10,839 | 79 |
| NZD | 37,585 | 20 | -289 | 71 | -429 | 30 | 718 | 60 |
| MXN | 175,905 | 38 | 14,960 | 34 | -19,553 | 65 | 4,593 | 62 |
| RUB | 20,930 | 4 | 7,543 | 31 | -7,150 | 69 | -393 | 24 |
| BRL | 67,772 | 64 | 46,129 | 96 | -48,954 | 4 | 2,825 | 98 |
| Bitcoin | 10,632 | 56 | 167 | 98 | -439 | 0 | 272 | 19 |
US Dollar Index Futures:
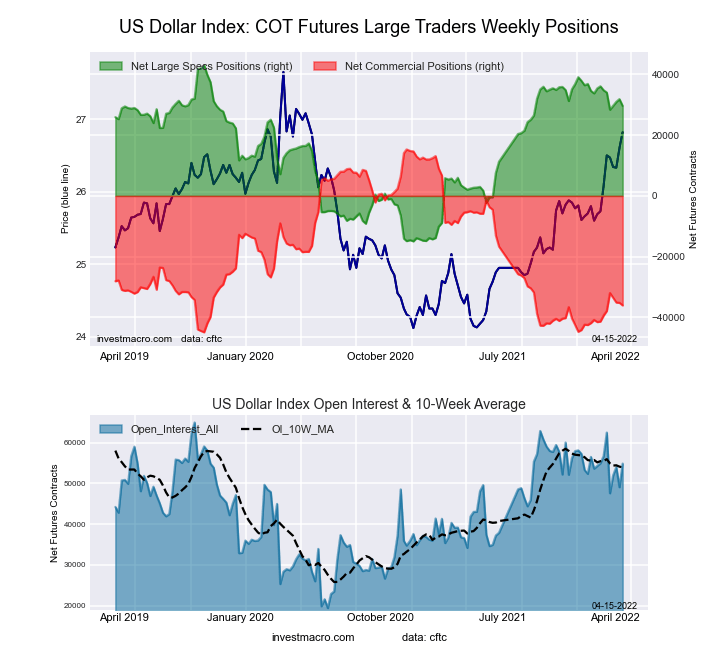 The US Dollar Index large speculator standing this week resulted in a net position of 29,637 contracts in the data reported through Tuesday. This was a weekly lowering of -2,215 contracts from the previous week which had a total of 31,852 net contracts.
This week’s current strength score (the trader positioning range over the past three years, measured from 0 to 100) shows the speculators are currently Bullish with a score of 76.9 percent. The commercials are Bearish-Extreme with a score of 14.7 percent and the small traders (not shown in chart) are Bullish-Extreme with a score of 86.6 percent.
| US DOLLAR INDEX Statistics | SPECULATORS | COMMERCIALS | SMALL TRADERS |
| – Percent of Open Interest Longs: | 80.8 | 2.2 | 15.3 |
| – Percent of Open Interest Shorts: | 26.7 | 68.0 | 3.6 |
| – Net Position: | 29,637 | -36,045 | 6,408 |
| – Gross Longs: | 44,303 | 1,226 | 8,402 |
| – Gross Shorts: | 14,666 | 37,271 | 1,994 |
| – Long to Short Ratio: | 3.0 to 1 | 0.0 to 1 | 4.2 to 1 |
| NET POSITION TREND: | | | |
| – Strength Index Score (3 Year Range Pct): | 76.9 | 14.7 | 86.6 |
| – Strength Index Reading (3 Year Range): | Bullish | Bearish-Extreme | Bullish-Extreme |
| NET POSITION MOVEMENT INDEX: | | | |
| – 6-Week Change in Strength Index: | -8.9 | 5.6 | 19.6 |
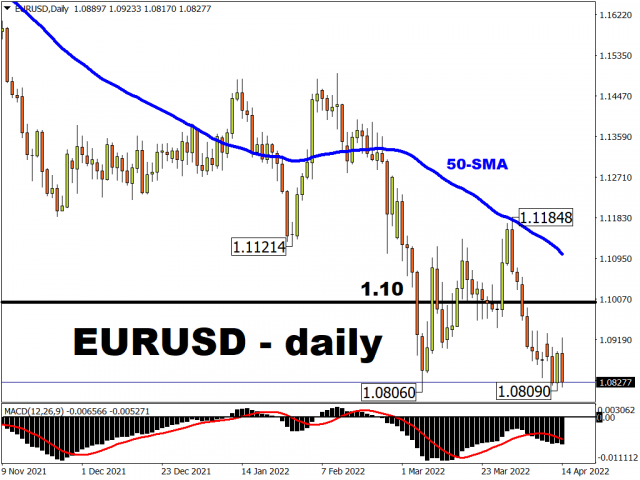
Euro Currency Futures:
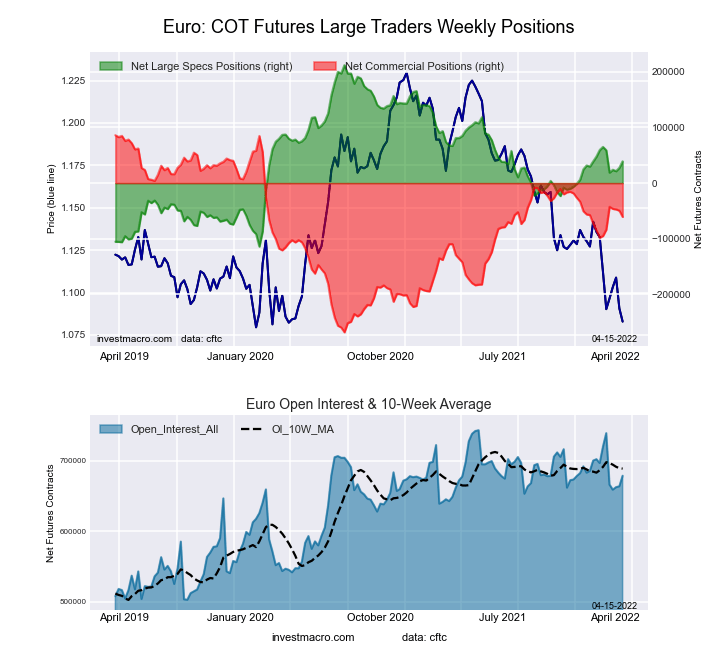 The Euro Currency large speculator standing this week resulted in a net position of 39,060 contracts in the data reported through Tuesday. This was a weekly advance of 11,690 contracts from the previous week which had a total of 27,370 net contracts.
This week’s current strength score (the trader positioning range over the past three years, measured from 0 to 100) shows the speculators are currently Bearish with a score of 47.0 percent. The commercials are Bullish with a score of 58.6 percent and the small traders (not shown in chart) are Bearish-Extreme with a score of 10.3 percent.
| EURO Currency Statistics | SPECULATORS | COMMERCIALS | SMALL TRADERS |
| – Percent of Open Interest Longs: | 32.7 | 53.0 | 11.7 |
| – Percent of Open Interest Shorts: | 26.9 | 62.0 | 8.5 |
| – Net Position: | 39,060 | -60,750 | 21,690 |
| – Gross Longs: | 221,645 | 359,853 | 79,165 |
| – Gross Shorts: | 182,585 | 420,603 | 57,475 |
| – Long to Short Ratio: | 1.2 to 1 | 0.9 to 1 | 1.4 to 1 |
| NET POSITION TREND: | | | |
| – Strength Index Score (3 Year Range Pct): | 47.0 | 58.6 | 10.3 |
| – Strength Index Reading (3 Year Range): | Bearish | Bullish | Bearish-Extreme |
| NET POSITION MOVEMENT INDEX: | | | |
| – 6-Week Change in Strength Index: | -7.9 | 9.7 | -14.0 |
British Pound Sterling Futures:
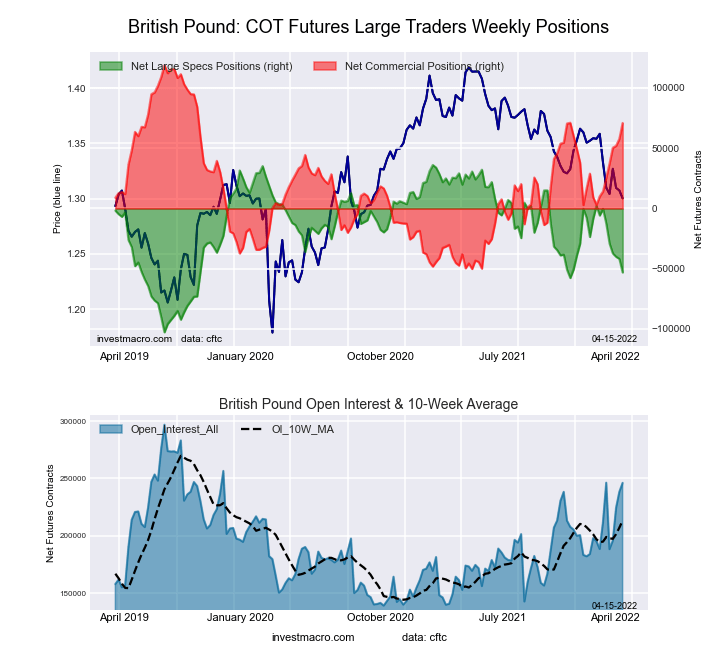 The British Pound Sterling large speculator standing this week resulted in a net position of -53,054 contracts in the data reported through Tuesday. This was a weekly lowering of -11,296 contracts from the previous week which had a total of -41,758 net contracts.
This week’s current strength score (the trader positioning range over the past three years, measured from 0 to 100) shows the speculators are currently Bearish with a score of 35.8 percent. The commercials are Bullish with a score of 71.6 percent and the small traders (not shown in chart) are Bearish-Extreme with a score of 18.6 percent.
| BRITISH POUND Statistics | SPECULATORS | COMMERCIALS | SMALL TRADERS |
| – Percent of Open Interest Longs: | 14.4 | 75.7 | 8.0 |
| – Percent of Open Interest Shorts: | 36.0 | 46.9 | 15.3 |
| – Net Position: | -53,054 | 70,949 | -17,895 |
| – Gross Longs: | 35,514 | 186,343 | 19,803 |
| – Gross Shorts: | 88,568 | 115,394 | 37,698 |
| – Long to Short Ratio: | 0.4 to 1 | 1.6 to 1 | 0.5 to 1 |
| NET POSITION TREND: | | | |
| – Strength Index Score (3 Year Range Pct): | 35.8 | 71.6 | 18.6 |
| – Strength Index Reading (3 Year Range): | Bearish | Bullish | Bearish-Extreme |
| NET POSITION MOVEMENT INDEX: | | | |
| – 6-Week Change in Strength Index: | -38.0 | 33.6 | -8.5 |
Japanese Yen Futures:
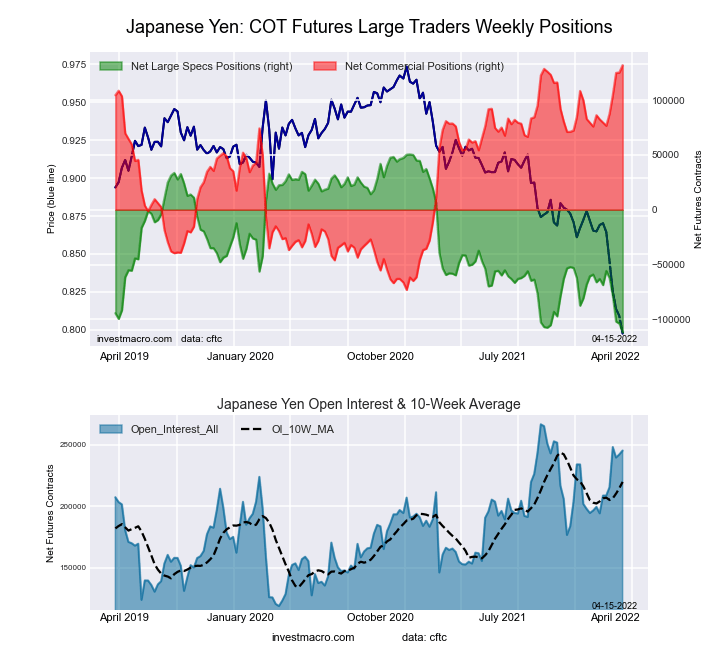 The Japanese Yen large speculator standing this week resulted in a net position of -111,827 contracts in the data reported through Tuesday. This was a weekly decrease of -7,998 contracts from the previous week which had a total of -103,829 net contracts.
This week’s current strength score (the trader positioning range over the past three years, measured from 0 to 100) shows the speculators are currently Bearish-Extreme with a score of 0.0 percent. The commercials are Bullish-Extreme with a score of 100.0 percent and the small traders (not shown in chart) are Bearish-Extreme with a score of 12.7 percent.
| JAPANESE YEN Statistics | SPECULATORS | COMMERCIALS | SMALL TRADERS |
| – Percent of Open Interest Longs: | 4.0 | 86.7 | 8.2 |
| – Percent of Open Interest Shorts: | 49.6 | 33.0 | 16.3 |
| – Net Position: | -111,827 | 131,902 | -20,075 |
| – Gross Longs: | 9,925 | 212,850 | 20,022 |
| – Gross Shorts: | 121,752 | 80,948 | 40,097 |
| – Long to Short Ratio: | 0.1 to 1 | 2.6 to 1 | 0.5 to 1 |
| NET POSITION TREND: | | | |
| – Strength Index Score (3 Year Range Pct): | 0.0 | 100.0 | 12.7 |
| – Strength Index Reading (3 Year Range): | Bearish-Extreme | Bullish-Extreme | Bearish-Extreme |
| NET POSITION MOVEMENT INDEX: | | | |
| – 6-Week Change in Strength Index: | -26.5 | 25.5 | -18.8 |
Swiss Franc Futures:
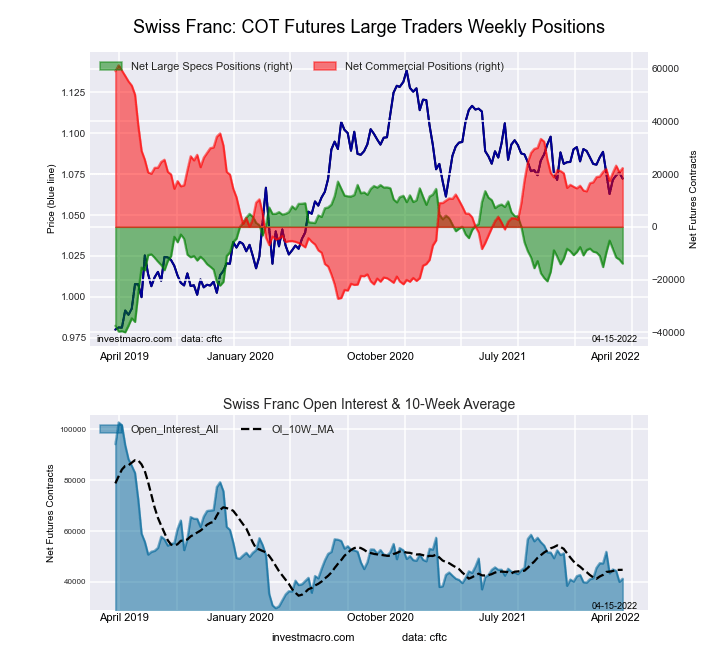 The Swiss Franc large speculator standing this week resulted in a net position of -13,942 contracts in the data reported through Tuesday. This was a weekly lowering of -1,549 contracts from the previous week which had a total of -12,393 net contracts.
This week’s current strength score (the trader positioning range over the past three years, measured from 0 to 100) shows the speculators are currently Bearish with a score of 45.6 percent. The commercials are Bullish with a score of 55.9 percent and the small traders (not shown in chart) are Bearish with a score of 38.8 percent.
| SWISS FRANC Statistics | SPECULATORS | COMMERCIALS | SMALL TRADERS |
| – Percent of Open Interest Longs: | 4.0 | 74.7 | 21.2 |
| – Percent of Open Interest Shorts: | 37.8 | 20.6 | 41.5 |
| – Net Position: | -13,942 | 22,299 | -8,357 |
| – Gross Longs: | 1,642 | 30,798 | 8,742 |
| – Gross Shorts: | 15,584 | 8,499 | 17,099 |
| – Long to Short Ratio: | 0.1 to 1 | 3.6 to 1 | 0.5 to 1 |
| NET POSITION TREND: | | | |
| – Strength Index Score (3 Year Range Pct): | 45.6 | 55.9 | 38.8 |
| – Strength Index Reading (3 Year Range): | Bearish | Bullish | Bearish |
| NET POSITION MOVEMENT INDEX: | | | |
| – 6-Week Change in Strength Index: | 2.3 | 1.6 | -8.0 |
Canadian Dollar Futures:
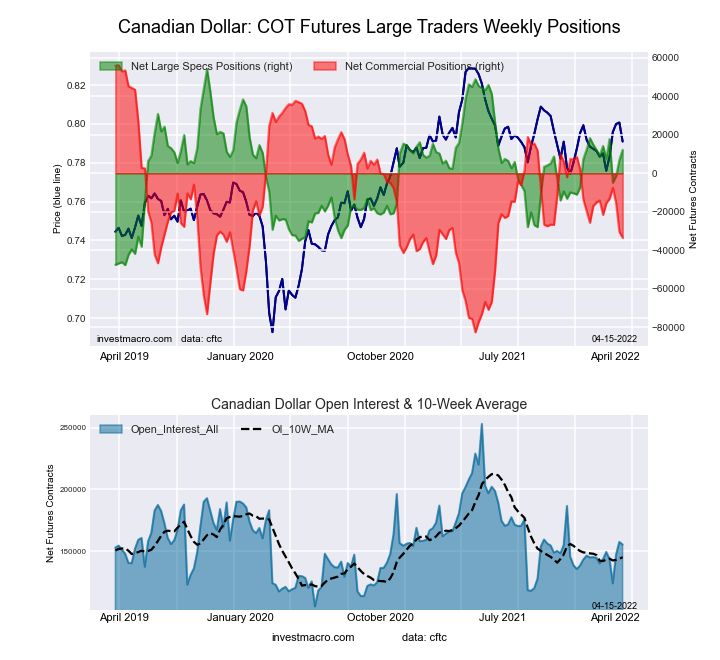 The Canadian Dollar large speculator standing this week resulted in a net position of 12,158 contracts in the data reported through Tuesday. This was a weekly gain of 5,235 contracts from the previous week which had a total of 6,923 net contracts.
This week’s current strength score (the trader positioning range over the past three years, measured from 0 to 100) shows the speculators are currently Bullish with a score of 58.8 percent. The commercials are Bearish with a score of 35.4 percent and the small traders (not shown in chart) are Bullish with a score of 72.2 percent.
| CANADIAN DOLLAR Statistics | SPECULATORS | COMMERCIALS | SMALL TRADERS |
| – Percent of Open Interest Longs: | 24.3 | 49.5 | 25.0 |
| – Percent of Open Interest Shorts: | 16.5 | 71.0 | 11.3 |
| – Net Position: | 12,158 | -33,450 | 21,292 |
| – Gross Longs: | 37,724 | 76,922 | 38,796 |
| – Gross Shorts: | 25,566 | 110,372 | 17,504 |
| – Long to Short Ratio: | 1.5 to 1 | 0.7 to 1 | 2.2 to 1 |
| NET POSITION TREND: | | | |
| – Strength Index Score (3 Year Range Pct): | 58.8 | 35.4 | 72.2 |
| – Strength Index Reading (3 Year Range): | Bullish | Bearish | Bullish |
| NET POSITION MOVEMENT INDEX: | | | |
| – 6-Week Change in Strength Index: | -2.0 | -8.6 | 27.6 |
Australian Dollar Futures:
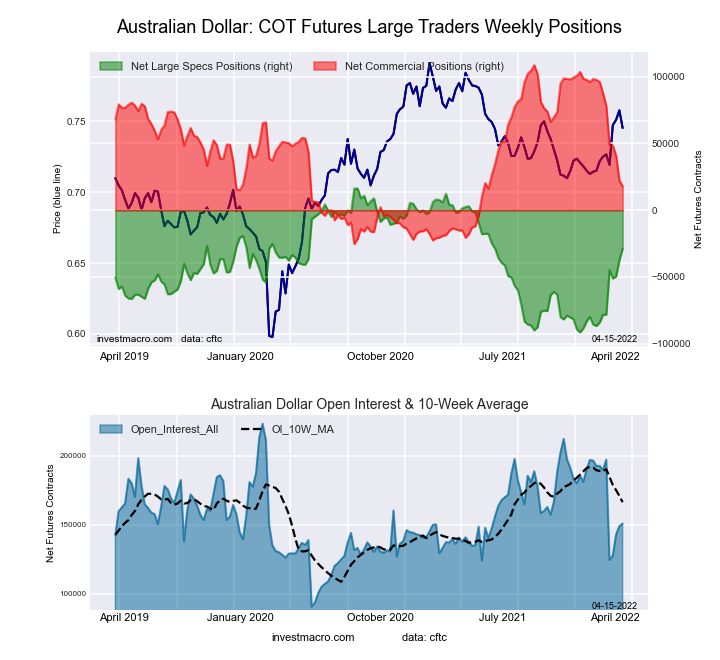 The Australian Dollar large speculator standing this week resulted in a net position of -28,715 contracts in the data reported through Tuesday. This was a weekly increase of 8,798 contracts from the previous week which had a total of -37,513 net contracts.
This week’s current strength score (the trader positioning range over the past three years, measured from 0 to 100) shows the speculators are currently Bullish with a score of 58.2 percent. The commercials are Bearish with a score of 32.2 percent and the small traders (not shown in chart) are Bullish with a score of 78.9 percent.
| AUSTRALIAN DOLLAR Statistics | SPECULATORS | COMMERCIALS | SMALL TRADERS |
| – Percent of Open Interest Longs: | 26.3 | 53.9 | 19.3 |
| – Percent of Open Interest Shorts: | 45.4 | 42.1 | 12.1 |
| – Net Position: | -28,715 | 17,876 | 10,839 |
| – Gross Longs: | 39,770 | 81,396 | 29,106 |
| – Gross Shorts: | 68,485 | 63,520 | 18,267 |
| – Long to Short Ratio: | 0.6 to 1 | 1.3 to 1 | 1.6 to 1 |
| NET POSITION TREND: | | | |
| – Strength Index Score (3 Year Range Pct): | 58.2 | 32.2 | 78.9 |
| – Strength Index Reading (3 Year Range): | Bullish | Bearish | Bullish |
| NET POSITION MOVEMENT INDEX: | | | |
| – 6-Week Change in Strength Index: | 46.0 | -52.2 | 49.4 |
New Zealand Dollar Futures:
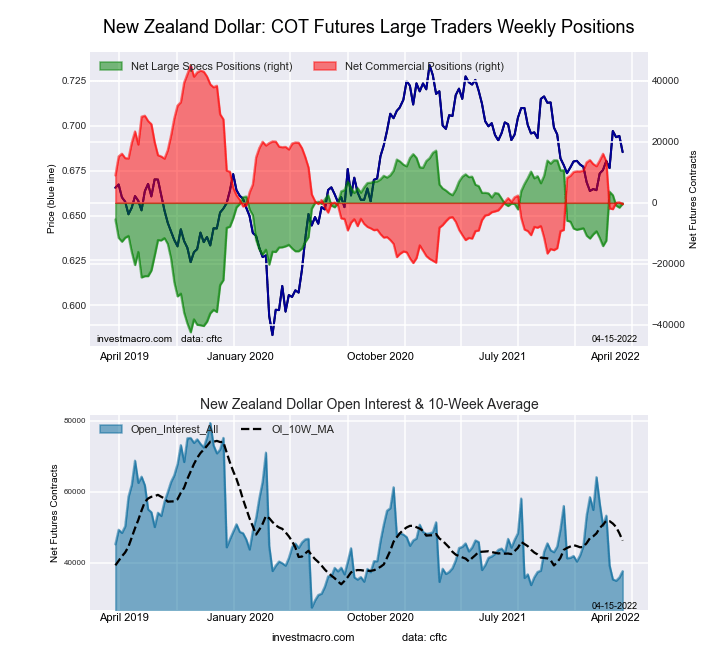 The New Zealand Dollar large speculator standing this week resulted in a net position of -289 contracts in the data reported through Tuesday. This was a weekly boost of 1,280 contracts from the previous week which had a total of -1,569 net contracts.
This week’s current strength score (the trader positioning range over the past three years, measured from 0 to 100) shows the speculators are currently Bullish with a score of 70.8 percent. The commercials are Bearish with a score of 29.7 percent and the small traders (not shown in chart) are Bullish with a score of 60.1 percent.
| NEW ZEALAND DOLLAR Statistics | SPECULATORS | COMMERCIALS | SMALL TRADERS |
| – Percent of Open Interest Longs: | 43.4 | 45.9 | 10.0 |
| – Percent of Open Interest Shorts: | 44.1 | 47.0 | 8.1 |
| – Net Position: | -289 | -429 | 718 |
| – Gross Longs: | 16,295 | 17,233 | 3,773 |
| – Gross Shorts: | 16,584 | 17,662 | 3,055 |
| – Long to Short Ratio: | 1.0 to 1 | 1.0 to 1 | 1.2 to 1 |
| NET POSITION TREND: | | | |
| – Strength Index Score (3 Year Range Pct): | 70.8 | 29.7 | 60.1 |
| – Strength Index Reading (3 Year Range): | Bullish | Bearish | Bullish |
| NET POSITION MOVEMENT INDEX: | | | |
| – 6-Week Change in Strength Index: | 23.3 | -25.5 | 30.2 |
Mexican Peso Futures:
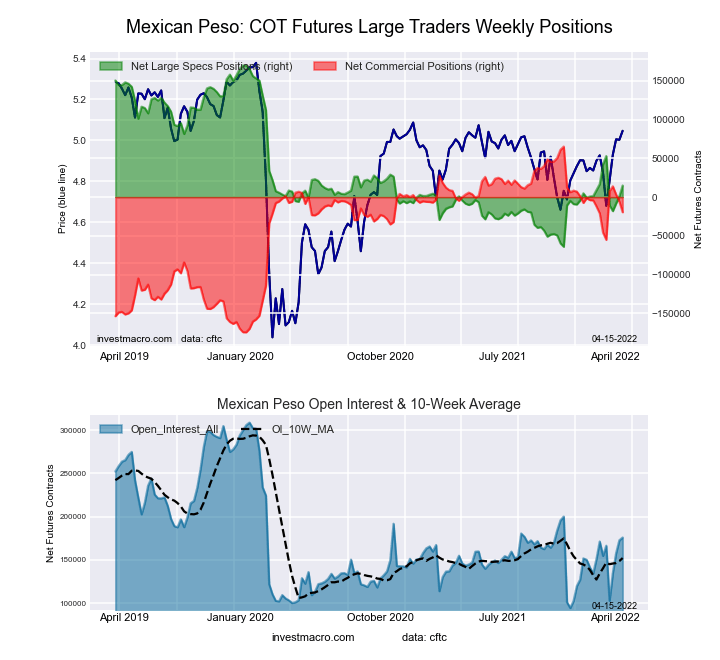 The Mexican Peso large speculator standing this week resulted in a net position of 14,960 contracts in the data reported through Tuesday. This was a weekly advance of 14,050 contracts from the previous week which had a total of 910 net contracts.
This week’s current strength score (the trader positioning range over the past three years, measured from 0 to 100) shows the speculators are currently Bearish with a score of 33.7 percent. The commercials are Bullish with a score of 64.6 percent and the small traders (not shown in chart) are Bullish with a score of 62.5 percent.
| MEXICAN PESO Statistics | SPECULATORS | COMMERCIALS | SMALL TRADERS |
| – Percent of Open Interest Longs: | 46.4 | 48.8 | 4.3 |
| – Percent of Open Interest Shorts: | 37.9 | 59.9 | 1.7 |
| – Net Position: | 14,960 | -19,553 | 4,593 |
| – Gross Longs: | 81,582 | 85,784 | 7,517 |
| – Gross Shorts: | 66,622 | 105,337 | 2,924 |
| – Long to Short Ratio: | 1.2 to 1 | 0.8 to 1 | 2.6 to 1 |
| NET POSITION TREND: | | | |
| – Strength Index Score (3 Year Range Pct): | 33.7 | 64.6 | 62.5 |
| – Strength Index Reading (3 Year Range): | Bearish | Bullish | Bullish |
| NET POSITION MOVEMENT INDEX: | | | |
| – 6-Week Change in Strength Index: | -11.7 | 10.9 | 4.9 |
Brazilian Real Futures:
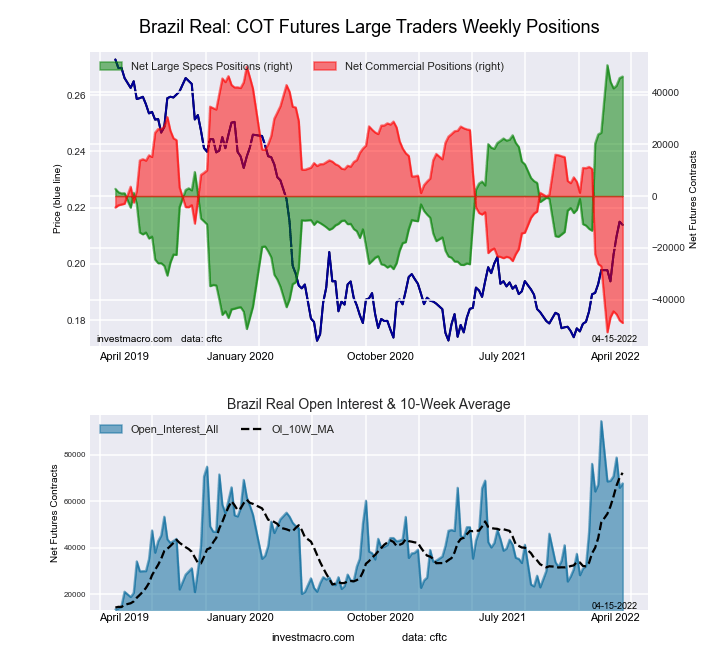 The Brazilian Real large speculator standing this week resulted in a net position of 46,129 contracts in the data reported through Tuesday. This was a weekly lift of 603 contracts from the previous week which had a total of 45,526 net contracts.
This week’s current strength score (the trader positioning range over the past three years, measured from 0 to 100) shows the speculators are currently Bullish-Extreme with a score of 95.7 percent. The commercials are Bearish-Extreme with a score of 3.5 percent and the small traders (not shown in chart) are Bullish-Extreme with a score of 97.9 percent.
| BRAZIL REAL Statistics | SPECULATORS | COMMERCIALS | SMALL TRADERS |
| – Percent of Open Interest Longs: | 77.6 | 15.6 | 6.6 |
| – Percent of Open Interest Shorts: | 9.6 | 87.9 | 2.5 |
| – Net Position: | 46,129 | -48,954 | 2,825 |
| – Gross Longs: | 52,624 | 10,591 | 4,496 |
| – Gross Shorts: | 6,495 | 59,545 | 1,671 |
| – Long to Short Ratio: | 8.1 to 1 | 0.2 to 1 | 2.7 to 1 |
| NET POSITION TREND: | | | |
| – Strength Index Score (3 Year Range Pct): | 95.7 | 3.5 | 97.9 |
| – Strength Index Reading (3 Year Range): | Bullish-Extreme | Bearish-Extreme | Bullish-Extreme |
| NET POSITION MOVEMENT INDEX: | | | |
| – 6-Week Change in Strength Index: | -4.2 | 3.3 | 10.9 |
Bitcoin Futures:
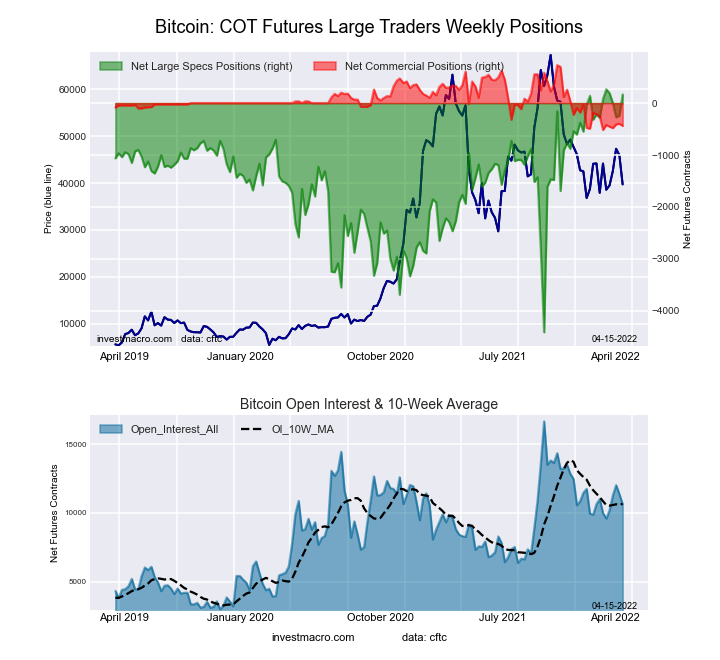 The Bitcoin large speculator standing this week resulted in a net position of 167 contracts in the data reported through Tuesday. This was a weekly gain of 411 contracts from the previous week which had a total of -244 net contracts.
This week’s current strength score (the trader positioning range over the past three years, measured from 0 to 100) shows the speculators are currently Bullish-Extreme with a score of 97.9 percent. The commercials are Bearish-Extreme with a score of 6.3 percent and the small traders (not shown in chart) are Bearish-Extreme with a score of 19.1 percent.
| BITCOIN Statistics | SPECULATORS | COMMERCIALS | SMALL TRADERS |
| – Percent of Open Interest Longs: | 77.2 | 3.6 | 10.0 |
| – Percent of Open Interest Shorts: | 75.6 | 7.7 | 7.4 |
| – Net Position: | 167 | -439 | 272 |
| – Gross Longs: | 8,207 | 382 | 1,058 |
| – Gross Shorts: | 8,040 | 821 | 786 |
| – Long to Short Ratio: | 1.0 to 1 | 0.5 to 1 | 1.3 to 1 |
| NET POSITION TREND: | | | |
| – Strength Index Score (3 Year Range Pct): | 97.9 | 6.3 | 19.1 |
| – Strength Index Reading (3 Year Range): | Bullish-Extreme | Bearish-Extreme | Bearish-Extreme |
| NET POSITION MOVEMENT INDEX: | | | |
| – 6-Week Change in Strength Index: | 1.9 | 6.3 | -3.8 |
Article By InvestMacro – Receive our weekly COT Reports by Email
*COT Report: The COT data, released weekly to the public each Friday, is updated through the most recent Tuesday (data is 3 days old) and shows a quick view of how large speculators or non-commercials (for-profit traders) were positioned in the futures markets.
The CFTC categorizes trader positions according to commercial hedgers (traders who use futures contracts for hedging as part of the business), non-commercials (large traders who speculate to realize trading profits) and nonreportable traders (usually small traders/speculators) as well as their open interest (contracts open in the market at time of reporting).See CFTC criteria here.


