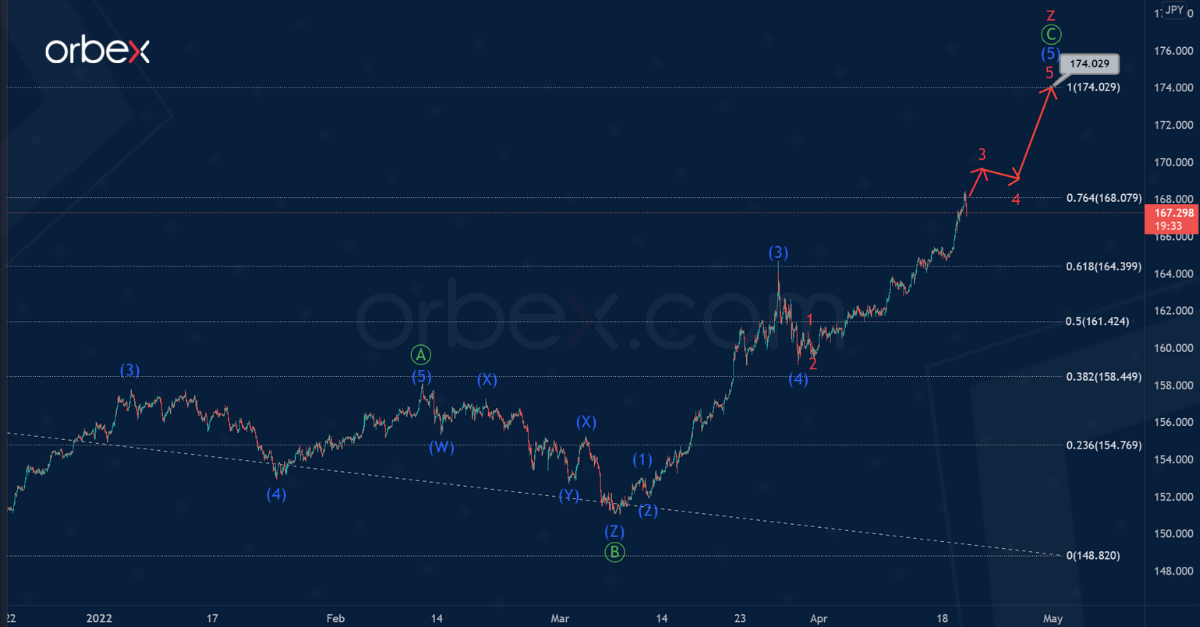
In the long term, the GBPJPY pair seems to be forming a large correction trend, taking the form of a triple zigzag. On the 1H timeframe, the final actionary wave z of the cycle degree is visible.
It is likely that the wave z takes the form of a simple zigzag Ⓐ-Ⓑ-Ⓒ of the primary degree. After the end of correction Ⓑ, which took the form of a triple combination, prices began to rise.
It is possible that the first four parts are complete as part of the potential impulse Ⓒ. The currency could now grow within the intermediate impulse (5).
The completion of the entire wave Ⓒ is possible near 174.02. At that level, wave z will be equal to wave y.
Alternatively, only the formation of the intermediate impulse (3), which is part of the primary wave Ⓒ, has come to an end.
Thus, a correction decline in the intermediate wave (4) could happen in the near future. It is possible that prices will fall to 159.74. At that level, correction (4) will be at 50% along the Fibonacci lines of impulse (3).
Orbex is a fully licensed broker that was established in 2011. Founded with a mission to serve its traders responsibly and provides traders with access to the world’s largest and most liquid financial markets. www.orbex.com
The US dollar rallies as a 75bp rate hike by the Fed could be on the table. The single currency remains under pressure after last week’s sell-off.
1.0920 has become an important supply area after buyers’ failed attempts to push higher. Further above, the psychological level of 1.1000 is another support-turned-resistance, suggesting that the path of least resistance is down.
Bearish trend followers could be waiting to fade the next rebound. The pair is treading water above 1.0760 as the RSI rises back to the neutrality area.
XAUUSD keeps high ground
Gold slipped as the greenback rallied across the board amid the Fed’s increasingly hawkish stance. The previous rally cleared the resistance at 1990 but struggled to grind to the psychological level of 2000.
A drop below 1961 revealed underlying weakness and caused a liquidation of leveraged buyers. 1940 at the base of a previous breakout is the next stop to gauge the bulls’ commitment.
An oversold RSI may trigger a buy-the-dips behavior and lead to a limited rebound. 1980 is now the closest resistance.
SPX 500 breaks channel
The S&P 500 recoups losses as the quarterly earnings season heats up. The index has been sliding down in a bearish channel, which indicates a cautious mood in the short term.
The latest rally above the upper band (4420) and resistance at 4460 could prompt sellers to cover their positions, paving the way for a potential reversal towards 4590.
4360 is a fresh support. In fact, a series of higher lows would show buying interest and convince followers to jump in with both feet. Otherwise, 4300 would be the next support.
Orbex is a fully licensed broker that was established in 2011. Founded with a mission to serve its traders responsibly and provides traders with access to the world’s largest and most liquid financial markets. www.orbex.com
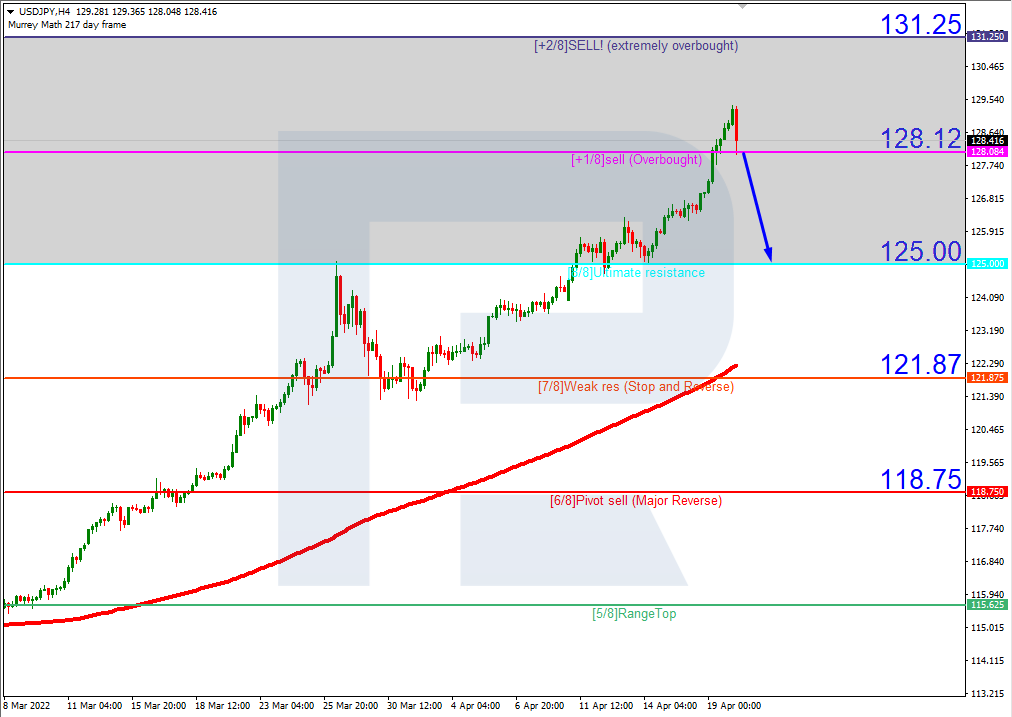
As we can see in the H4 chart, USDJPY is trading within the “overbought area”. In this case, the price is expected to break +1/8 and continue falling to reach the support at 8/8. However, this scenario may no longer be valid if the price breaks the resistance at +2/8 to the upside. After that, the lines in the chart will be redrawn, thus helping us to define new upside targets.
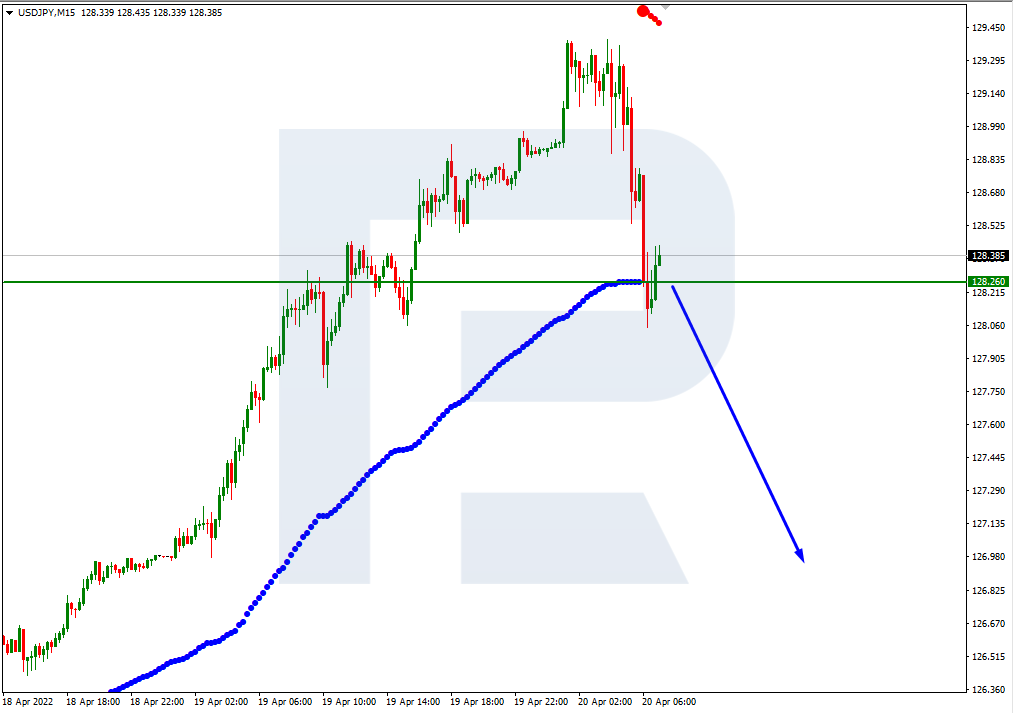
In the M15 chart, the pair may break the downside line of the VoltyChannel indicator and, as a result, continue trading downwards.
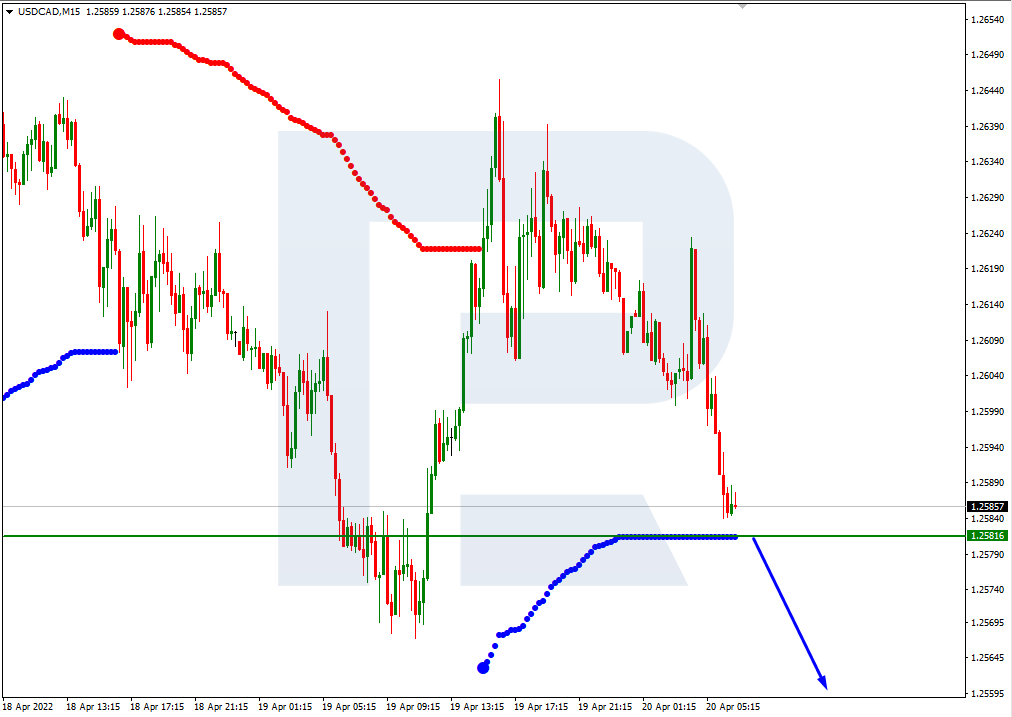
USDCAD, “US Dollar vs Canadian Dollar”
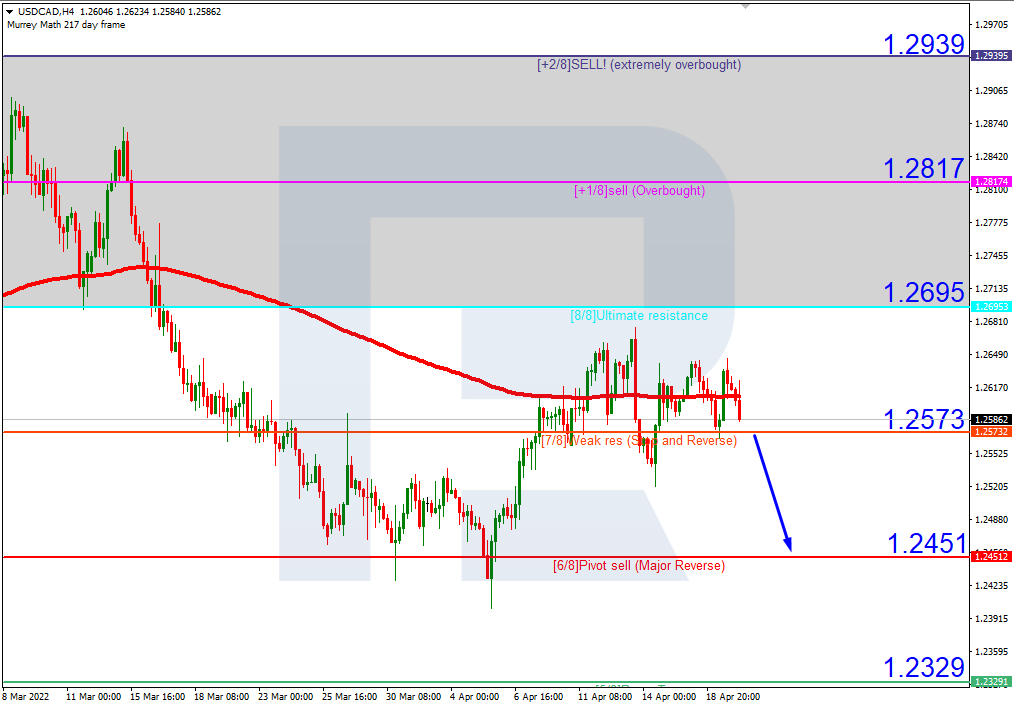
As we can see in the H4 chart, USDCAD is moving at the 200-day Moving Average, thus indicating a sideways tendency. However, the asset is trading not far from the “overbought area”, that’s why it is highly likely to resume falling. To confirm this idea, the pair must break 7/8. In this case, the next downside target will be the support at 6/8. On the other hand, this scenario may no longer be valid if the pair breaks the resistance at 8/8 to the upside. After that, the instrument may reverse and move upwards to reach +1/8.
In the M15 chart, the pair may break the downside line of the VoltyChannel indicator and, as a result, continue its decline towards 6/8 in the H4 chart.
Attention! Forecasts presented in this section only reflect the author’s private opinion and should not be considered as guidance for trading. RoboForex LP bears no responsibility for trading results based on trading recommendations described in these analytical reviews.
Minneapolis Fed President Neel Kashkari, a member of the Federal Open Market Committee (FOMC), said on Tuesday that if global supply chain disruptions remain, policymakers will have to take even more aggressive action to lower inflation. Meanwhile, Chicago Fed President Charles Evans, who is not a voting member of the FOMC this year, said he expects two 50-basis-point interest rate hikes at the next meetings. As markets tend to include the price in a future scenario, the dollar index is rising.
From the technical point of view, the trend on the EUR/USD currency pair in the hourly time frame is bearish. The price has taken a more flat structure. The MACD indicator has become inactive. Under such market conditions, it is possible to look for buy trades on intraday timeframes from the support level of 1.0727, but only with short targets and confirmation. Sell trades should be considered from the resistance levels of 1.0844 or 1.0889, but only after the additional confirmation.
Alternative scenario: if the price breaks out through the 1.0958 resistance level and fixes above, the uptrend will likely resume.
News feed for 2022.04.20:
– German Producer Price Index (m/m) at 09:00 (GMT+3);
– Eurozone Industrial Production (m/m) at 12:00 (GMT+3);
– US Existing Home Sales (m/m) at 17:00 (GMT+3).
The GBP/USD currency pair
Technical indicators of the currency pair:
Prev Open: 1.3011
Prev Close: 1.2998
% chg. over the last day: -0.10%
The situation on the GBP/USD currency pair remains the same. The British currency now looks more confident than the euro as the Bank of England raised interest rates three times. Economic data shows no signs of stagflation (slowing economic growth with high inflation). But GBP/USD quotes are declining due to the steady growth of the dollar index due to falling spread between the yields of the US and UK government bonds.
On the hourly time frame, the GBP/USD currency pair trend is still bearish. The MACD indicator has become positive, but there is divergence on the intraday timeframes. Under such market conditions, sell trades should be considered from the resistance level of 1.3094, but with confirmation. For buy deals, traders may consider the level of 1.3002, but only after the appearance of a bullish initiative and with short targets.
Alternative scenario: if the price breaks down through the 1.3147 resistance level and fixes above, the mid-term uptrend will likely be resumed.
There is no news feed for today.
The USD/JPY currency pair
Technical indicators of the currency pair:
Prev Open: 126.94
Prev Close: 128.88
% chg. over the last day: +1.53%
The dollar rose to a 20-year high against the Japanese yen on Tuesday. The opposite policies of the US and Japanese central banks led to a strong uptrend in the USD/JPY currency pair. There is growing dissatisfaction in Japan with ultra-soft monetary policy. Many analysts believe the central bank needs to step in to strengthen the yen temporarily. Morgan Stanley said in its latest research note that the yen’s decline against the dollar was justified by Japan’s deteriorating terms of trade and a surge in commodity prices, which led to higher import costs.
Trading recommendations
Support levels: 128.19, 126.69, 125.72, 124.66, 124.24, 122.97, 122.63, 121.81
Resistance levels: 129.36
The mid-term trend on the USD/JPY currency pair is bullish. The MACD indicator is positive, but there is a divergence on the higher timeframes. The price has significantly deviated from the moving averages and does not make significant pullbacks. Under such market conditions, it is best to look for buy deals, expecting the continuation of the uptrend, but after the price makes a pullback to the average lines. First of all, it is worth considering the support level of 126.69, but with additional confirmation. A resistance level of 129.36 may be considered for sell deals, but only with short targets.
Alternative scenario: If the price fixes below 124.66, the uptrend will likely be broken.
There is no news feed for today.
The USD/CAD currency pair
Technical indicators of the currency pair:
Prev Open: 1.2609
Prev Close: 1.2621
% chg. over the last day: +0.09%
The Canadian dollar is a commodity currency and is highly dependent on the movement of oil prices and the dollar index. The dollar index continued to rise yesterday, while oil prices went down, which caused the USD/CAD to rise. Oil prices jumped about 1% from the opening today after the International Monetary Fund (IMF) lowered its economic growth forecasts. This gave a boost to the Canadian dollar. From the fundamental point of view, the USD/CAD quotes do not have the unified dynamics now as both the Bank of Canada and the US Federal Reserve are aimed to tighten the monetary policy, and the growth in oil prices has a positive effect on the strengthening of the Canadian currency.
Trading recommendations
Support levels: 1.2567, 1.2467
Resistance levels: 1.2644, 1.2713, 1.2754, 1.2851
The USD/CAD currency pair trend is bullish in terms of technical analysis. Currently, the price is trading in the price corridor at the level of the moving averages. The MACD indicator has become inactive. It is worth trading only with short term targets, since there are fundamentally no prerequisites for a medium-term trend on the USD/CAD currency pair. Under such market conditions, it is better to look for buy trades on the lower timeframes from the support level of 1.2567, but it is better with additional confirmation because the level has already been tested. For sell deals, it is better to consider the resistance level of 1.2644, but it is also better with confirmation.
Alternative scenario: if the price breaks through and consolidates below 1.2467, the downtrend will likely be resumed.
News feed for 2022.04.20:
– Canada Consumer Price Index (m/m) at 15:30 (GMT+3);
This article reflects a personal opinion and should not be interpreted as an investment advice, and/or offer, and/or a persistent request for carrying out financial transactions, and/or a guarantee, and/or a forecast of future events.
Calling all beginner Forex traders! We’ve put together a comprehensive webinar dedicated to teaching you how to trade the financial markets!
Next Tuesday, April 26th our seasoned market expert David Kindley will be going live on Zoom to offer you a comprehensive beginners guide to Elliott Waves.
Sign up now for a chance to learn:
The Basics of Elliott Waves
Identifying the Wave Counts
Explaining Wave Formations
Riding the Waves to Prosperity
The webinar is free to attend, but seats are limited.
Book your spot today to start trading responsibly!
Orbex is a fully licensed broker that was established in 2011. Founded with a mission to serve its traders responsibly and provides traders with access to the world’s largest and most liquid financial markets. www.orbex.com
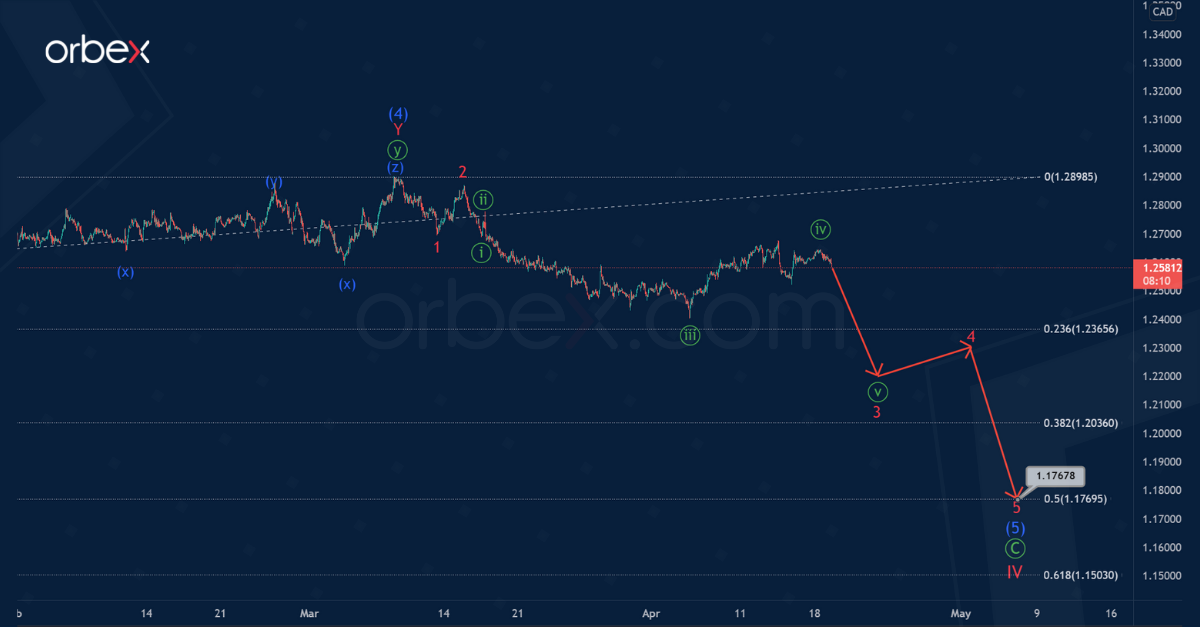
The current structure of the USDCAD currency pair indicates the construction of a large correction wave IV. This is part of the global cycle impulse. This correction consists of sub-waves Ⓐ-Ⓑ-Ⓒ.
On the current chart, we see the final part of the primary impulse wave Ⓒ. Wave Ⓒ consists of intermediate sub-waves (1)-(2)-(3)-(4)-(5). A deep intermediate correction (4) is currently developing. This can take the form of a triple W-X-Y-X-Z zigzag.
In the near future, prices could rise in the final minor sub-wave Z. This actionary sub-wave is likely to be a minute double zigzag, as shown on the chart, and will end its pattern near the 1.314 level.
At the specified price level, correction (4) will be at 50% of the previous impulse wave (3).
The alternative suggests that the formation of the intermediate correction (4) has ended. In this scenario, it does not have the form of a triple, but of a double zigzag W-X-Y.
Thus, in the last section of the chart, we see the development of the initial part of the intermediate wave (5), which can take the form of a minor impulse 1-2-3-4-5.
If this scenario is confirmed, then in the upcoming trading weeks, market participants can expect an impulse price decline in the 3-4-5 sub-waves, as shown on the chart. And the entire intermediate wave (5) is likely to end near 1.176.
At that level, impulse (5) will be at the 50% Fibonacci extension of intermediate impulse (3).
Orbex is a fully licensed broker that was established in 2011. Founded with a mission to serve its traders responsibly and provides traders with access to the world’s largest and most liquid financial markets. www.orbex.com
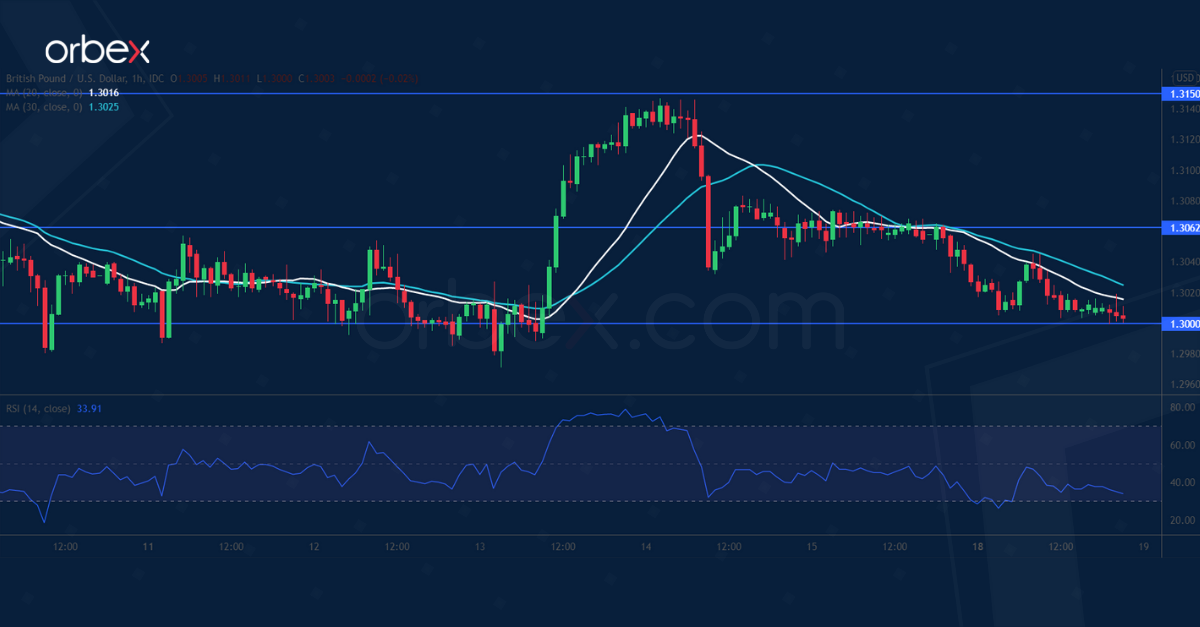
The US dollar continues upward as markets wager a 50 bp Fed hike next month. The pound’s latest rally came to a halt in the supply zone around 1.3150 which coincides with the 30-day moving average.
As the pair gives up its recent gains, the bears still retain control of the direction and seem to be ready to double down at rebounds. A drop below 1.3000 would attract momentum selling and push the pair to November 2020’s lows near 1.2860.
The RSI’s oversold situation may cause a temporary bounce towards 1.3060.
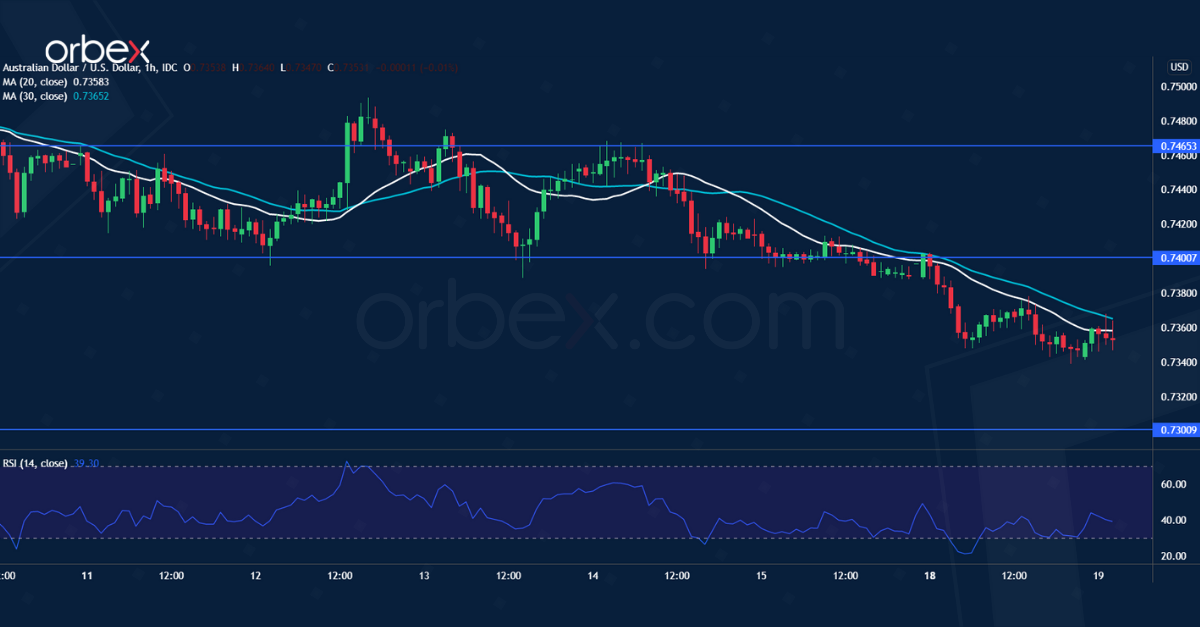
AUDUSD breaks support
The Australian dollar remains under pressure after dovish RBA minutes. A fall below the demand zone between 0.7380 and 0.7400, which sits on the 30-day moving average, has put the bulls further on the defensive.
As the short-term prospect turns bearish, depressed offers compound the lack of bids, driving the Aussie even lower. 0.7300 would be the next target.
As the RSI recovers into the neutral area, the pair may face stiff selling pressure around the support-turned-resistance at 0.7400.
GER 40 seeks support
The Dax 40 retreats as risk appetite remains subdued across equity markets. The index is still under pressure after it struggled to hold above the psychological level of 14000.
The current pennant may turn out to be another distribution phase. Additionally, a break below 13900 would make the index vulnerable to a new round of sell-off.
13600 would be the next support. The bulls need to push above 14320 in order to turn the cautious mood around. Then 14600 will be the final hurdle before an extended recovery could materialize.
Orbex is a fully licensed broker that was established in 2011. Founded with a mission to serve its traders responsibly and provides traders with access to the world’s largest and most liquid financial markets. www.orbex.com
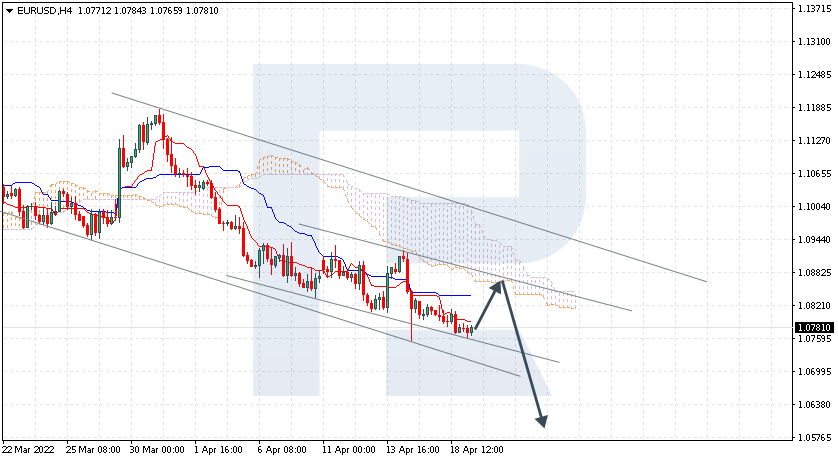
EURUSD is rebounding from Tenkan-Sen at 1.0781; it is testing the downside border of a large Triangle pattern. The instrument is currently moving below Ichimoku Cloud, thus indicating a descending tendency. The markets could indicate that the price may test the cloud’s downside border at 1.0835 and then resume moving downwards to reach 1.0585. Another signal in favour of a further downtrend will be a rebound from the descending channel’s upside border. However, the bearish scenario may no longer be valid if the price breaks the cloud’s upside border and fixes above 1.0955. In this case, the pair may continue growing towards 1.1045. If the asset fixes below 1.0600, it will break the pattern’s downside border and the next downside target will be at 0.9880.
XAUUSD, “Gold vs US Dollar”
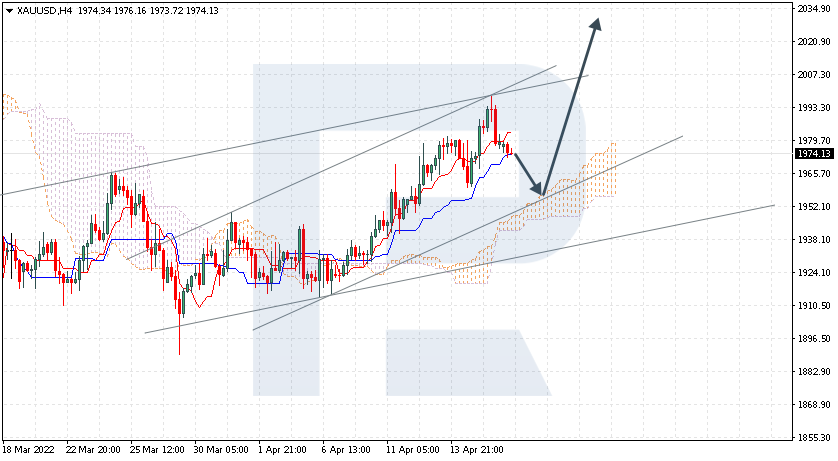
XAUUSD is testing Tenkan-Sen and Kijun-Sen at 1974.00. The instrument is currently moving above Ichimoku Cloud, thus indicating an ascending tendency. The markets could indicate that the price may test the cloud’s upside border at 1960.00 and then resume moving upwards to reach 2025.00. Another signal in favour of a further uptrend will be a rebound from the rising channel’s downside border. However, the bullish scenario may no longer be valid if the price breaks the cloud’s downside border and fixes below 1935.00. In this case, the pair may continue falling towards 1880.00. The asset has also completed a Double Bottom reversal pattern. If, after another descending correction, bulls manage to fix quickly above 1965.00 and rebound from the pattern’s upside border, the next upside target will be at 2040.00.
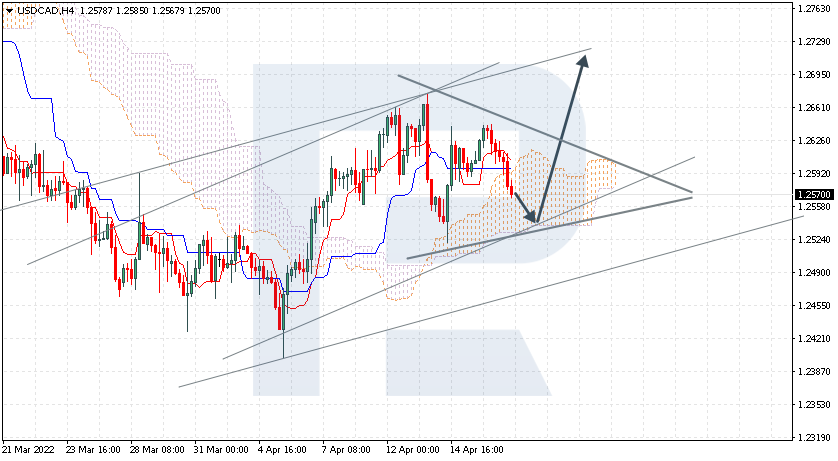
USDCAD, “US Dollar vs Canadian Dollar”
USDCAD continues correcting within the bullish channel at 1.2570; bulls have failed to fix above the resistance at 1.2655 and continue pushing the price towards 1.2900. The instrument is currently moving inside Ichimoku Cloud, thus indicating a sideways tendency. The markets could indicate that the price may test the cloud’s downside border at 1.2530 and then resume moving upwards to reach 1.2695. Another signal in favour of a further uptrend will be a rebound from the rising channel’s downside border. However, the bullish scenario may no longer be valid if the price breaks the cloud’s downside border and fixes below 1.2505. In this case, the pair may continue falling towards 1.2415. To confirm a further uptrend, the price must break the upside border of the Triangle pattern and fix above 1.2635. The pattern materialisation target will be at 1.2755.
Attention! Forecasts presented in this section only reflect the author’s private opinion and should not be considered as guidance for trading. RoboForex LP bears no responsibility for trading results based on trading recommendations described in these analytical reviews.
As we can see in the H4 chart, XAUUSD has formed a Long-Legged Doji reversal pattern not far from the resistance area. At the moment, the asset is reversing in the form of another correctional impulse. In this case, the downside correctional target may be the support level at 1965.00. At the same time, an opposite scenario implies that the price may grow to reach 1995.00 and continue the ascending tendency without correcting and testing the support level.
NZDUSD, “New Zealand vs US Dollar”
As we can see in the H4 chart, NZDUSD has formed a Hammer reversal pattern close to the support area. At the moment, the asset is reversing in the form of a new ascending impulse. In this case, the upside target is at 0.6785. After that, the asset may rebound from the resistance level and resume moving downwards. However, an alternative scenario implies that the price may fall to reach 0.6685 without any corrections.
GBPUSD, “Great Britain Pound vs US Dollar”
As we can see in the H4 chart, GBPUSD has formed a Hammer reversal pattern near the support area. At the moment, the pair is reversing and may form a new ascending impulse. In this case, the upside target may be at 1.3045. After testing the resistance level, the market may rebound from it and resume trading downwards. Still, there might be an alternative scenario, according to which the asset may fall to reach 1.2935 without any pullbacks.
Attention! Forecasts presented in this section only reflect the author’s private opinion and should not be considered as guidance for trading. RoboForex LP bears no responsibility for trading results based on trading recommendations described in these analytical reviews.
Yesterday, there was a bank holiday in almost all European countries, so volatility was low. Fundamentally, the European currency now looks weaker than the dollar index as the Fed is already tightening monetary policy. At the same time, the ECB will only complete its bond-buying program in the third quarter of 2022. Russia continues to attack Ukraine, so Europe will continue to be under price pressure.
From the technical point of view, the trend on the EUR/USD currency pair in the hourly time frame is bearish. Against the uncertainty from ECB, the euro continues to lose ground. The MACD indicator has become negative, but there are signs of divergence. Under such market conditions, it is possible to look for buy trades on intraday timeframes from the support level of 1.0727, but only with short targets and confirmation. Sell trades should be considered from the resistance level of 1.0844 or 1.0889, but only after the additional confirmation.
Alternative scenario: if the price breaks out through the 1.0958 resistance level and fixes above, the uptrend will likely resume.
News feed for 2022.04.19:
– US Building Permits (m/m) at 15:30 (GMT+3).
The GBP/USD currency pair
Technical indicators of the currency pair:
Prev Open: 1.3046
Prev Close: 1.3010
% chg. over the last day: -0.27%
The British currency now looks more confident than the euro as the Bank of England has already raised interest rates three times. Economic data shows no signs of stagflation (slowing economic growth with high inflation). But GBP/USD is still declining due to the growth of the dollar index.
On the hourly time frame, the GBP/USD currency pair trend is still bearish. The MACD indicator has become negative, but there is divergence on the intraday timeframes. Under such market conditions, sell trades should be looked for from the resistance level of 1.3027 or 1.3094, but with confirmation. For buy deals, traders may consider the level of 1.2993, but only after the appearance of a bullish initiative and with short targets.
Alternative scenario: if the price breaks down through the 1.3147 resistance level and fixes above, the mid-term uptrend will likely be resumed.
There is no news feed for today.
The USD/JPY currency pair
Technical indicators of the currency pair:
Prev Open: 126.41
Prev Close: 126.99
% chg. over the last day: +0.46%
The Japanese yen is approaching its longest decline in 20 years as divergent policies between the central banks of Japan and the US have led to a depreciation of the Japanese currency and a rise in the dollar index. Many investors are betting on a further fall in the yen. Recent CFTC data shows that net short positions in the yen are the largest in three and a half years. Japanese Finance Minister Shunichi Suzuki said on Tuesday that the damage to the economy from the weakening yen is now greater than the benefits, which is the clearest warning against the recent currency decline.
Trading recommendations
Support levels: 126.69, 125.72, 124.66, 124.24, 122.97, 122.63, 121.81
Resistance levels: 128.19
The medium-term trend on the USD/JPY currency pair is bullish. The MACD indicator has become positive again, but on the higher timeframes, there is a divergence. The price has deviated greatly from the moving averages and does not make significant pullbacks. Under such market conditions, it is best to look for buy deals, expecting the continuation of the uptrend, but after the price makes a pullback to the average lines. First of all, it is worth considering the support level of 126.69, but with additional confirmation. A resistance level of 128.19 may be considered for sell deals, but only after the appearance of a bearish initiative.
Alternative scenario: If the price fixes below 124.66, the uptrend will likely be broken.
News feed for 2022.04.19:
– Japan Industrial Production (m/m) at 07:30 (GMT+3).
The USD/CAD currency pair
Technical indicators of the currency pair:
Prev Open: 1.2608
Prev Close: 1.2608
% chg. over the last day: 0.00%
The Canadian dollar is a commodity currency and is highly dependent on the movement of oil prices and the dollar index. The dollar index continued to rise, but oil prices are also rising for the fourth day in a row, as disruptions in Libya worsen the situation for supplies from Russia. As a result, in terms of fundamental factors, USD/CAD quotes have no unified dynamics at the moment.
Trading recommendations
Support levels: 1.2567, 1.2467
Resistance levels: 1.2644, 1.2713, 1.2754, 1.2851
The USD/CAD currency pair is bullish in terms of technical analysis. The MACD indicator has become negative. Trade is worth it only with short targets because, fundamentally, there are no prerequisites for the medium-term trend on the USD/CAD currency pair. Under such market conditions, it is better to look for buy trades on the lower timeframes from the support level of 1.2567, but it is better with additional confirmation. For sell deals, it is better to consider the resistance level of 1.2644, but it is also better with confirmation.
Alternative scenario: if the price breaks through and consolidates below 1.2467, the downtrend will likely be resumed.
This article reflects a personal opinion and should not be interpreted as an investment advice, and/or offer, and/or a persistent request for carrying out financial transactions, and/or a guarantee, and/or a forecast of future events.