
Article By RoboForex.com
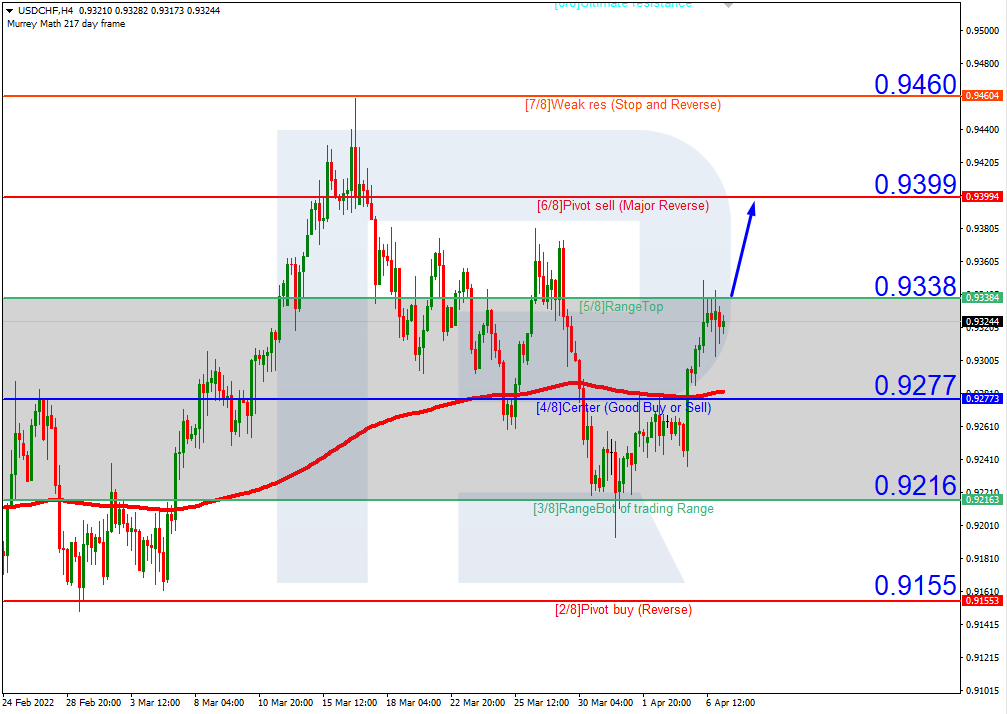
USDCHF, “US Dollar vs Swiss Franc”
In the H4 chart, after breaking the 200-day Moving Average, USDCHF is trading above it to indicate a possible ascending tendency. In this case, the price is expected to break the resistance at 5/8 and then continue growing to reach 6/8. However, this scenario may be cancelled if the price breaks the support at 4/8 to the downside. After that, the instrument may reverse and fall towards 3/8.

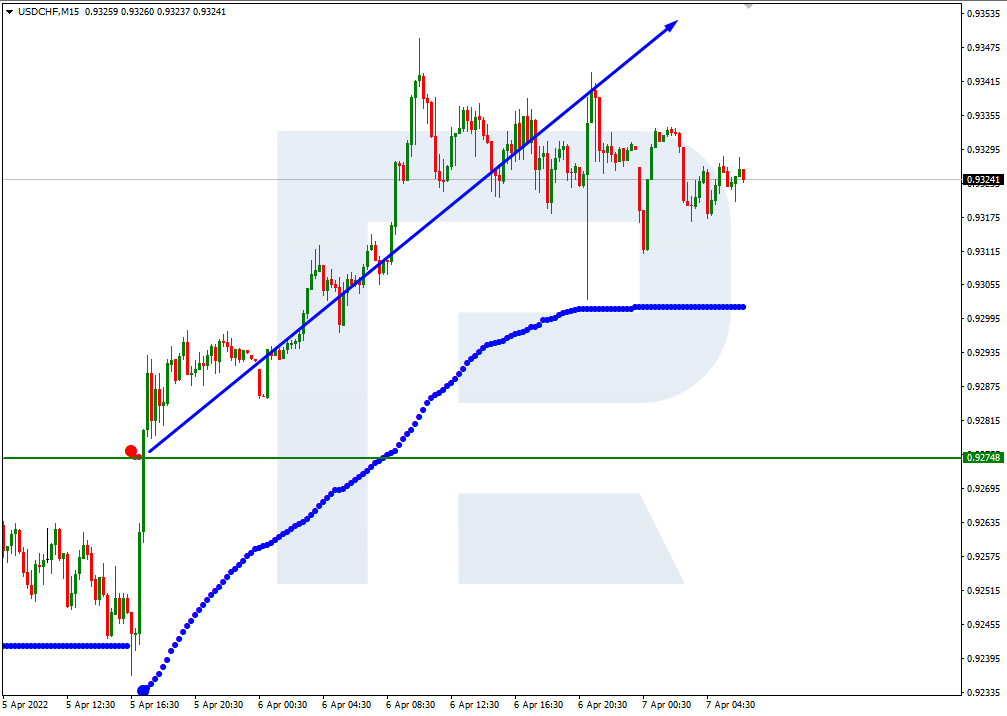
As we can see in the M15 chart, the pair has broken the upside line of the VoltyChannel indicator and, as a result, may continue trading upwards.
Free Reports:
 Sign Up for Our Stock Market Newsletter – Get updated on News, Charts & Rankings of Public Companies when you join our Stocks Newsletter
 Get our Weekly Commitment of Traders Reports - See where the biggest traders (Hedge Funds and Commercial Hedgers) are positioned in the futures markets on a weekly basis.
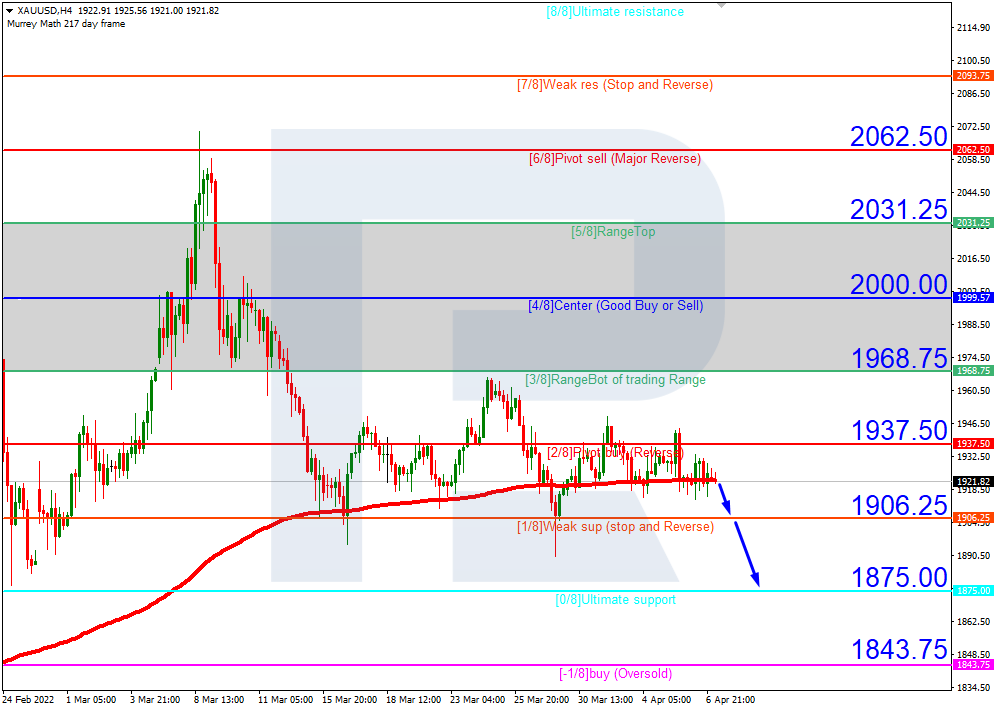
XAUUSD, “Gold vs US Dollar”
As we can see in the H4 chart, XAUUSD is trading at the 200-day Moving Average, thus indicating a sideways tendency. In this case, there might be two possible scenarios, and at first glimpse, each of them has equal chances. The first scenario implies that the asset may break the support at 1/8 and continue falling towards 0/8, while the second one suggests a breakout of the resistance at 2/8 and a further uptrend to reach 3/8. If we take a closer look at the chart, we may assume that the second scenario is less likely, because the price already tried to break the resistance at 2/8 but failed. Hence, the former scenario is more probable.
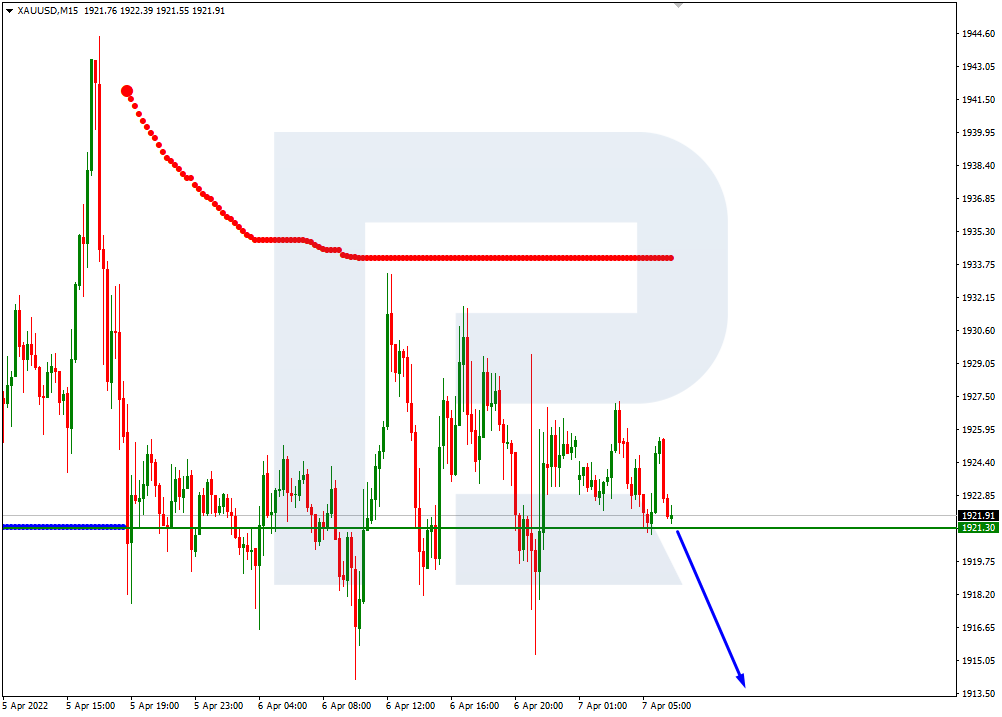
In the M15 chart, the pair may break the downside line of the VoltyChannel indicator and, as a result, continue falling.
Article By RoboForex.com
Attention!
Forecasts presented in this section only reflect the author’s private opinion and should not be considered as guidance for trading. RoboForex LP bears no responsibility for trading results based on trading recommendations described in these analytical reviews.

- Gold Declines: Fed Policy and Geopolitics Weigh Jun 30, 2026
- Oil prices have once again risen above 70 dollars per barrel. The Australian dollar has updated a three‑month low Jun 30, 2026
- EUR/USD: The Advantage Remains with the Dollar Jun 29, 2026
- Escalation of the US–Iran conflict is once again supporting the rise in oil prices Jun 29, 2026
- Oil prices fall back to pre‑war levels. Silver drops to a 7‑month low Jun 25, 2026
- Gold Falls to an Eight-Month Low: This May Not Be the Bottom Jun 25, 2026
- Stock indices came under heavy selling pressure amid growing skepticism about AI investments Jun 24, 2026
- The Pound Is Pressured Not by Politics, but by a Strong US Dollar Jun 24, 2026
- Global crude oil prices continued to decline. The AUD/USD exchange rate hit an 11‑week low Jun 23, 2026
- EUR/USD Remains Under Sellers’ Control as the Dollar Stays Strong Jun 23, 2026