
By Orbex
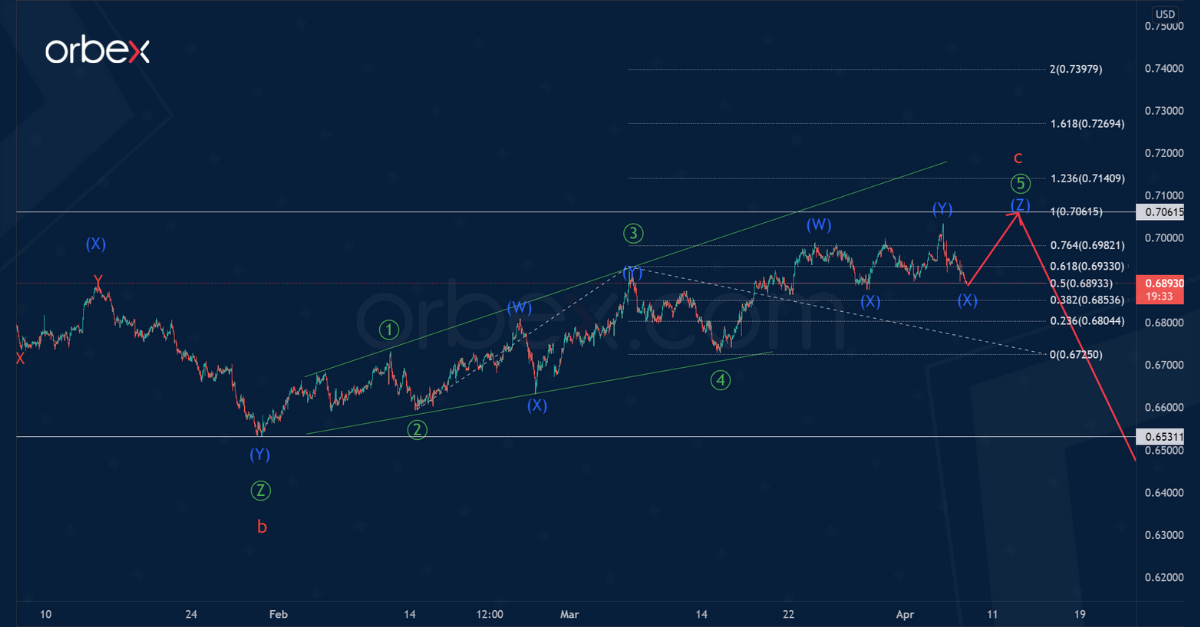
The internal structure of the NZDUSD pair hints at a cycle zigzag pattern that consists of three main sub-waves a-b-c.
On the 1H timeframe, we see the end of a major correction wave b of the cycle degree. It looks fully complete, taking the form of a primary triple Ⓦ-Ⓧ-Ⓨ-Ⓧ-Ⓩ zigzag.
After the completion of the cycle correction, the development of a cycle wave c began. This will most likely take the form of an ending diagonal, and consists of primary sub-waves ①-②-③-④-⑤.
Currently, the final correction sub-wave ⑤ is under development. The entire diagonal may complete near 0.706. At that level, the primary waves ③ and ⑤ will be equal.
Free Reports:
 Download Our Metatrader 4 Indicators – Put Our Free MetaTrader 4 Custom Indicators on your charts when you join our Weekly Newsletter
 Get our Weekly Commitment of Traders Reports - See where the biggest traders (Hedge Funds and Commercial Hedgers) are positioned in the futures markets on a weekly basis.
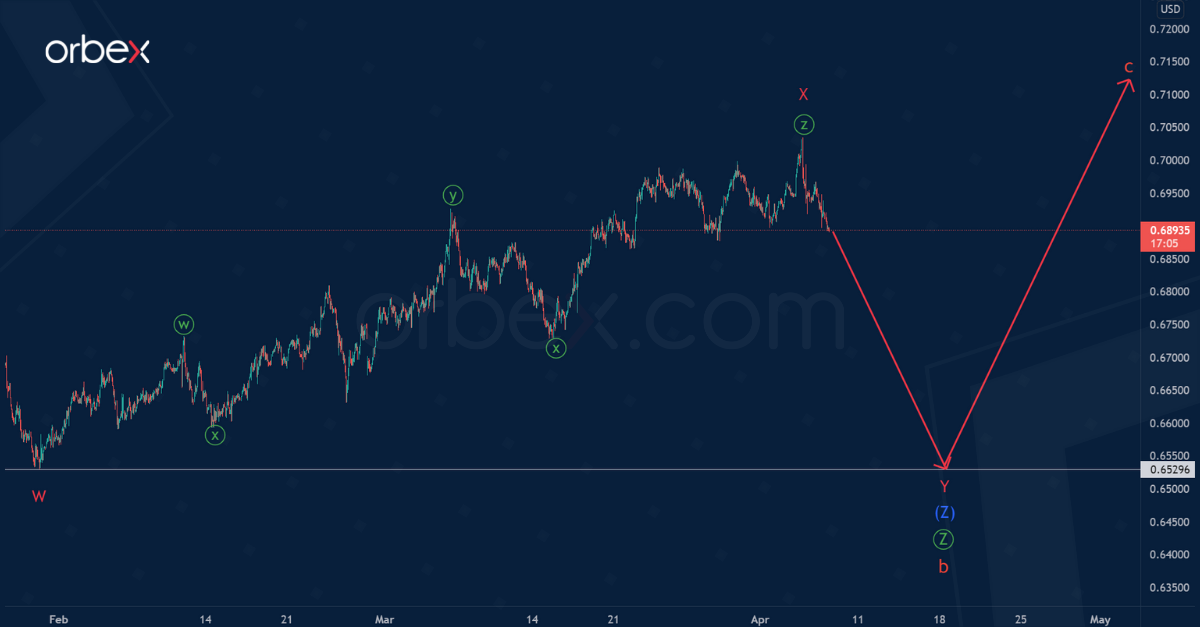
In the second variant, the formation of the correction wave b has not yet ended. The primary wave Ⓩ could be a triple (W)-(X)-(Y)-(X)-(Z) zigzag of the intermediate degree.
According to this view, the first four parts of the intermediate pattern have ended. And now the market is in the intermediate wave (Z).
Wave (Z) is similar to the minor double zigzag W-X-Y, in which the intervening wave X came to an end.
In the near future, prices are likely to fall to the level of 0.652 in wave Y. This is the previous low, marked by the minor wave W.
Open your account now to gain access to unlimited Orbex Trading Education!
![]() Article by Orbex
Article by Orbex
Orbex is a fully licensed broker that was established in 2011. Founded with a mission to serve its traders responsibly and provides traders with access to the world’s largest and most liquid financial markets. www.orbex.com

- Oil prices fall back to pre‑war levels. Silver drops to a 7‑month low Jun 25, 2026
- Gold Falls to an Eight-Month Low: This May Not Be the Bottom Jun 25, 2026
- Stock indices came under heavy selling pressure amid growing skepticism about AI investments Jun 24, 2026
- The Pound Is Pressured Not by Politics, but by a Strong US Dollar Jun 24, 2026
- Global crude oil prices continued to decline. The AUD/USD exchange rate hit an 11‑week low Jun 23, 2026
- EUR/USD Remains Under Sellers’ Control as the Dollar Stays Strong Jun 23, 2026
- Gold Falls for the Third Consecutive Week: Is There Still Upside Potential? Jun 22, 2026
- Bank Indonesia raised its interest rate. Norges Bank and the SNB left rates unchanged Jun 19, 2026
- EUR/USD Loses Ground as Market Sentiment Favours the US Dollar Jun 19, 2026
- GBPUSD Awaits Bank of England Meeting Near April Lows Jun 18, 2026