By InvestMacro | COT | Data Tables | COT Leaders | Downloads | COT Newsletter
Here are the latest charts and statistics for the Commitment of Traders (COT) data published by the Commodities Futures Trading Commission (CFTC).
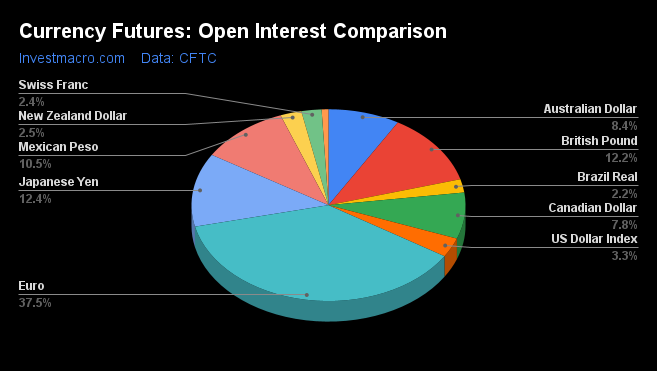
The latest COT data is updated through Tuesday July 26th and shows a quick view of how large traders (for-profit speculators and commercial entities) were positioned in the futures markets. All currency positions are in direct relation to the US dollar where, for example, a bet for the euro is a bet that the euro will rise versus the dollar while a bet against the euro will be a bet that the euro will decline versus the dollar.
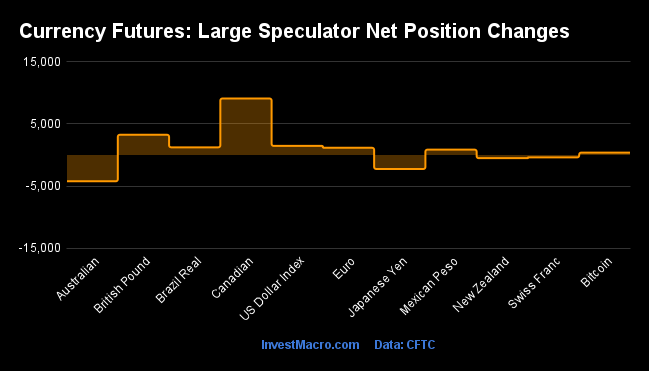
Weekly Speculator Changes
COT currency market speculator bets were mostly higher overall this week as seven out of the eleven currency markets we cover had higher positioning while the other five markets had lower speculator contracts.
Leading the gains for the currency markets was the Canadian dollar (9,102 contracts) with the British pound sterling (3,260 contracts), US Dollar Index (1,466 contracts), Brazilian real (1,237 contracts), Euro (1,161 contracts), Mexican peso (862 contracts) and Bitcoin (385 contracts) also showing positive weeks.
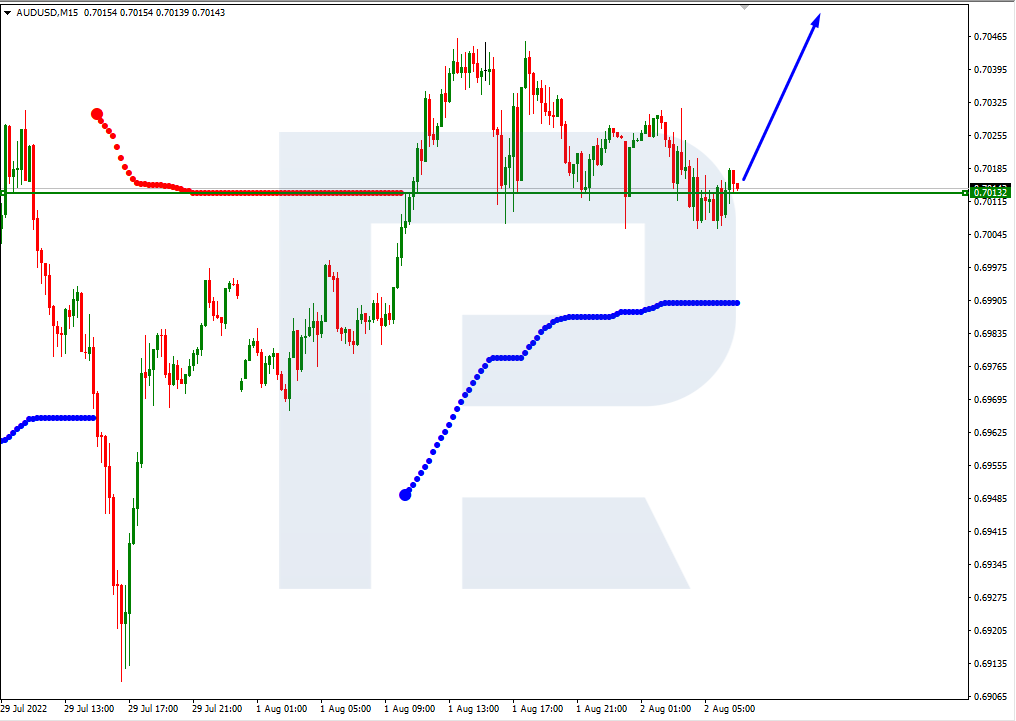
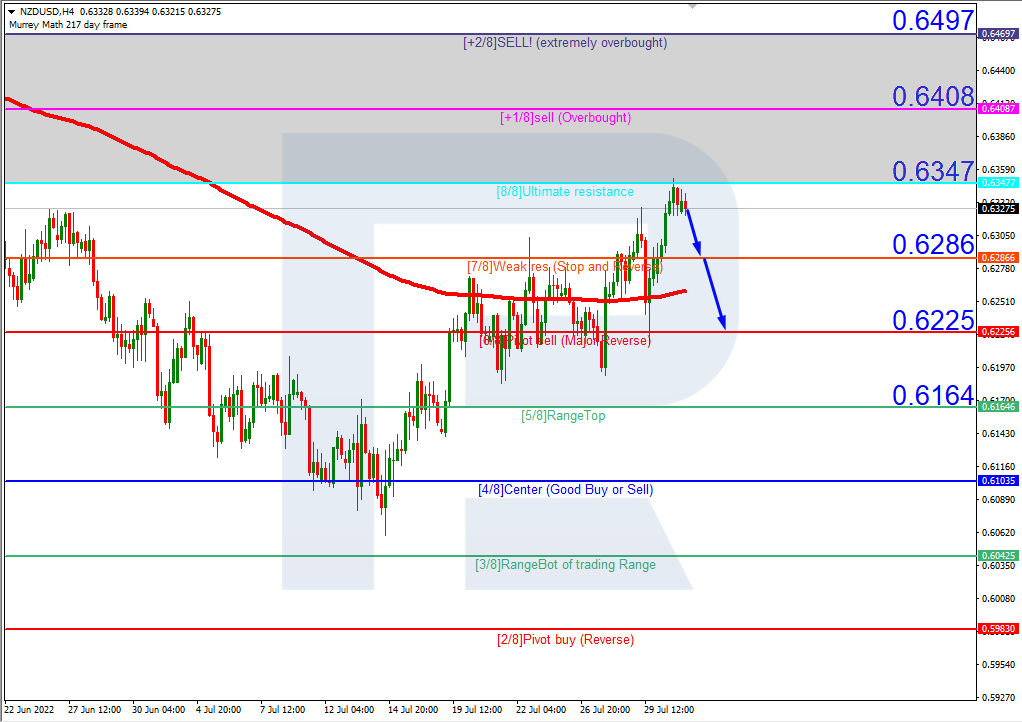
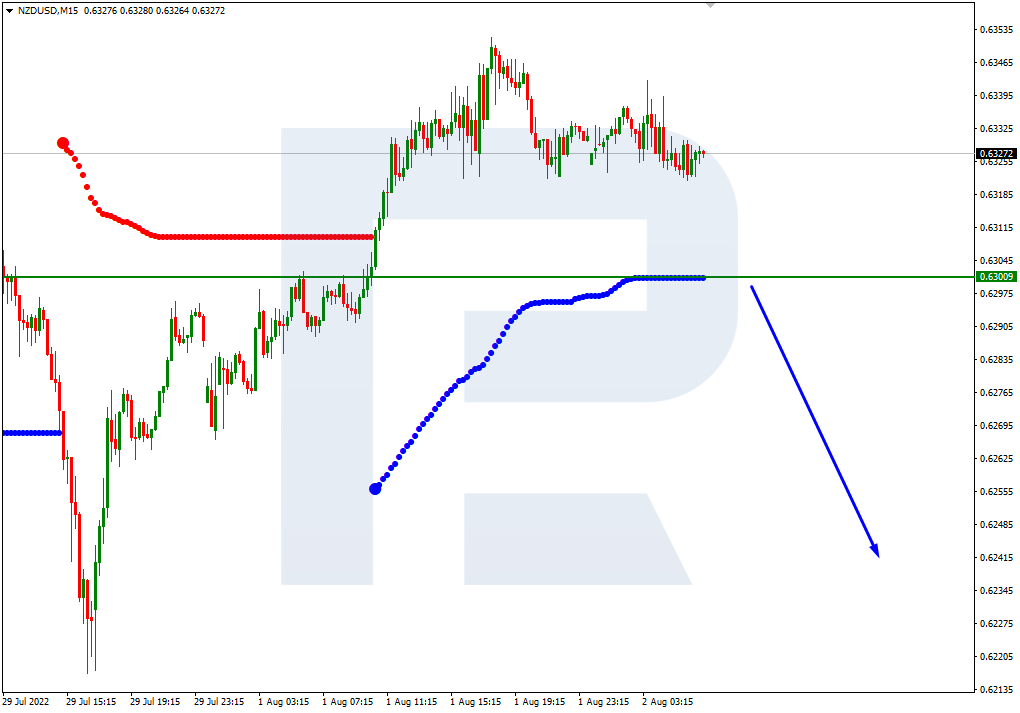
The currencies leading the declines in speculator bets this week was the Australian dollar (-4,237 contracts) with the Japanese yen (-2,256 contracts), New Zealand dollar (-515 contracts) and the Swiss franc (-387 contracts) also registering lower bets on the week.
Currency Notes:
Highlighting the forex markets COT data this week was the continued strength of the US Dollar Index. The speculative position for the US Dollar Index gained again this week for a second straight week and after falling in the previous three weeks. These gains bring the overall net bullish position back over the +40,000 contract level for the first time since June 28th and for the fourth time in the past seven weeks. The Dollar Index positioning has been super-strong much like the Dollar Index price that has been trading near its highest levels in approximately twenty years. The Dollar Index speculator positions have now been above the +30,000 contract level for fifteen straight weeks and has been in a bullish standing for fifty-six weeks and counting.
Canadian dollar positions gained this week for a second straight week and the net position hit a seven-week high. Canadian dollar speculator positions have, more or less, been fluctuating for almost a year and recently had a 5-week spell of bearish levels from May to June before becoming bullish again in late-June and July. The CAD speculator position has been in a small bullish level for the past seven weeks and is now at +15,769 contracts.
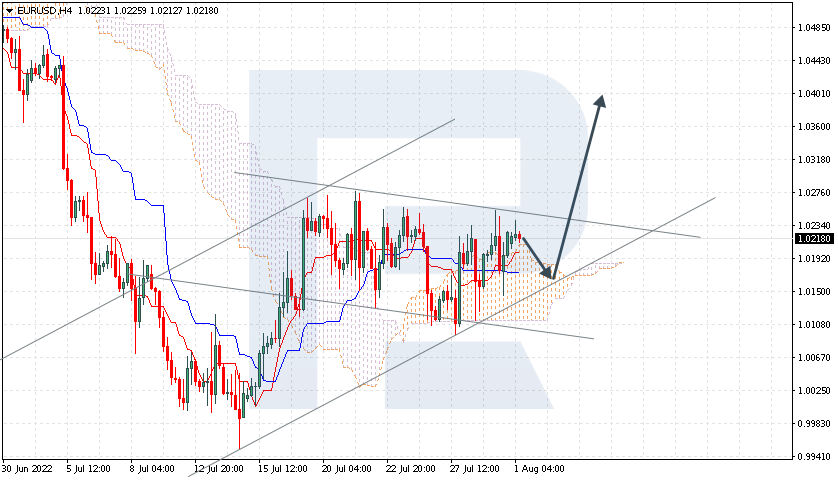
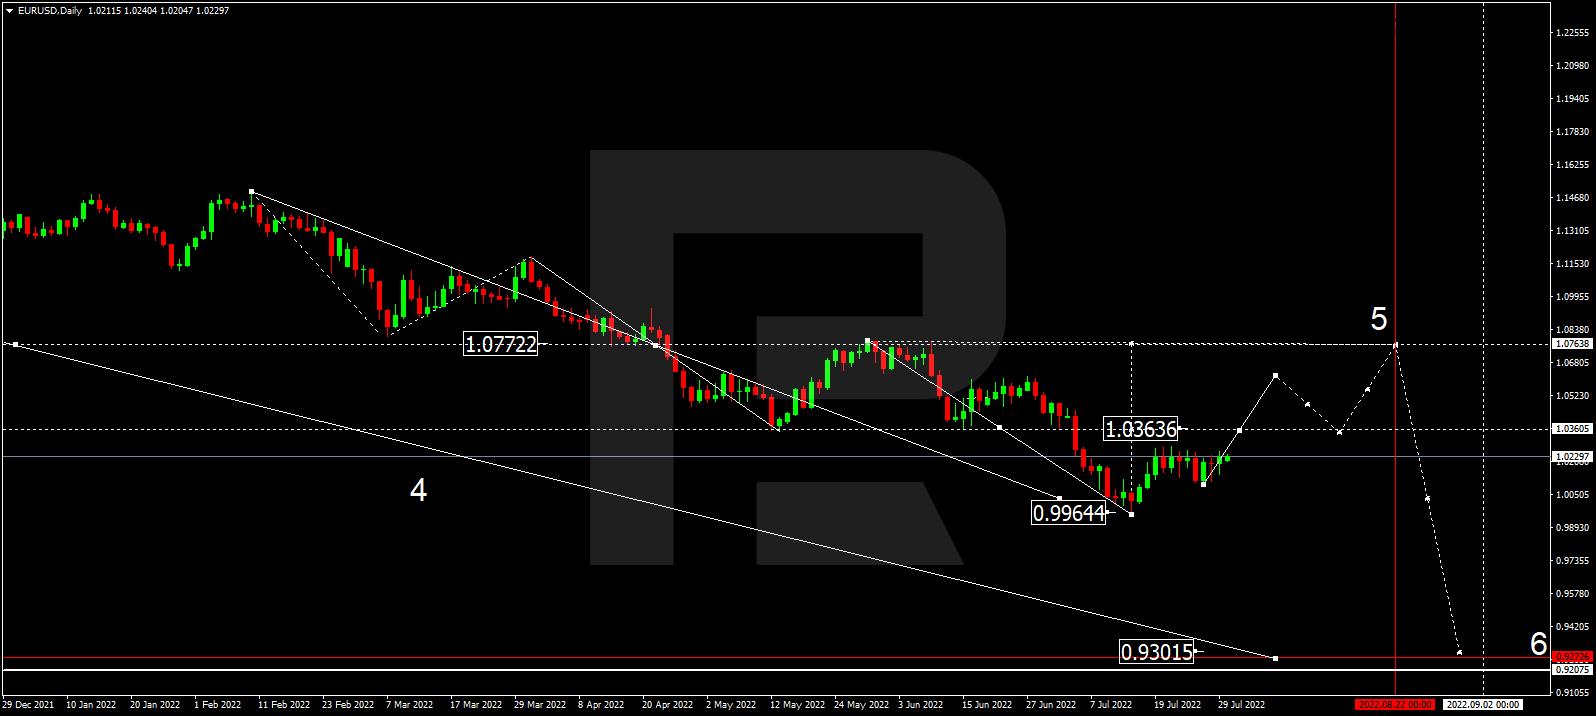
Euro bets rebounded a bit this week by just over +1,100 contracts and halted a three-week streak of declines. The Euro speculator position has been sharply down-trending over the past eight weeks and has fallen by a total of -93,856 contracts since June 7th. This drop in Euro bets reversed a +52,272 net contract level from May 31st to a total of -41,584 net contract level this week. The Euro exchange rate against the US Dollar (EURUSD) remains very close to parity at just over 1.200 currently after edging out a couple of weekly gains in forex market trading.
| Jul-26-2022 | OI | OI-Index | Spec-Net | Spec-Index | Com-Net | COM-Index | Smalls-Net | Smalls-Index |
|---|
| USD Index | 60,456 | 90 | 40,535 | 93 | -43,313 | 7 | 2,778 | 47 |
| EUR | 694,099 | 80 | -41,584 | 22 | 18,656 | 81 | 22,928 | 12 |
| GBP | 225,889 | 55 | -53,990 | 35 | 70,959 | 72 | -16,969 | 20 |
| JPY | 229,219 | 75 | -61,481 | 31 | 73,773 | 72 | -12,292 | 28 |
| CHF | 44,081 | 29 | -11,299 | 28 | 20,610 | 76 | -9,311 | 26 |
| CAD | 144,182 | 26 | 15,769 | 57 | -22,197 | 50 | 6,428 | 43 |
| AUD | 156,473 | 50 | -47,385 | 41 | 50,601 | 57 | -3,216 | 45 |
| NZD | 46,471 | 37 | -4,186 | 64 | 7,608 | 42 | -3,422 | 12 |
| MXN | 195,025 | 47 | -29,898 | 15 | 26,859 | 84 | 3,039 | 56 |
| RUB | 20,930 | 4 | 7,543 | 31 | -7,150 | 69 | -393 | 24 |
| BRL | 41,645 | 29 | 11,712 | 62 | -12,610 | 39 | 898 | 75 |
| Bitcoin | 14,957 | 87 | -121 | 78 | -118 | 0 | 239 | 18 |
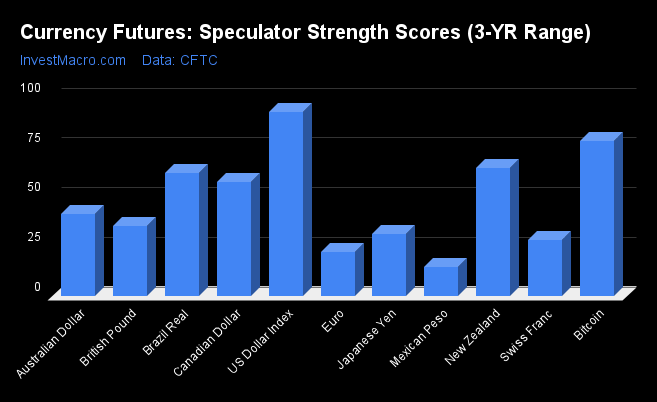
Strength Scores
Strength Scores (a normalized measure of Speculator positions over a 3-Year range, from 0 to 100 where above 80 is extreme bullish and below 20 is extreme bearish) showed that the US Dollar Index (92.5 percent) continues to lead the strength scores and rose a bit this week as speculator net position increased. The Dollar Index is in a bullish extreme level at over 90 percent compared to its three-year range. Bitcoin (78.1 percent) comes in as the next highest in the currency markets in strength scores followed by the New Zealand Dollar (64.2 percent) and then the Brazil Real (61.9 percent). On the downside, the Mexican Peso (14.6 percent) comes in at the lowest strength level currently and is in a bearish extreme level (below 20 percent). The EuroFX (22.2 percent), Swiss Franc (27.9 percent) and the Japanese Yen (31.0 percent) round out the next lowest scores this week.
Strength Statistics:
US Dollar Index (92.5 percent) vs US Dollar Index previous week (90.1 percent)
EuroFX (22.2 percent) vs EuroFX previous week (21.9 percent)
British Pound Sterling (35.1 percent) vs British Pound Sterling previous week (32.8 percent)
Japanese Yen (31.0 percent) vs Japanese Yen previous week (32.4 percent)
Swiss Franc (27.9 percent) vs Swiss Franc previous week (28.8 percent)
Canadian Dollar (57.1 percent) vs Canadian Dollar previous week (46.8 percent)
Australian Dollar (40.9 percent) vs Australian Dollar previous week (44.8 percent)
New Zealand Dollar (64.2 percent) vs New Zealand Dollar previous week (65.1 percent)
Mexican Peso (14.6 percent) vs Mexican Peso previous week (14.2 percent)
Brazil Real (61.9 percent) vs Brazil Real previous week (60.7 percent)
Bitcoin (78.1 percent) vs Bitcoin previous week (71.1 percent)
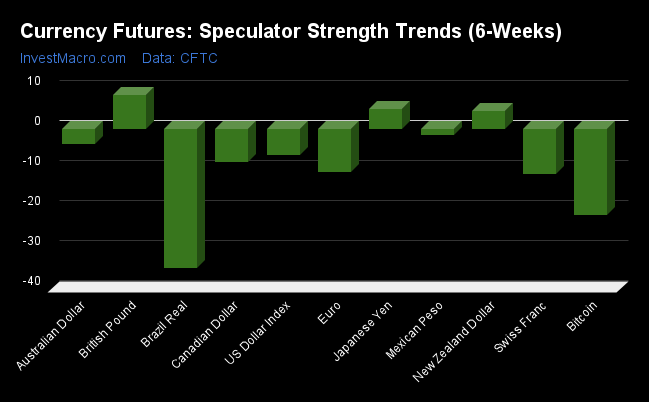
Strength Trends
Strength Score Trends (or move index, calculates the 6-week changes in strength scores) showed that the British Pound Sterling (8.4 percent) leads the past six weeks trends for the currency markets this week. The Japanese Yen (5.1 percent) and the New Zealand Dollar (4.4 percent) fill out the only other positive movers in the latest trends data. The Brazilian Real (-34.9 percent) leads the downside trend scores currently while the next markets with lower trend scores were Bitcoin (-21.5 percent) followed by the Swiss Franc (-11.4 percent) and the EuroFX (-10.9 percent).
Strength Trend Statistics:
US Dollar Index (-6.6 percent) vs US Dollar Index previous week (1.9 percent)
EuroFX (-10.9 percent) vs EuroFX previous week (-28.6 percent)
British Pound Sterling (8.4 percent) vs British Pound Sterling previous week (9.8 percent)
Japanese Yen (5.1 percent) vs Japanese Yen previous week (20.0 percent)
Swiss Franc (-11.4 percent) vs Swiss Franc previous week (13.2 percent)
Canadian Dollar (-8.3 percent) vs Canadian Dollar previous week (8.7 percent)
Australian Dollar (-3.8 percent) vs Australian Dollar previous week (4.4 percent)
New Zealand Dollar (4.4 percent) vs New Zealand Dollar previous week (27.0 percent)
Mexican Peso (-1.5 percent) vs Mexican Peso previous week (-27.1 percent)
Brazil Real (-34.9 percent) vs Brazil Real previous week (-35.6 percent)
Bitcoin (-21.5 percent) vs Bitcoin previous week (-18.1 percent)
Individual Markets:
US Dollar Index Futures:
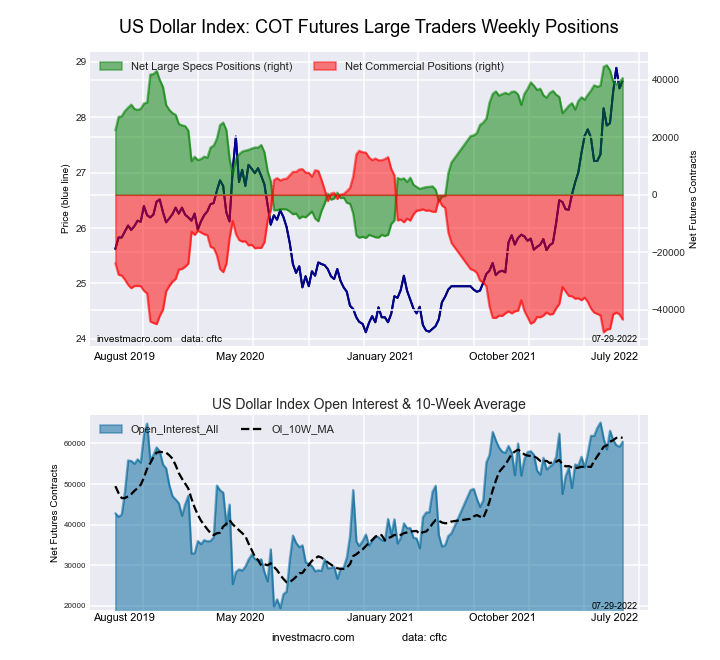 The US Dollar Index large speculator standing this week reached a net position of 40,535 contracts in the data reported through Tuesday. This was a weekly advance of 1,466 contracts from the previous week which had a total of 39,069 net contracts.
This week’s current strength score (the trader positioning range over the past three years, measured from 0 to 100) shows the speculators are currently Bullish-Extreme with a score of 92.5 percent. The commercials are Bearish-Extreme with a score of 7.0 percent and the small traders (not shown in chart) are Bearish with a score of 46.9 percent.
| US DOLLAR INDEX Statistics | SPECULATORS | COMMERCIALS | SMALL TRADERS |
| – Percent of Open Interest Longs: | 84.9 | 4.1 | 8.6 |
| – Percent of Open Interest Shorts: | 17.9 | 75.8 | 4.1 |
| – Net Position: | 40,535 | -43,313 | 2,778 |
| – Gross Longs: | 51,337 | 2,492 | 5,227 |
| – Gross Shorts: | 10,802 | 45,805 | 2,449 |
| – Long to Short Ratio: | 4.8 to 1 | 0.1 to 1 | 2.1 to 1 |
| NET POSITION TREND: | | | |
| – Strength Index Score (3 Year Range Pct): | 92.5 | 7.0 | 46.9 |
| – Strength Index Reading (3 Year Range): | Bullish-Extreme | Bearish-Extreme | Bearish |
| NET POSITION MOVEMENT INDEX: | | | |
| – 6-Week Change in Strength Index: | -6.6 | 7.0 | -5.3 |
Euro Currency Futures:
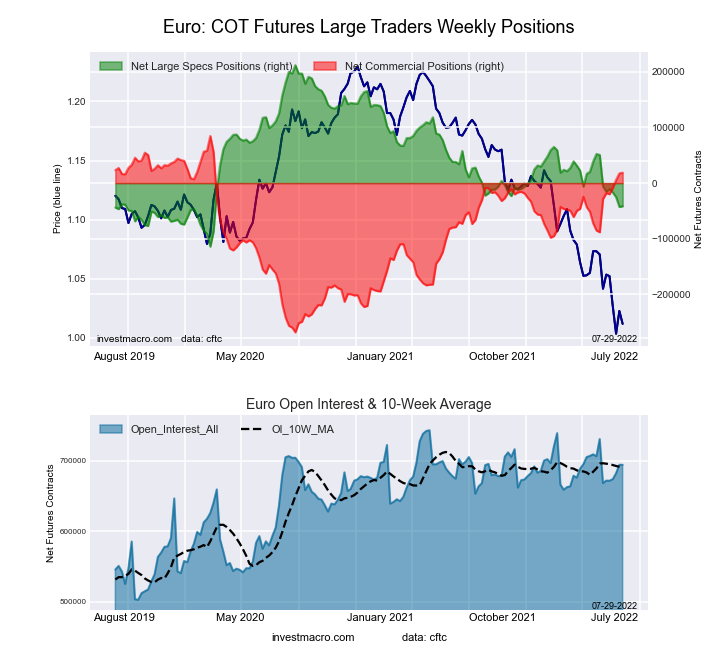 The Euro Currency large speculator standing this week reached a net position of -41,584 contracts in the data reported through Tuesday. This was a weekly boost of 1,161 contracts from the previous week which had a total of -42,745 net contracts.
This week’s current strength score (the trader positioning range over the past three years, measured from 0 to 100) shows the speculators are currently Bearish with a score of 22.2 percent. The commercials are Bullish-Extreme with a score of 81.3 percent and the small traders (not shown in chart) are Bearish-Extreme with a score of 12.4 percent.
| EURO Currency Statistics | SPECULATORS | COMMERCIALS | SMALL TRADERS |
| – Percent of Open Interest Longs: | 28.5 | 56.6 | 12.0 |
| – Percent of Open Interest Shorts: | 34.5 | 53.9 | 8.7 |
| – Net Position: | -41,584 | 18,656 | 22,928 |
| – Gross Longs: | 198,041 | 393,062 | 83,007 |
| – Gross Shorts: | 239,625 | 374,406 | 60,079 |
| – Long to Short Ratio: | 0.8 to 1 | 1.0 to 1 | 1.4 to 1 |
| NET POSITION TREND: | | | |
| – Strength Index Score (3 Year Range Pct): | 22.2 | 81.3 | 12.4 |
| – Strength Index Reading (3 Year Range): | Bearish | Bullish-Extreme | Bearish-Extreme |
| NET POSITION MOVEMENT INDEX: | | | |
| – 6-Week Change in Strength Index: | -10.9 | 13.4 | -19.2 |
British Pound Sterling Futures:
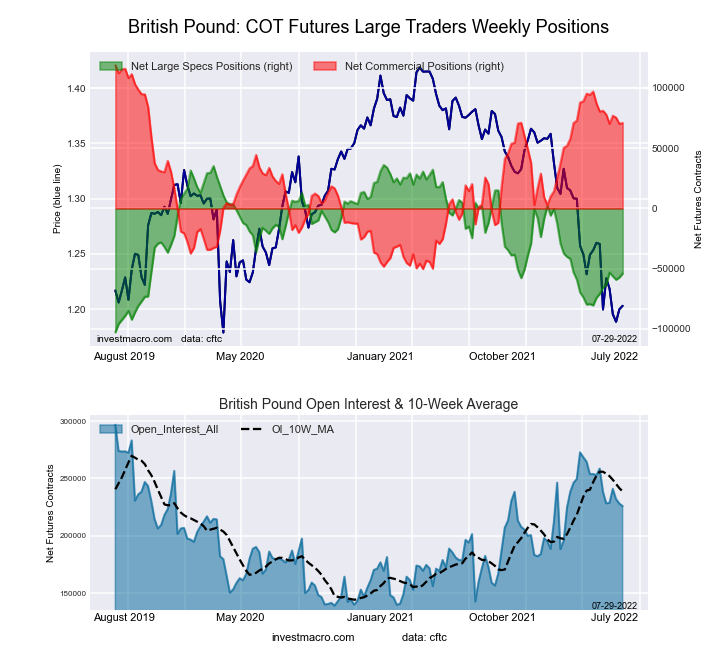 The British Pound Sterling large speculator standing this week reached a net position of -53,990 contracts in the data reported through Tuesday. This was a weekly gain of 3,260 contracts from the previous week which had a total of -57,250 net contracts.
This week’s current strength score (the trader positioning range over the past three years, measured from 0 to 100) shows the speculators are currently Bearish with a score of 35.1 percent. The commercials are Bullish with a score of 71.6 percent and the small traders (not shown in chart) are Bearish with a score of 20.5 percent.
| BRITISH POUND Statistics | SPECULATORS | COMMERCIALS | SMALL TRADERS |
| – Percent of Open Interest Longs: | 15.3 | 74.5 | 7.8 |
| – Percent of Open Interest Shorts: | 39.2 | 43.1 | 15.3 |
| – Net Position: | -53,990 | 70,959 | -16,969 |
| – Gross Longs: | 34,606 | 168,266 | 17,551 |
| – Gross Shorts: | 88,596 | 97,307 | 34,520 |
| – Long to Short Ratio: | 0.4 to 1 | 1.7 to 1 | 0.5 to 1 |
| NET POSITION TREND: | | | |
| – Strength Index Score (3 Year Range Pct): | 35.1 | 71.6 | 20.5 |
| – Strength Index Reading (3 Year Range): | Bearish | Bullish | Bearish |
| NET POSITION MOVEMENT INDEX: | | | |
| – 6-Week Change in Strength Index: | 8.4 | -6.0 | -3.1 |
Japanese Yen Futures:
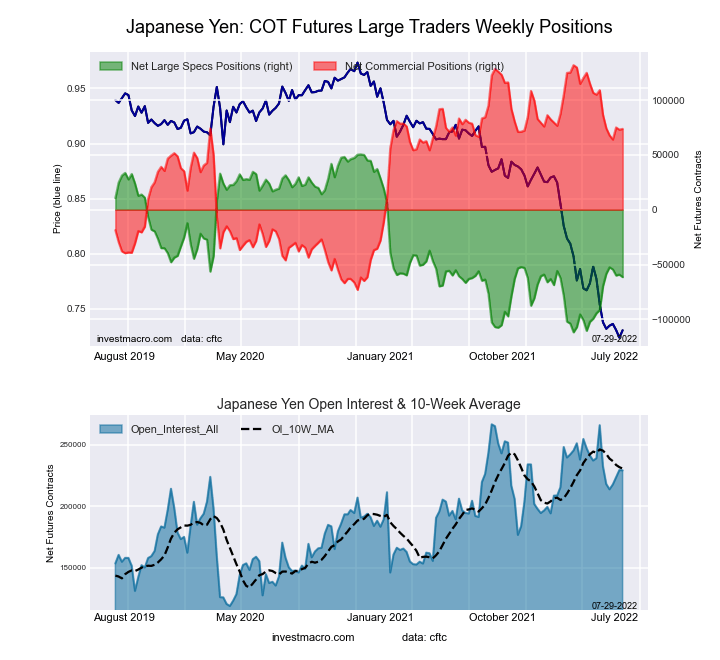 The Japanese Yen large speculator standing this week reached a net position of -61,481 contracts in the data reported through Tuesday. This was a weekly lowering of -2,256 contracts from the previous week which had a total of -59,225 net contracts.
This week’s current strength score (the trader positioning range over the past three years, measured from 0 to 100) shows the speculators are currently Bearish with a score of 31.0 percent. The commercials are Bullish with a score of 71.6 percent and the small traders (not shown in chart) are Bearish with a score of 28.5 percent.
| JAPANESE YEN Statistics | SPECULATORS | COMMERCIALS | SMALL TRADERS |
| – Percent of Open Interest Longs: | 19.1 | 68.9 | 10.3 |
| – Percent of Open Interest Shorts: | 45.9 | 36.7 | 15.7 |
| – Net Position: | -61,481 | 73,773 | -12,292 |
| – Gross Longs: | 43,812 | 157,963 | 23,671 |
| – Gross Shorts: | 105,293 | 84,190 | 35,963 |
| – Long to Short Ratio: | 0.4 to 1 | 1.9 to 1 | 0.7 to 1 |
| NET POSITION TREND: | | | |
| – Strength Index Score (3 Year Range Pct): | 31.0 | 71.6 | 28.5 |
| – Strength Index Reading (3 Year Range): | Bearish | Bullish | Bearish |
| NET POSITION MOVEMENT INDEX: | | | |
| – 6-Week Change in Strength Index: | 5.1 | -6.2 | 8.9 |
Swiss Franc Futures:
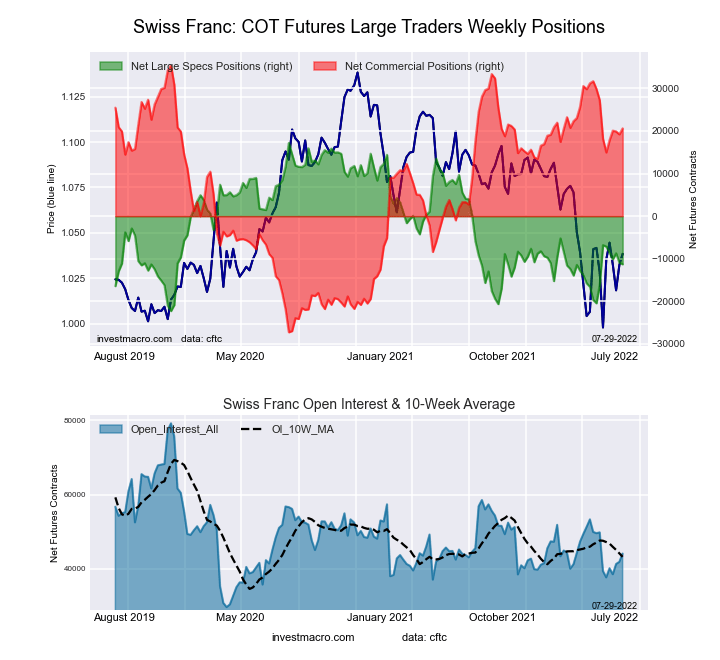 The Swiss Franc large speculator standing this week reached a net position of -11,299 contracts in the data reported through Tuesday. This was a weekly decline of -387 contracts from the previous week which had a total of -10,912 net contracts.
This week’s current strength score (the trader positioning range over the past three years, measured from 0 to 100) shows the speculators are currently Bearish with a score of 27.9 percent. The commercials are Bullish with a score of 76.3 percent and the small traders (not shown in chart) are Bearish with a score of 26.0 percent.
| SWISS FRANC Statistics | SPECULATORS | COMMERCIALS | SMALL TRADERS |
| – Percent of Open Interest Longs: | 18.5 | 61.7 | 19.6 |
| – Percent of Open Interest Shorts: | 44.1 | 14.9 | 40.8 |
| – Net Position: | -11,299 | 20,610 | -9,311 |
| – Gross Longs: | 8,138 | 27,195 | 8,653 |
| – Gross Shorts: | 19,437 | 6,585 | 17,964 |
| – Long to Short Ratio: | 0.4 to 1 | 4.1 to 1 | 0.5 to 1 |
| NET POSITION TREND: | | | |
| – Strength Index Score (3 Year Range Pct): | 27.9 | 76.3 | 26.0 |
| – Strength Index Reading (3 Year Range): | Bearish | Bullish | Bearish |
| NET POSITION MOVEMENT INDEX: | | | |
| – 6-Week Change in Strength Index: | -11.4 | 3.9 | 6.9 |
Canadian Dollar Futures:
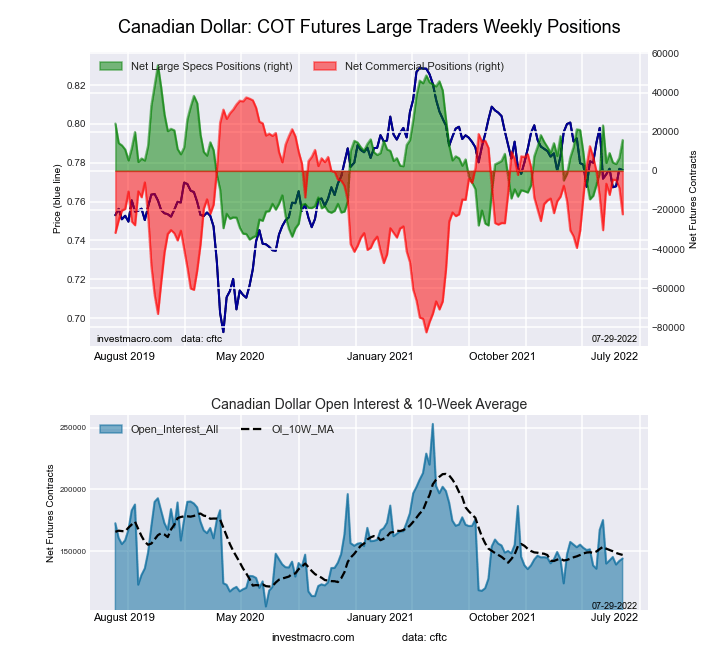 The Canadian Dollar large speculator standing this week reached a net position of 15,769 contracts in the data reported through Tuesday. This was a weekly lift of 9,102 contracts from the previous week which had a total of 6,667 net contracts.
This week’s current strength score (the trader positioning range over the past three years, measured from 0 to 100) shows the speculators are currently Bullish with a score of 57.1 percent. The commercials are Bullish with a score of 50.2 percent and the small traders (not shown in chart) are Bearish with a score of 43.0 percent.
| CANADIAN DOLLAR Statistics | SPECULATORS | COMMERCIALS | SMALL TRADERS |
| – Percent of Open Interest Longs: | 32.2 | 42.9 | 23.4 |
| – Percent of Open Interest Shorts: | 21.3 | 58.3 | 19.0 |
| – Net Position: | 15,769 | -22,197 | 6,428 |
| – Gross Longs: | 46,414 | 61,869 | 33,790 |
| – Gross Shorts: | 30,645 | 84,066 | 27,362 |
| – Long to Short Ratio: | 1.5 to 1 | 0.7 to 1 | 1.2 to 1 |
| NET POSITION TREND: | | | |
| – Strength Index Score (3 Year Range Pct): | 57.1 | 50.2 | 43.0 |
| – Strength Index Reading (3 Year Range): | Bullish | Bullish | Bearish |
| NET POSITION MOVEMENT INDEX: | | | |
| – 6-Week Change in Strength Index: | -8.3 | 6.7 | -1.3 |
Australian Dollar Futures:
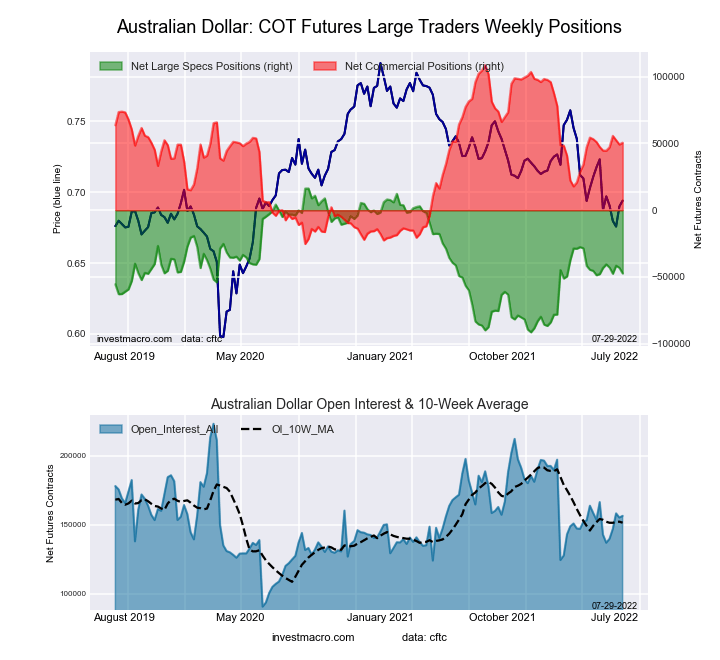 The Australian Dollar large speculator standing this week reached a net position of -47,385 contracts in the data reported through Tuesday. This was a weekly decrease of -4,237 contracts from the previous week which had a total of -43,148 net contracts.
This week’s current strength score (the trader positioning range over the past three years, measured from 0 to 100) shows the speculators are currently Bearish with a score of 40.9 percent. The commercials are Bullish with a score of 56.6 percent and the small traders (not shown in chart) are Bearish with a score of 44.6 percent.
| AUSTRALIAN DOLLAR Statistics | SPECULATORS | COMMERCIALS | SMALL TRADERS |
| – Percent of Open Interest Longs: | 19.2 | 65.4 | 12.4 |
| – Percent of Open Interest Shorts: | 49.5 | 33.1 | 14.4 |
| – Net Position: | -47,385 | 50,601 | -3,216 |
| – Gross Longs: | 30,024 | 102,398 | 19,361 |
| – Gross Shorts: | 77,409 | 51,797 | 22,577 |
| – Long to Short Ratio: | 0.4 to 1 | 2.0 to 1 | 0.9 to 1 |
| NET POSITION TREND: | | | |
| – Strength Index Score (3 Year Range Pct): | 40.9 | 56.6 | 44.6 |
| – Strength Index Reading (3 Year Range): | Bearish | Bullish | Bearish |
| NET POSITION MOVEMENT INDEX: | | | |
| – 6-Week Change in Strength Index: | -3.8 | 4.4 | -4.3 |
New Zealand Dollar Futures:
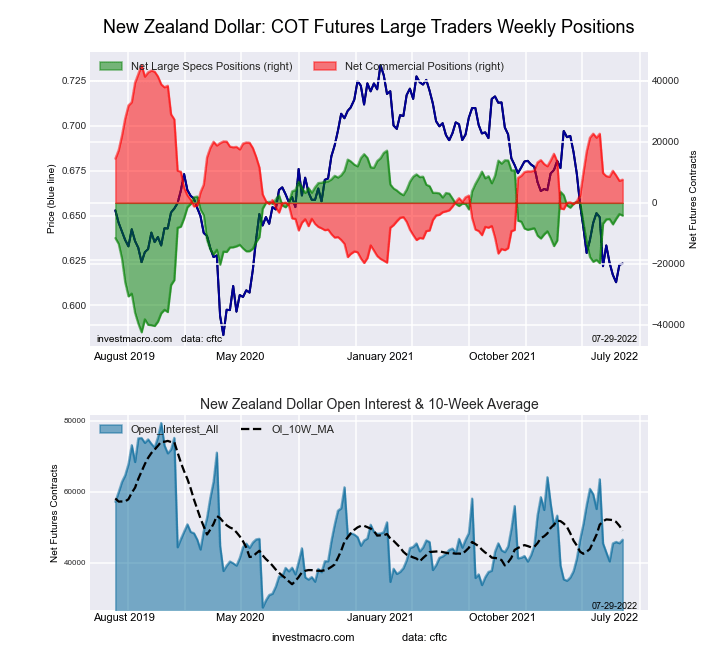 The New Zealand Dollar large speculator standing this week reached a net position of -4,186 contracts in the data reported through Tuesday. This was a weekly decrease of -515 contracts from the previous week which had a total of -3,671 net contracts.
This week’s current strength score (the trader positioning range over the past three years, measured from 0 to 100) shows the speculators are currently Bullish with a score of 64.2 percent. The commercials are Bearish with a score of 42.1 percent and the small traders (not shown in chart) are Bearish-Extreme with a score of 12.3 percent.
| NEW ZEALAND DOLLAR Statistics | SPECULATORS | COMMERCIALS | SMALL TRADERS |
| – Percent of Open Interest Longs: | 37.3 | 57.0 | 4.8 |
| – Percent of Open Interest Shorts: | 46.3 | 40.6 | 12.2 |
| – Net Position: | -4,186 | 7,608 | -3,422 |
| – Gross Longs: | 17,311 | 26,498 | 2,249 |
| – Gross Shorts: | 21,497 | 18,890 | 5,671 |
| – Long to Short Ratio: | 0.8 to 1 | 1.4 to 1 | 0.4 to 1 |
| NET POSITION TREND: | | | |
| – Strength Index Score (3 Year Range Pct): | 64.2 | 42.1 | 12.3 |
| – Strength Index Reading (3 Year Range): | Bullish | Bearish | Bearish-Extreme |
| NET POSITION MOVEMENT INDEX: | | | |
| – 6-Week Change in Strength Index: | 4.4 | -3.3 | -5.6 |
Mexican Peso Futures:
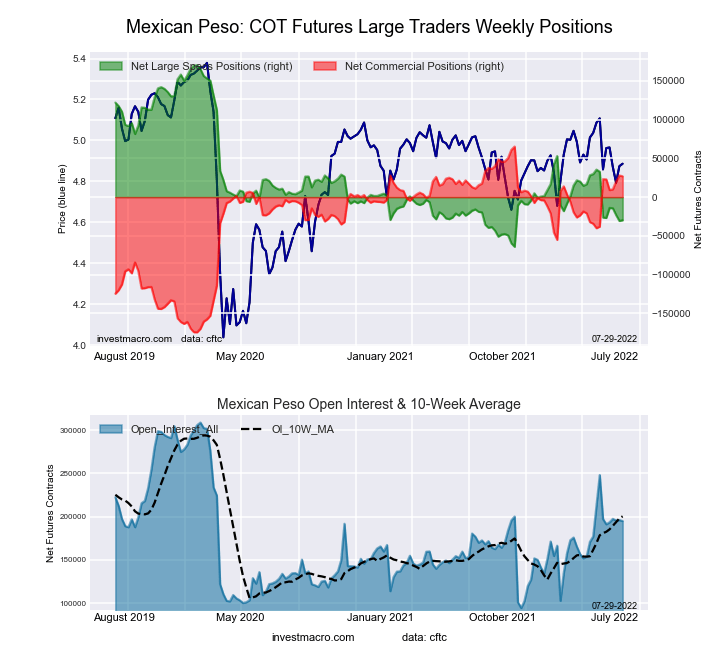 The Mexican Peso large speculator standing this week reached a net position of -29,898 contracts in the data reported through Tuesday. This was a weekly advance of 862 contracts from the previous week which had a total of -30,760 net contracts.
This week’s current strength score (the trader positioning range over the past three years, measured from 0 to 100) shows the speculators are currently Bearish-Extreme with a score of 14.6 percent. The commercials are Bullish-Extreme with a score of 84.0 percent and the small traders (not shown in chart) are Bullish with a score of 55.9 percent.
| MEXICAN PESO Statistics | SPECULATORS | COMMERCIALS | SMALL TRADERS |
| – Percent of Open Interest Longs: | 49.6 | 46.6 | 3.0 |
| – Percent of Open Interest Shorts: | 64.9 | 32.9 | 1.4 |
| – Net Position: | -29,898 | 26,859 | 3,039 |
| – Gross Longs: | 96,752 | 90,972 | 5,815 |
| – Gross Shorts: | 126,650 | 64,113 | 2,776 |
| – Long to Short Ratio: | 0.8 to 1 | 1.4 to 1 | 2.1 to 1 |
| NET POSITION TREND: | | | |
| – Strength Index Score (3 Year Range Pct): | 14.6 | 84.0 | 55.9 |
| – Strength Index Reading (3 Year Range): | Bearish-Extreme | Bullish-Extreme | Bullish |
| NET POSITION MOVEMENT INDEX: | | | |
| – 6-Week Change in Strength Index: | -1.5 | 1.5 | -0.8 |
Brazilian Real Futures:
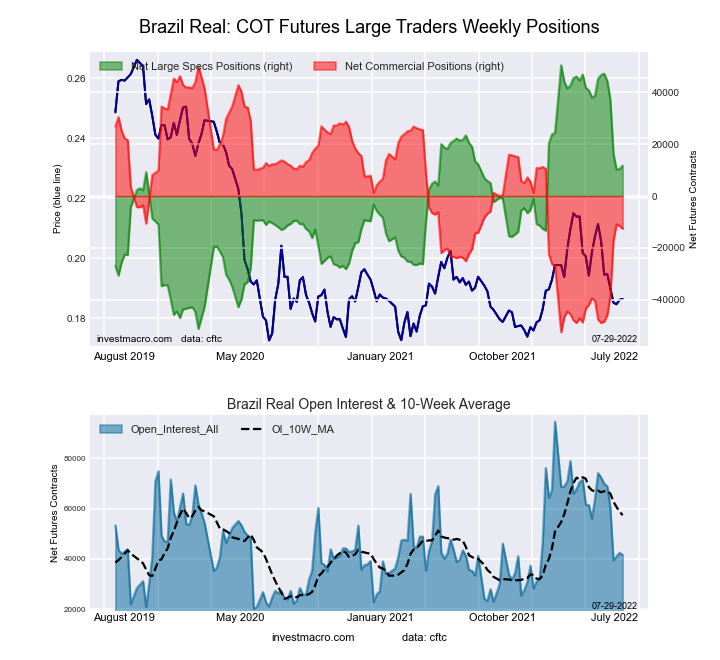 The Brazilian Real large speculator standing this week reached a net position of 11,712 contracts in the data reported through Tuesday. This was a weekly advance of 1,237 contracts from the previous week which had a total of 10,475 net contracts.
This week’s current strength score (the trader positioning range over the past three years, measured from 0 to 100) shows the speculators are currently Bullish with a score of 61.9 percent. The commercials are Bearish with a score of 39.0 percent and the small traders (not shown in chart) are Bullish with a score of 75.3 percent.
| BRAZIL REAL Statistics | SPECULATORS | COMMERCIALS | SMALL TRADERS |
| – Percent of Open Interest Longs: | 49.5 | 41.1 | 7.9 |
| – Percent of Open Interest Shorts: | 21.4 | 71.3 | 5.8 |
| – Net Position: | 11,712 | -12,610 | 898 |
| – Gross Longs: | 20,614 | 17,103 | 3,296 |
| – Gross Shorts: | 8,902 | 29,713 | 2,398 |
| – Long to Short Ratio: | 2.3 to 1 | 0.6 to 1 | 1.4 to 1 |
| NET POSITION TREND: | | | |
| – Strength Index Score (3 Year Range Pct): | 61.9 | 39.0 | 75.3 |
| – Strength Index Reading (3 Year Range): | Bullish | Bearish | Bullish |
| NET POSITION MOVEMENT INDEX: | | | |
| – 6-Week Change in Strength Index: | -34.9 | 35.0 | -4.1 |
Bitcoin Futures:
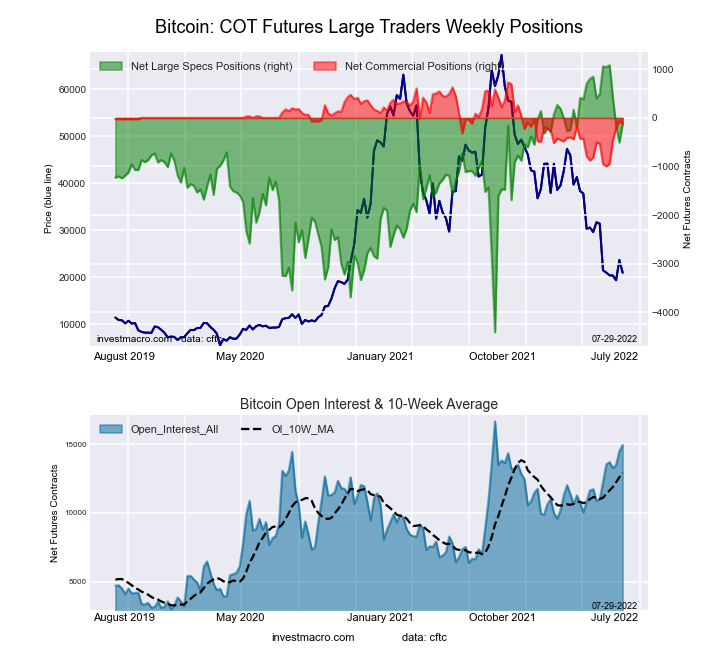 The Bitcoin large speculator standing this week reached a net position of -121 contracts in the data reported through Tuesday. This was a weekly lift of 385 contracts from the previous week which had a total of -506 net contracts.
This week’s current strength score (the trader positioning range over the past three years, measured from 0 to 100) shows the speculators are currently Bullish with a score of 78.1 percent. The commercials are Bullish with a score of 50.9 percent and the small traders (not shown in chart) are Bearish-Extreme with a score of 18.4 percent.
| BITCOIN Statistics | SPECULATORS | COMMERCIALS | SMALL TRADERS |
| – Percent of Open Interest Longs: | 65.4 | 3.0 | 7.8 |
| – Percent of Open Interest Shorts: | 66.2 | 3.8 | 6.2 |
| – Net Position: | -121 | -118 | 239 |
| – Gross Longs: | 9,778 | 449 | 1,160 |
| – Gross Shorts: | 9,899 | 567 | 921 |
| – Long to Short Ratio: | 1.0 to 1 | 0.8 to 1 | 1.3 to 1 |
| NET POSITION TREND: | | | |
| – Strength Index Score (3 Year Range Pct): | 78.1 | 50.9 | 18.4 |
| – Strength Index Reading (3 Year Range): | Bullish | Bullish | Bearish-Extreme |
| NET POSITION MOVEMENT INDEX: | | | |
| – 6-Week Change in Strength Index: | -21.5 | 48.1 | 8.0 |
Article By InvestMacro – Receive our weekly COT Reports by Email
*COT Report: The COT data, released weekly to the public each Friday, is updated through the most recent Tuesday (data is 3 days old) and shows a quick view of how large speculators or non-commercials (for-profit traders) were positioned in the futures markets.
The CFTC categorizes trader positions according to commercial hedgers (traders who use futures contracts for hedging as part of the business), non-commercials (large traders who speculate to realize trading profits) and nonreportable traders (usually small traders/speculators) as well as their open interest (contracts open in the market at time of reporting).See CFTC criteria here.


