Article By RoboForex.com
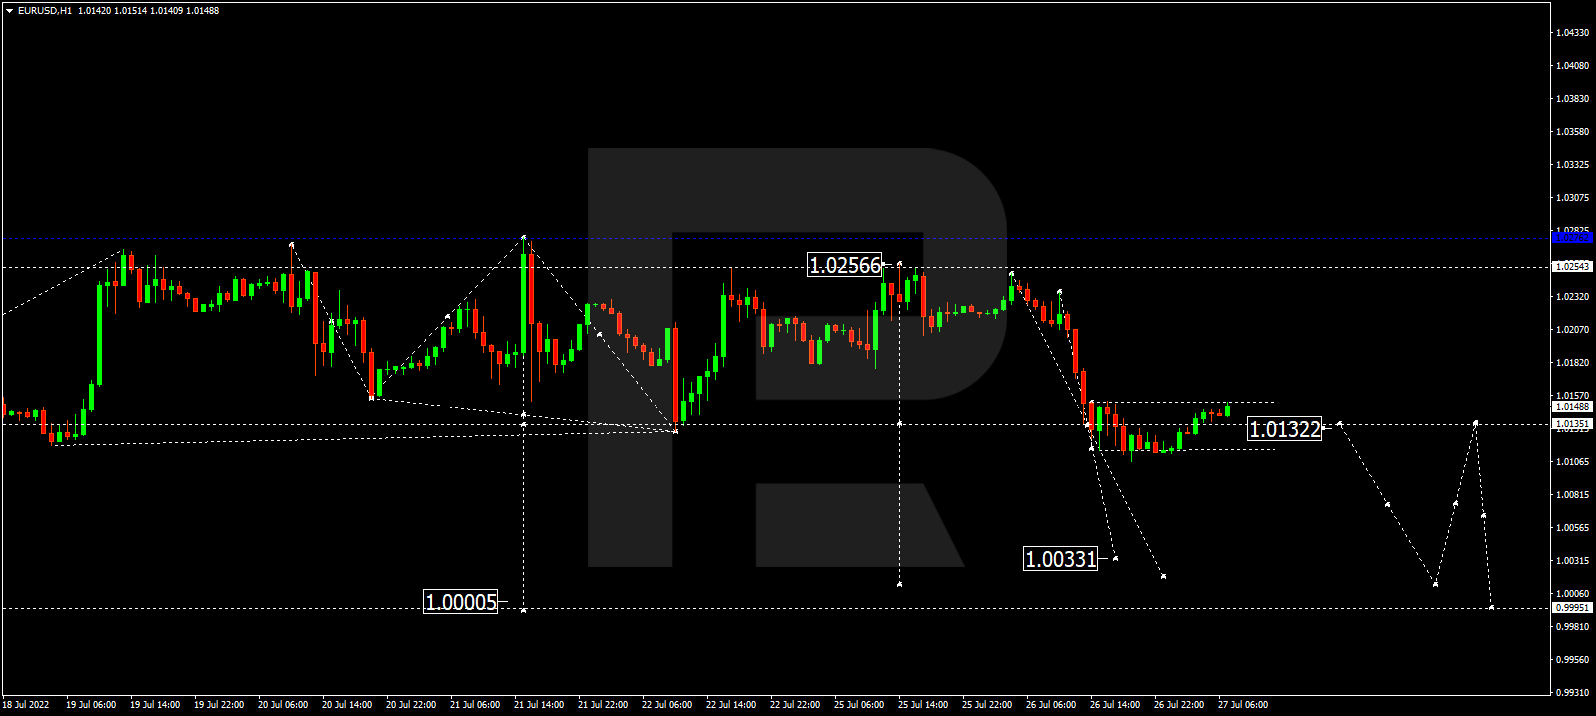
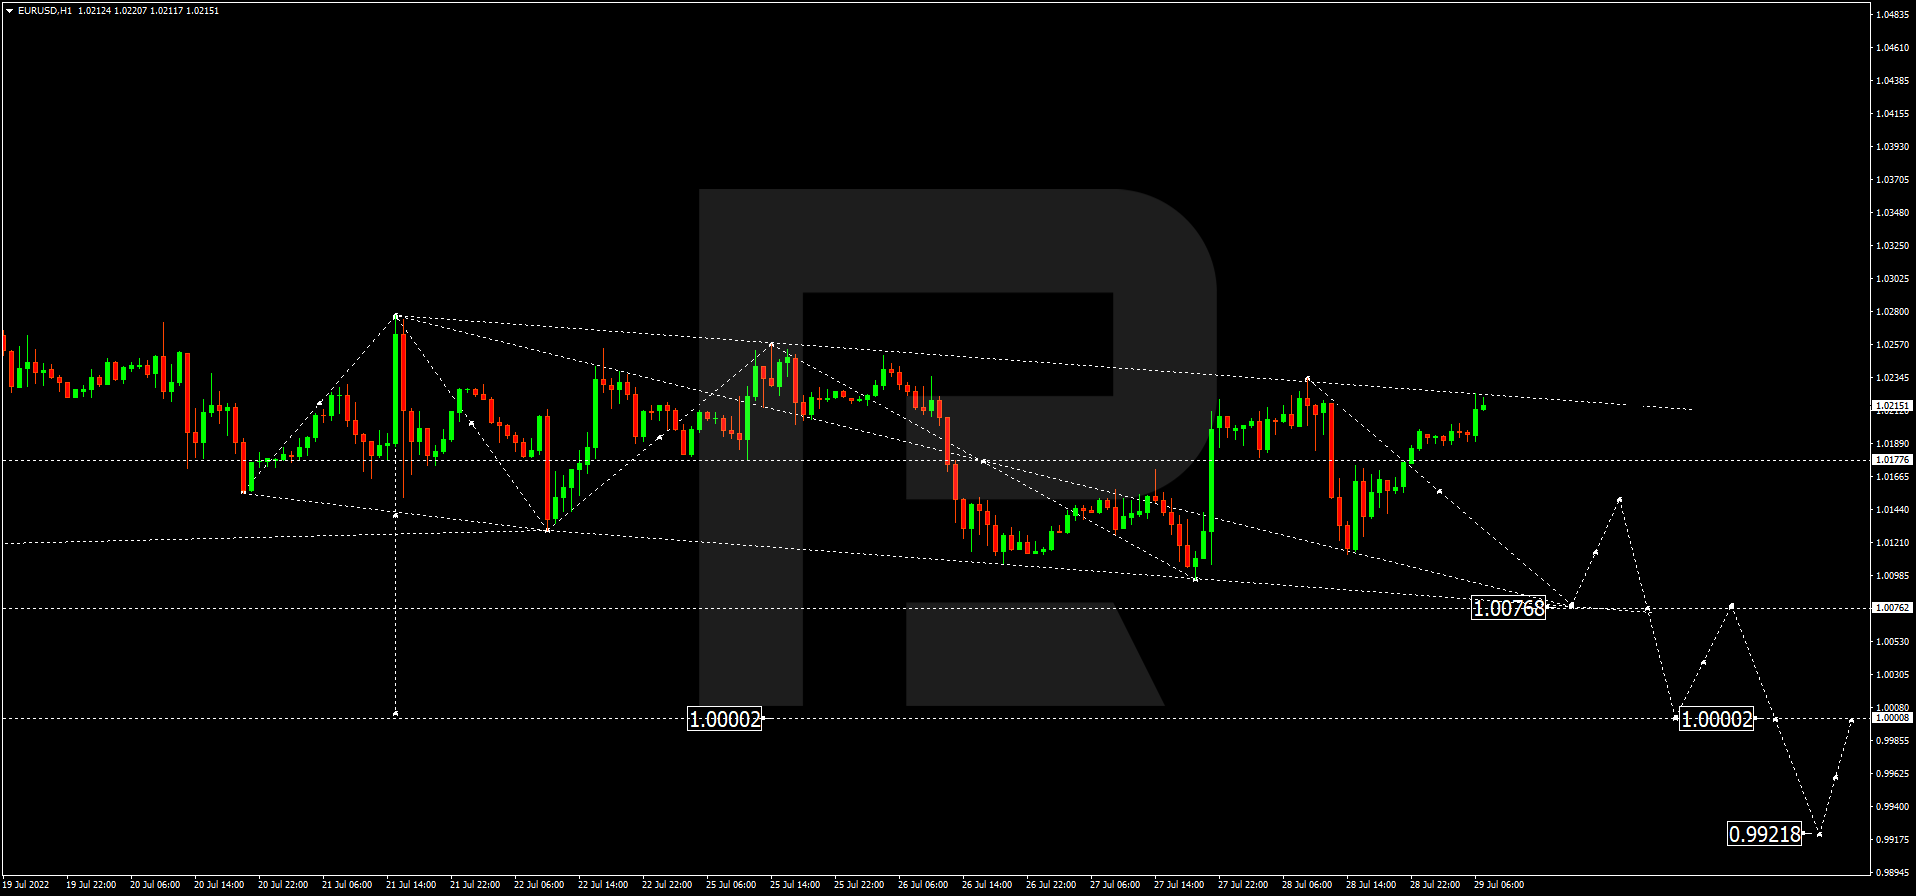
EURUSD, “Euro vs US Dollar”
Having completed the ascending wave at 1.0222, EURUSD is trading close to the bearish channel’s upside border. Possibly, today the pair may fall towards 1.0077 and then form a new consolidation range around 1.0177.

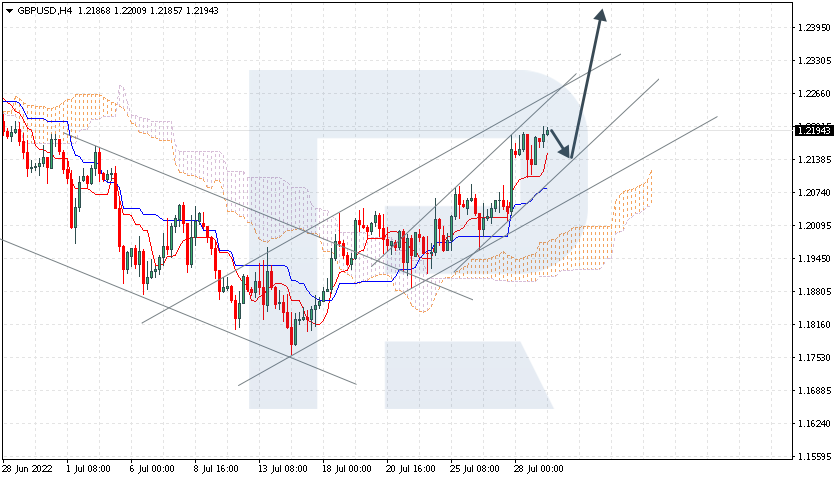
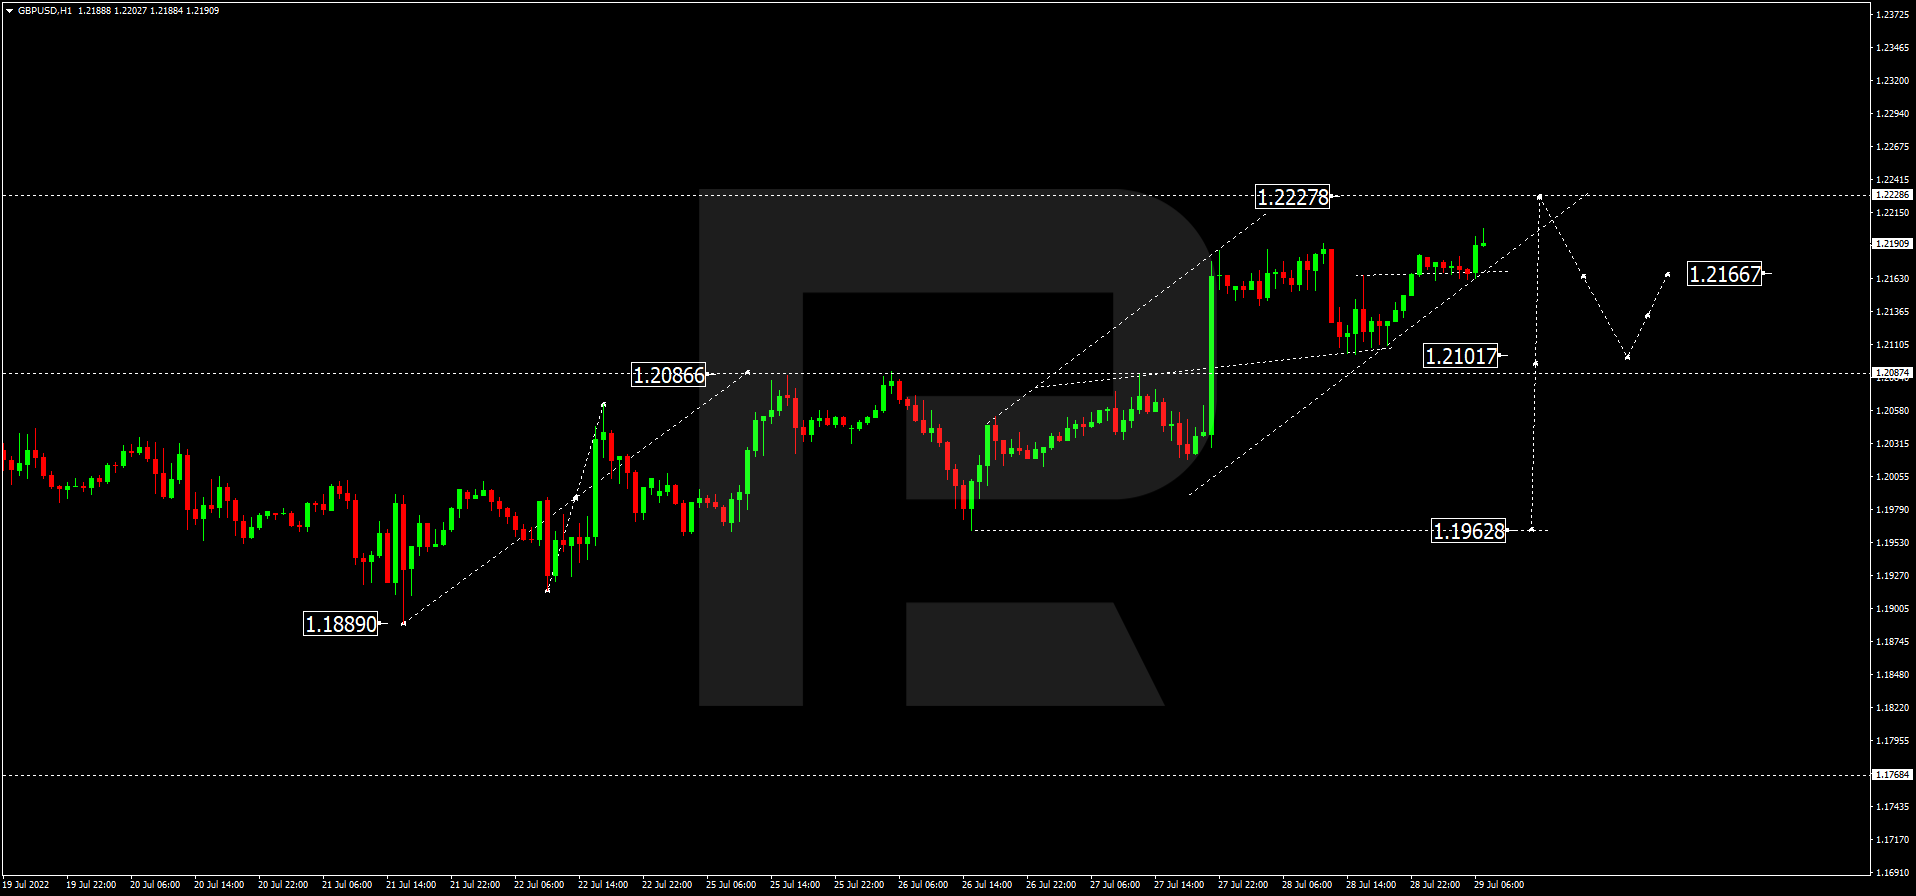
GBPUSD, “Great Britain Pound vs US Dollar”
GBPUSD continue growing towards 1.2227 and may later fall to break 1.2100 and then continue trading downwards with the target at 1.1963.
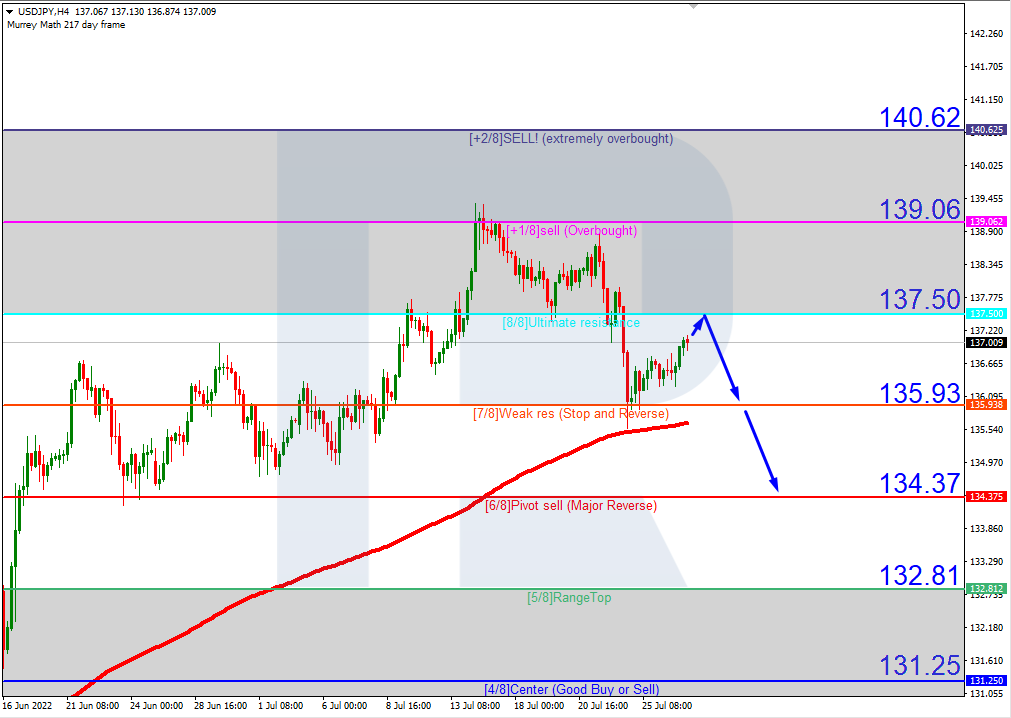
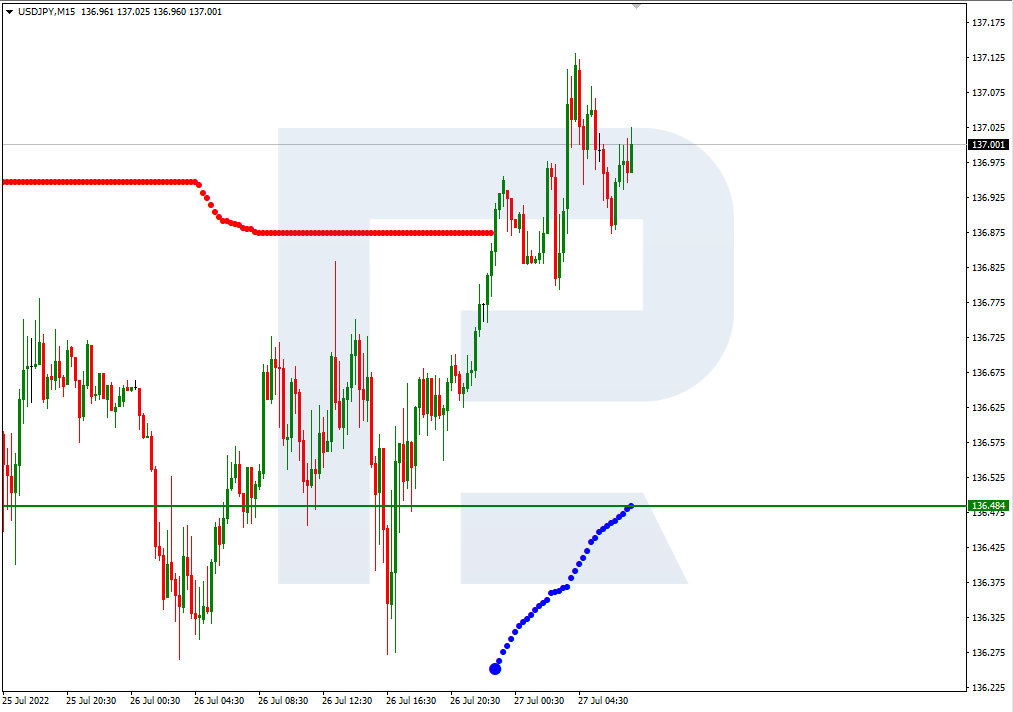
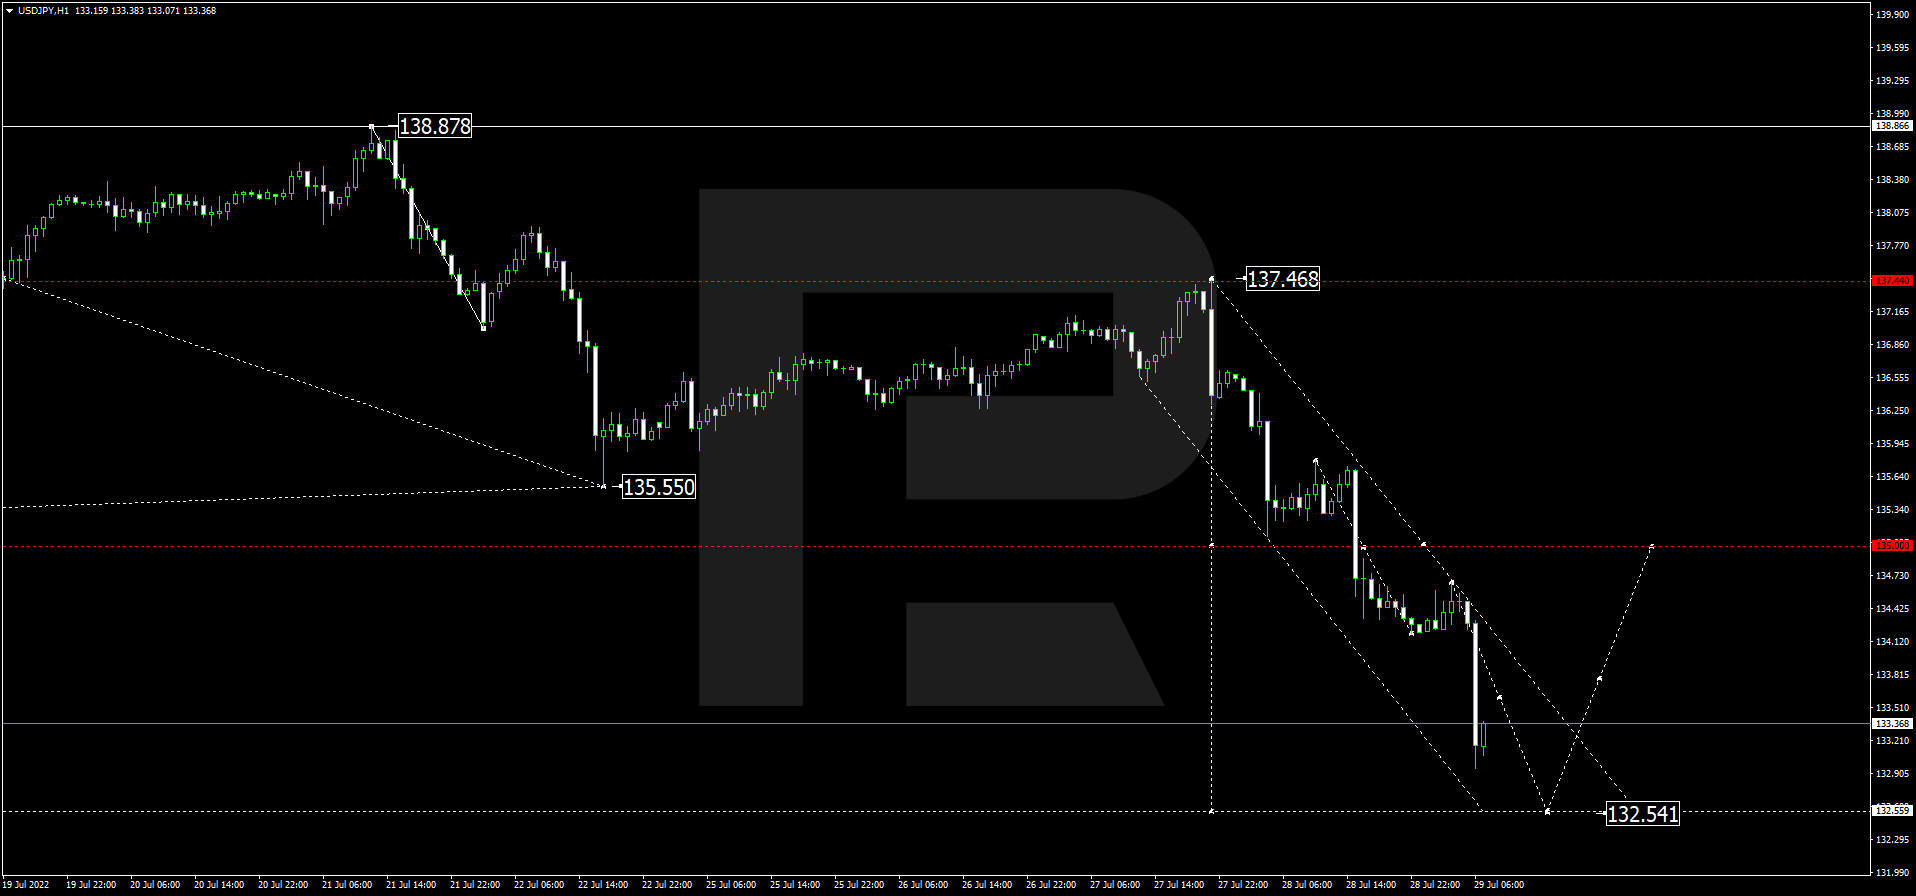
USDJPY, “US Dollar vs Japanese Yen”
USDJPY continues falling with the short-term target at 132.55. After that, the instrument may correct up to 135.00 and then form a new descending structure to reach 131.11.
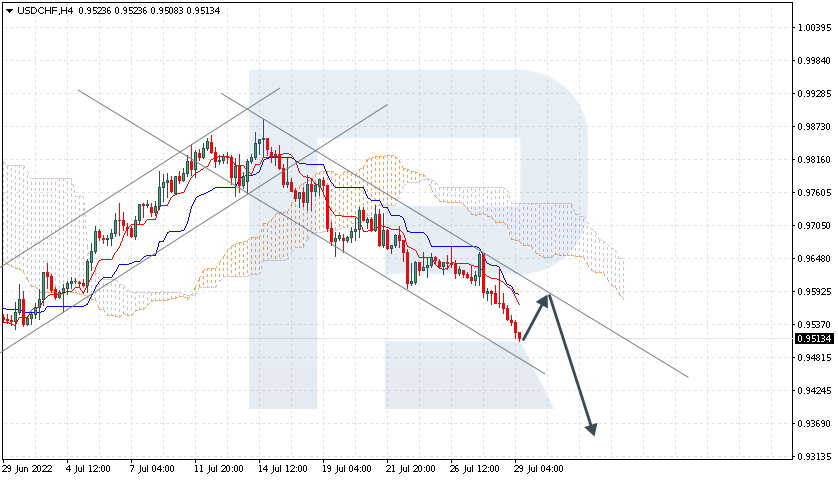
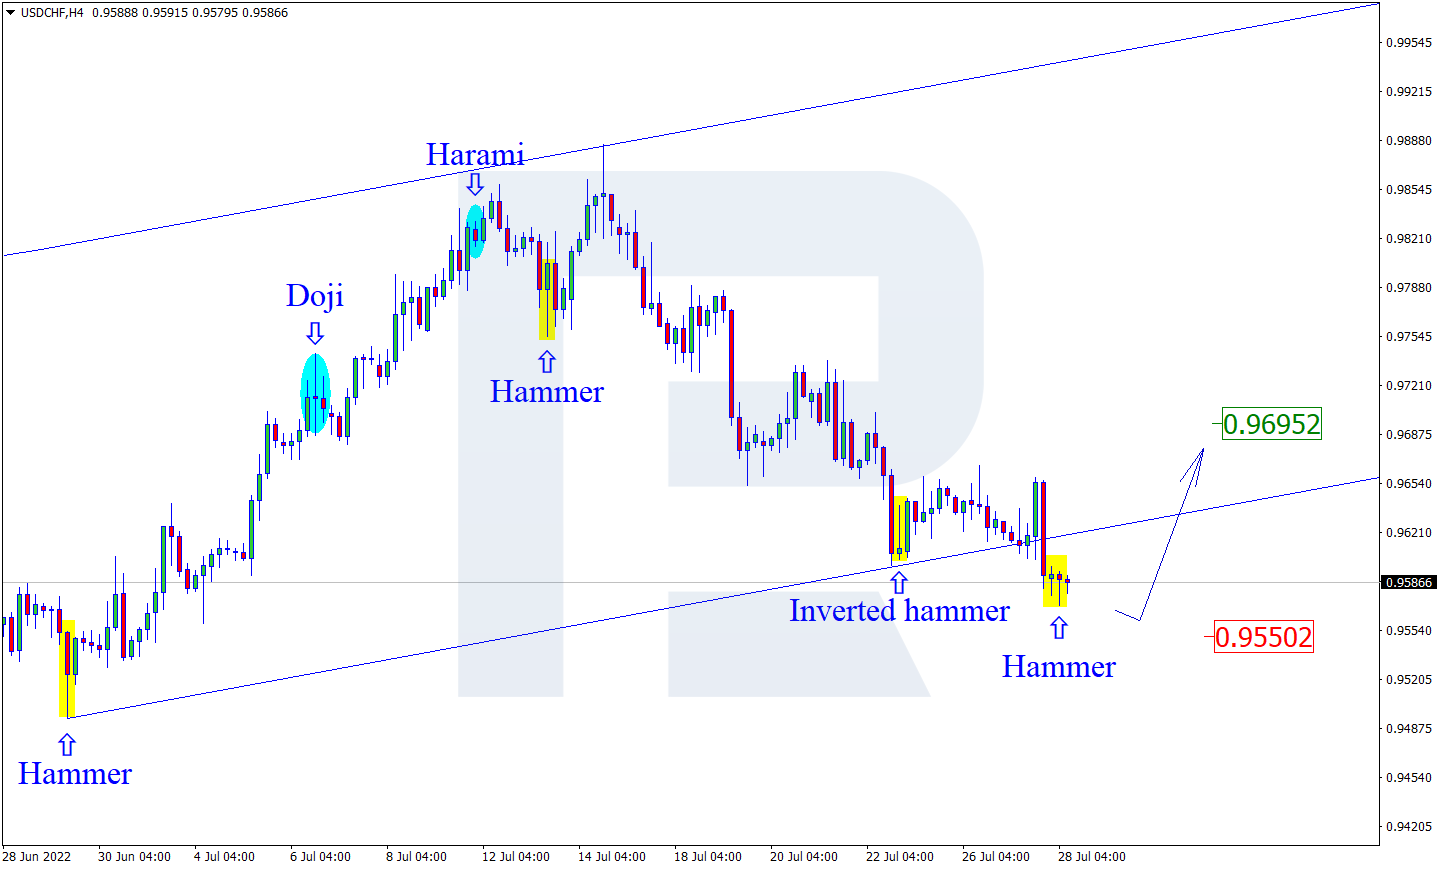
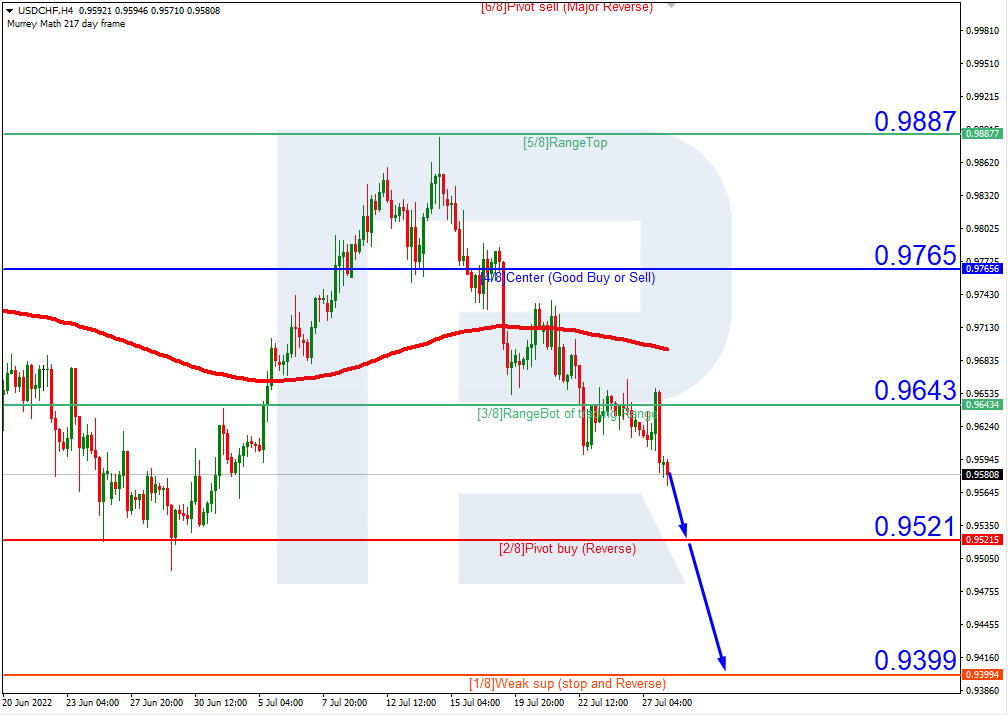
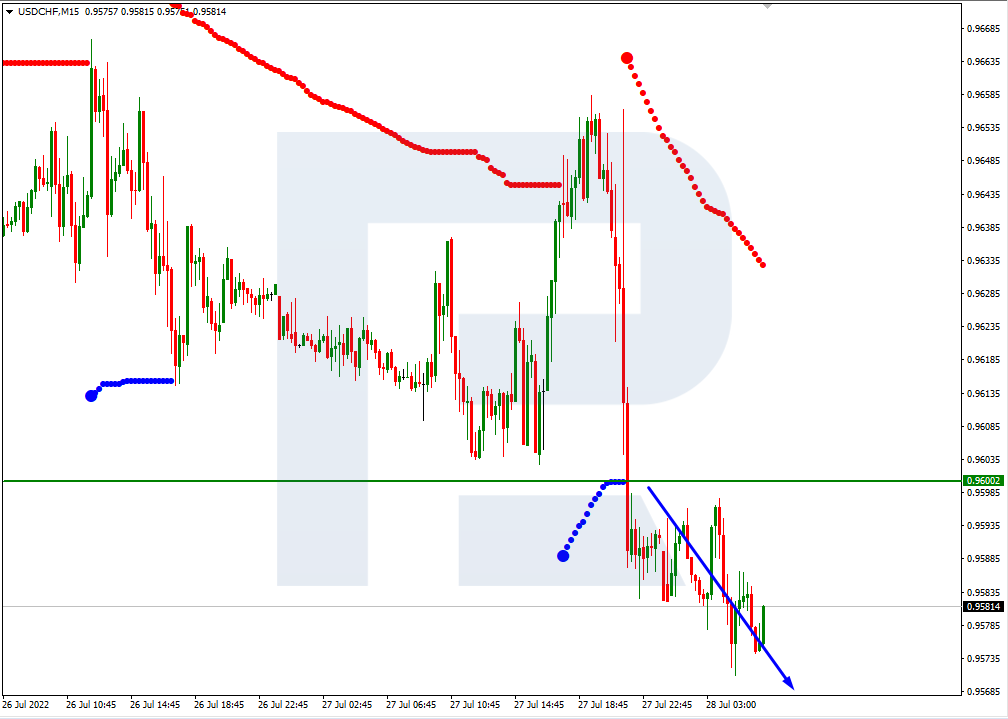
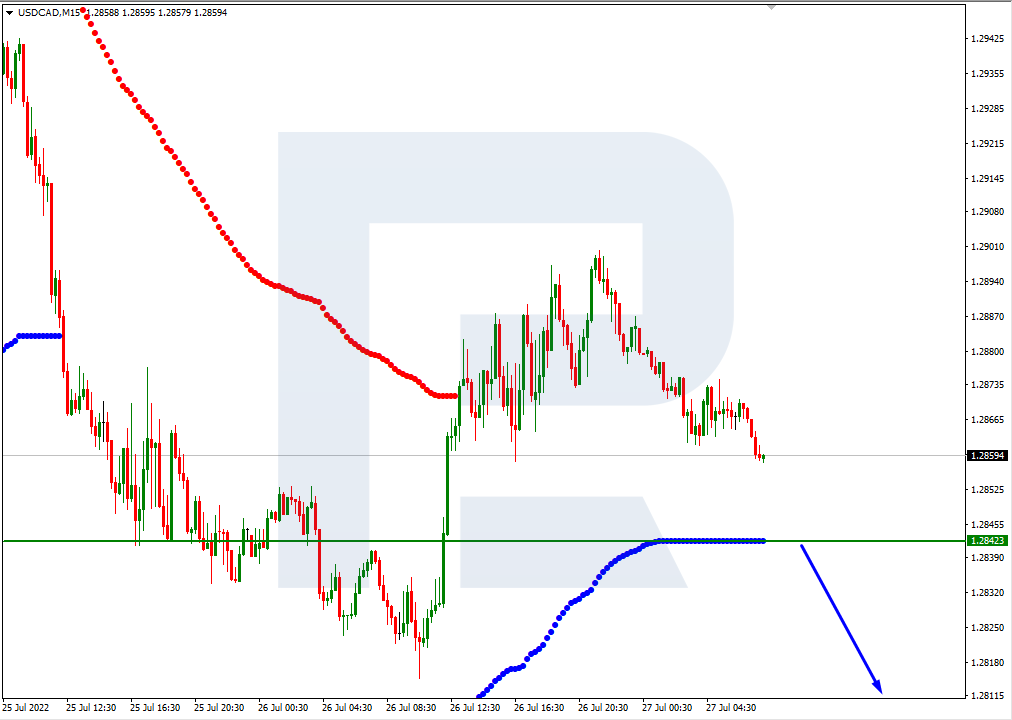
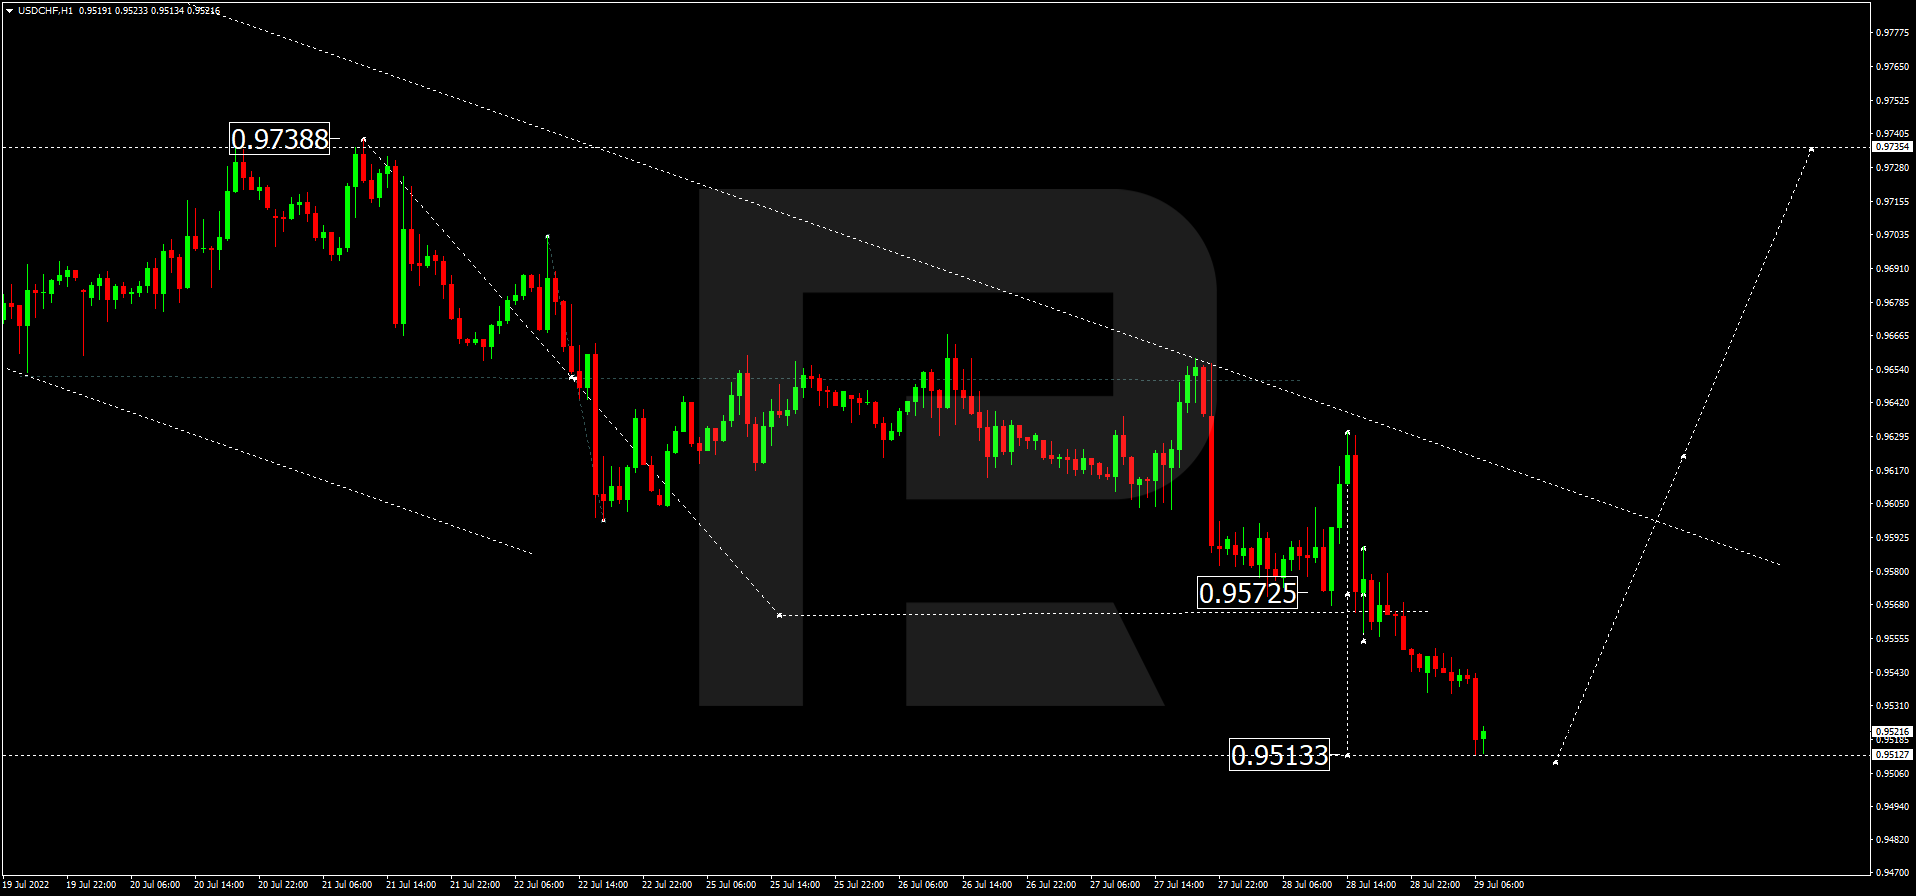
USDCHF, “US Dollar vs Swiss Franc”
Having finished the descending wave at 0.9511, USDCHF is expected to start another growth to break 0.9572. Later, the market may continue trading upwards with the target at 0.9738.
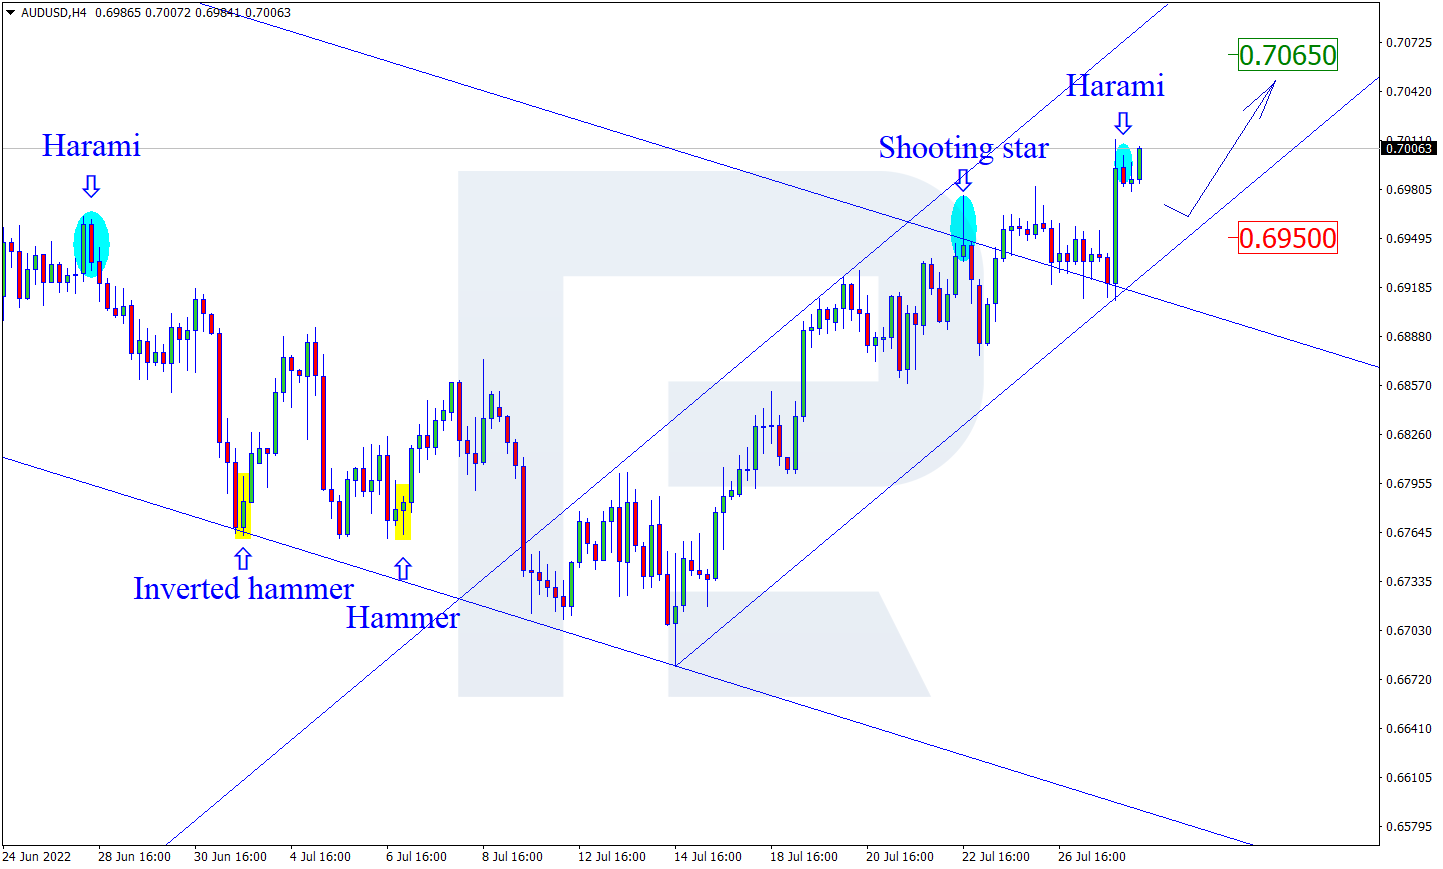
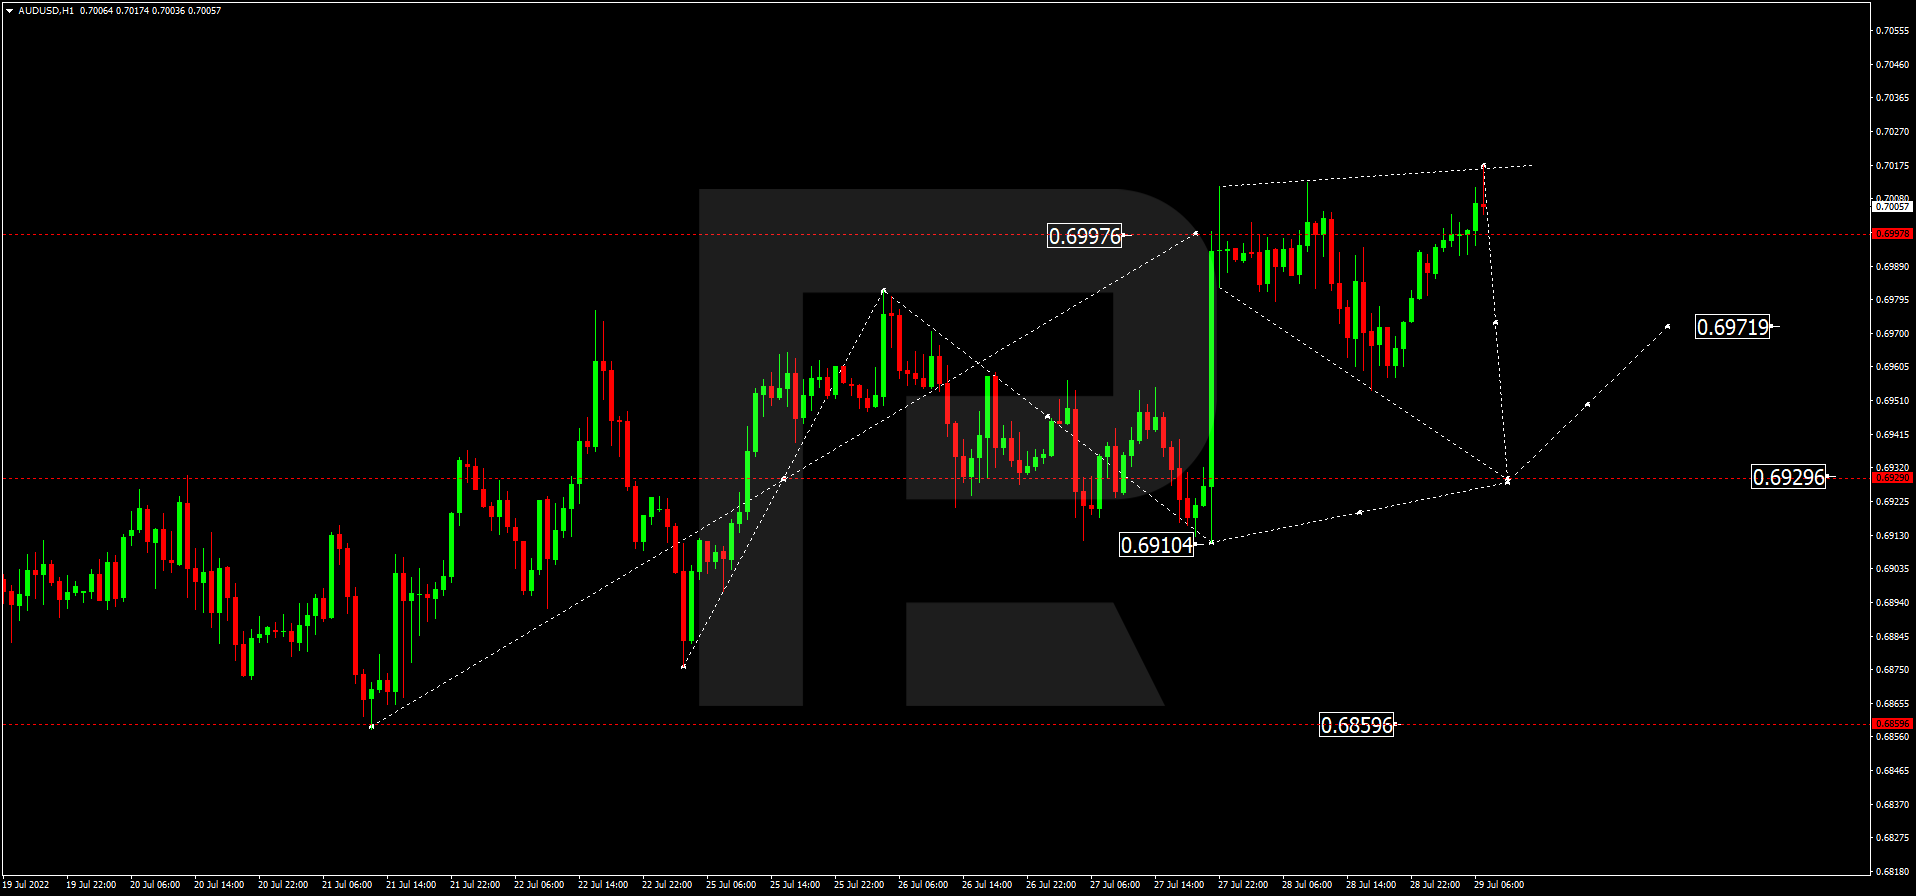
AUDUSD, “Australian Dollar vs US Dollar”
AUDUSD is still consolidating around 0.7000. Possibly, today the pair may resume trading downwards with the target at 0.6930.
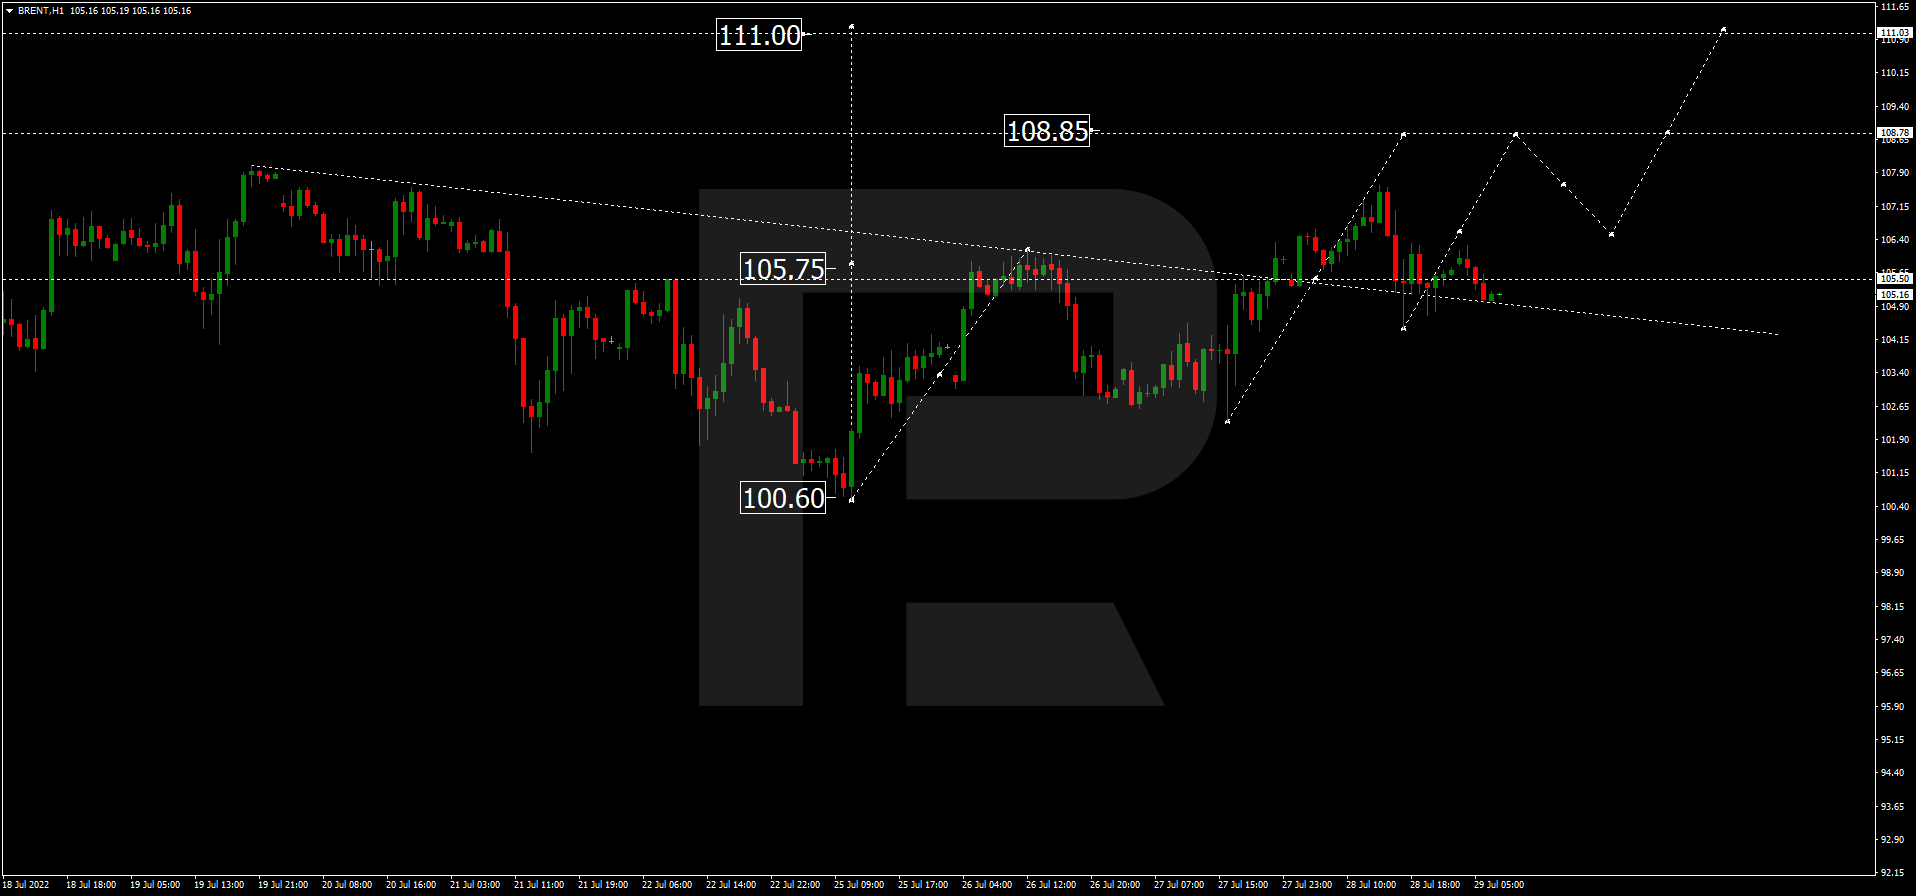
BRENT
Brent continues consolidating around 105.55. Today, the asset may form one more ascending wave with the short-term target at 108.88. After that, the instrument may correct to test 105.55 from above and then start another growth to reach 111.00.
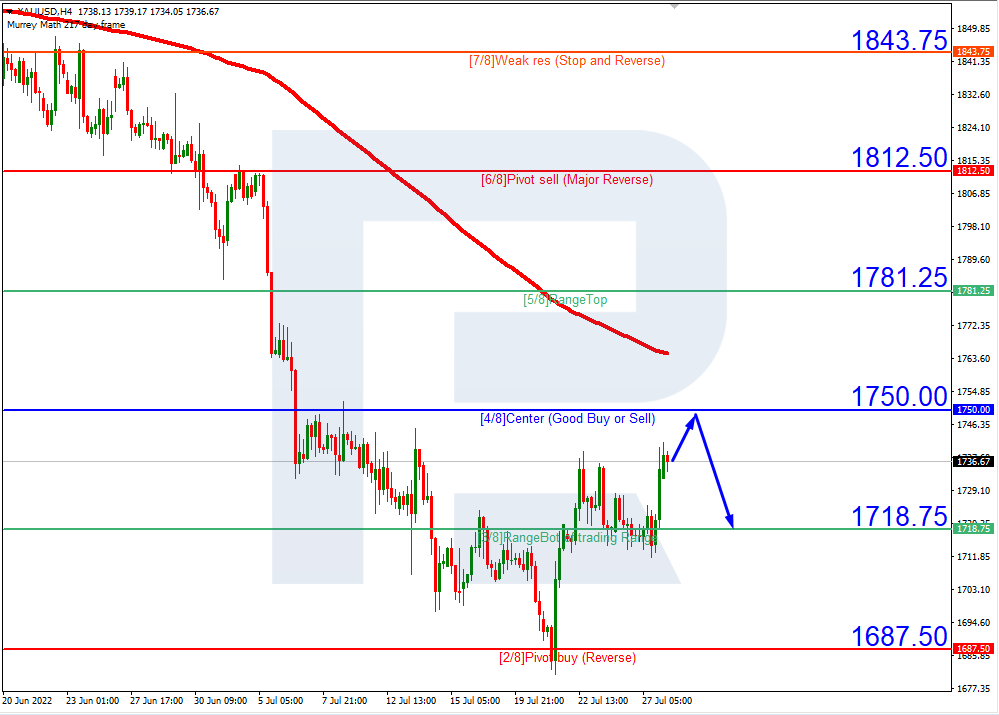
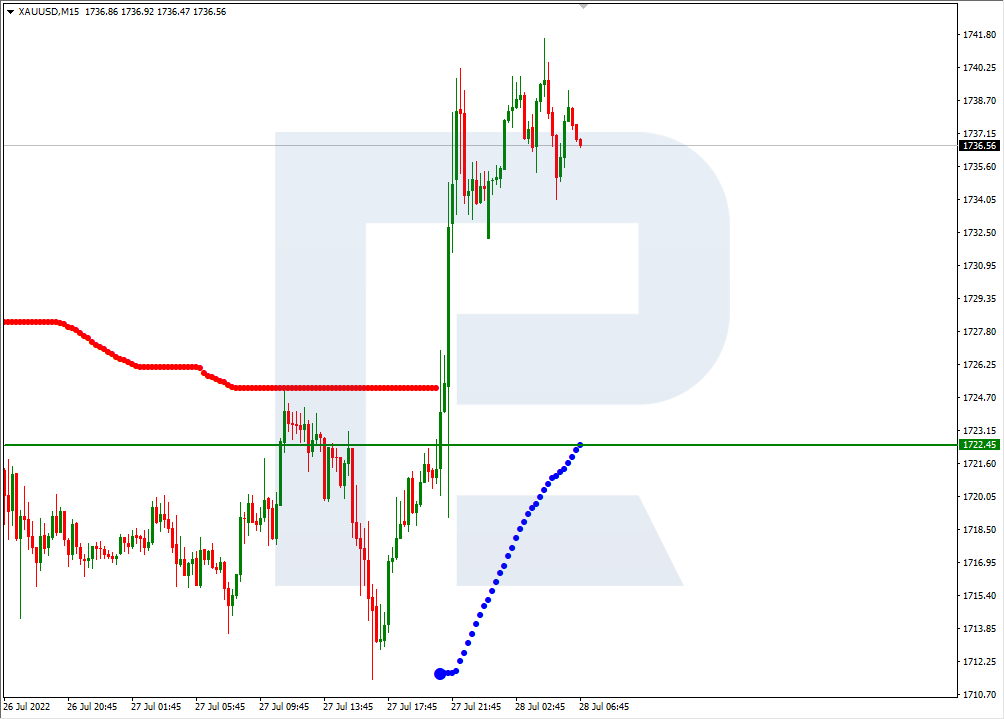
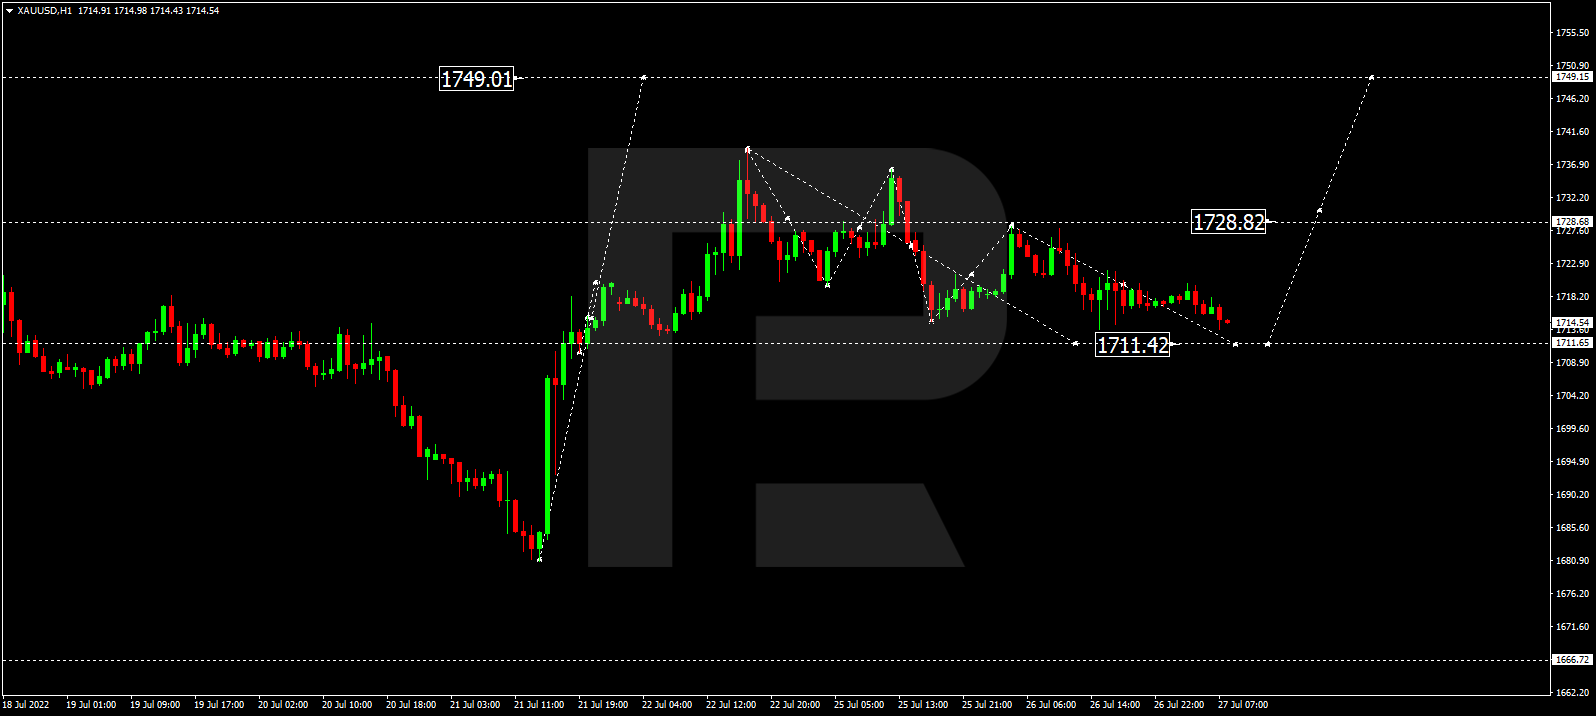
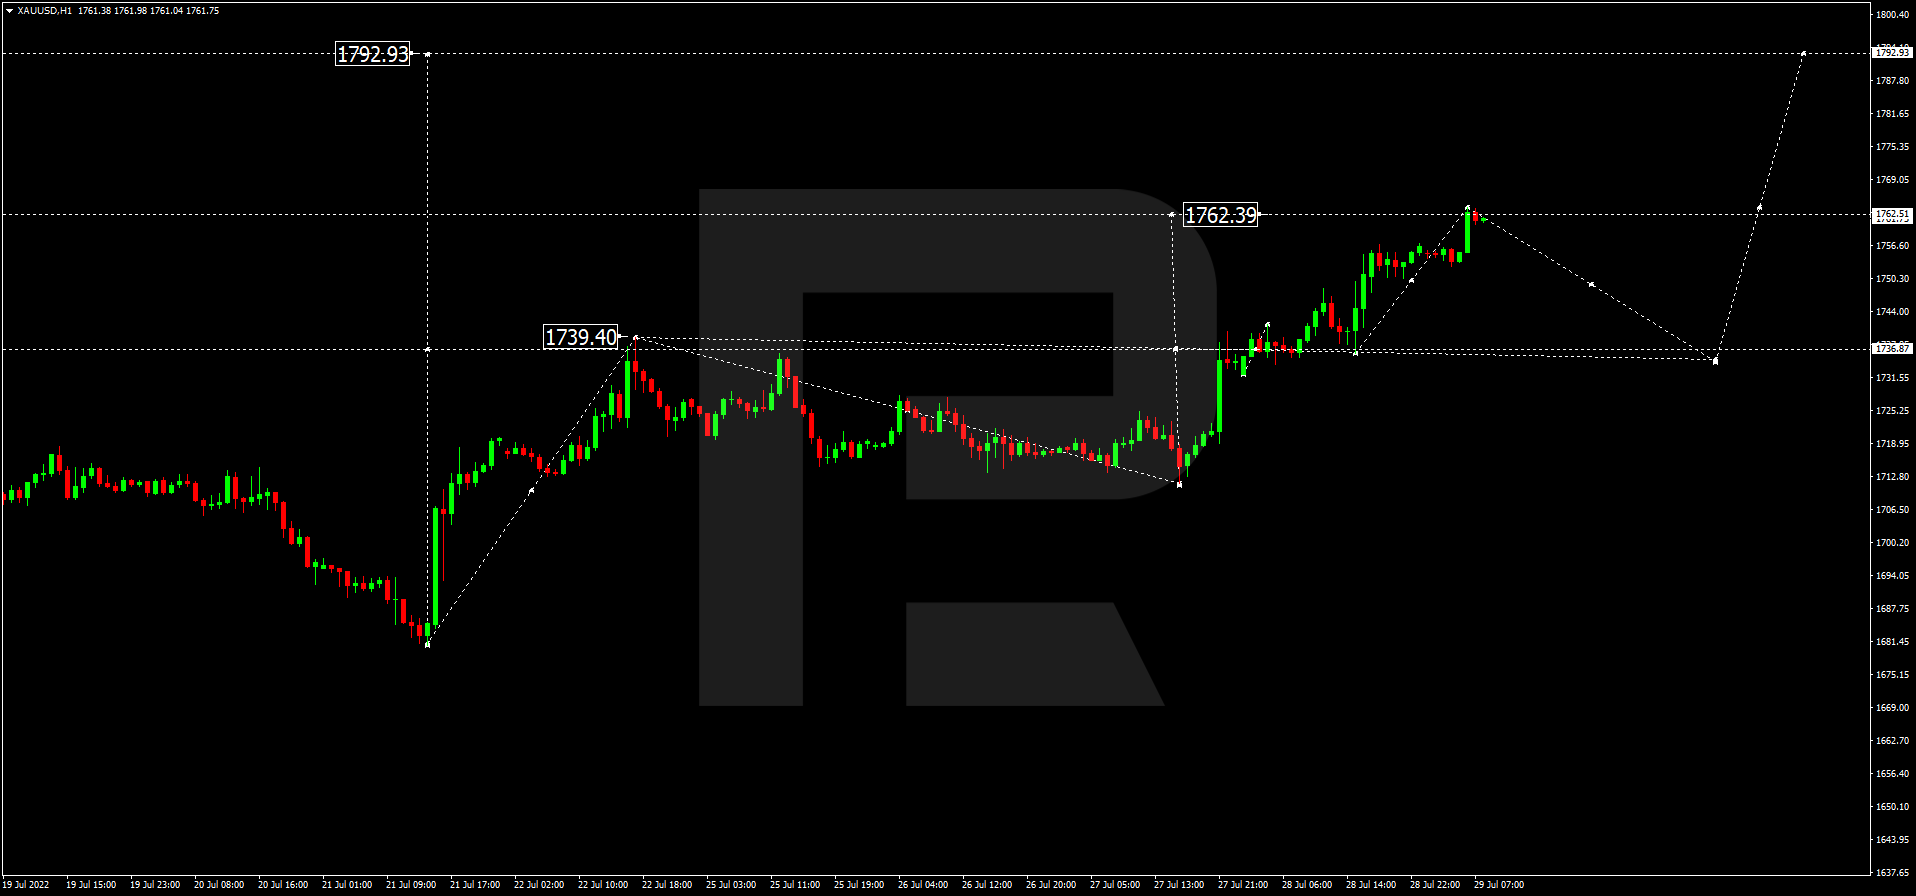
XAUUSD, “Gold vs US Dollar”
Gold has reached the short-term upside target at 1762.40. Today, the metal may start another correction to test 1739.40 from above and then resume trading upwards with the target at 1792.92.
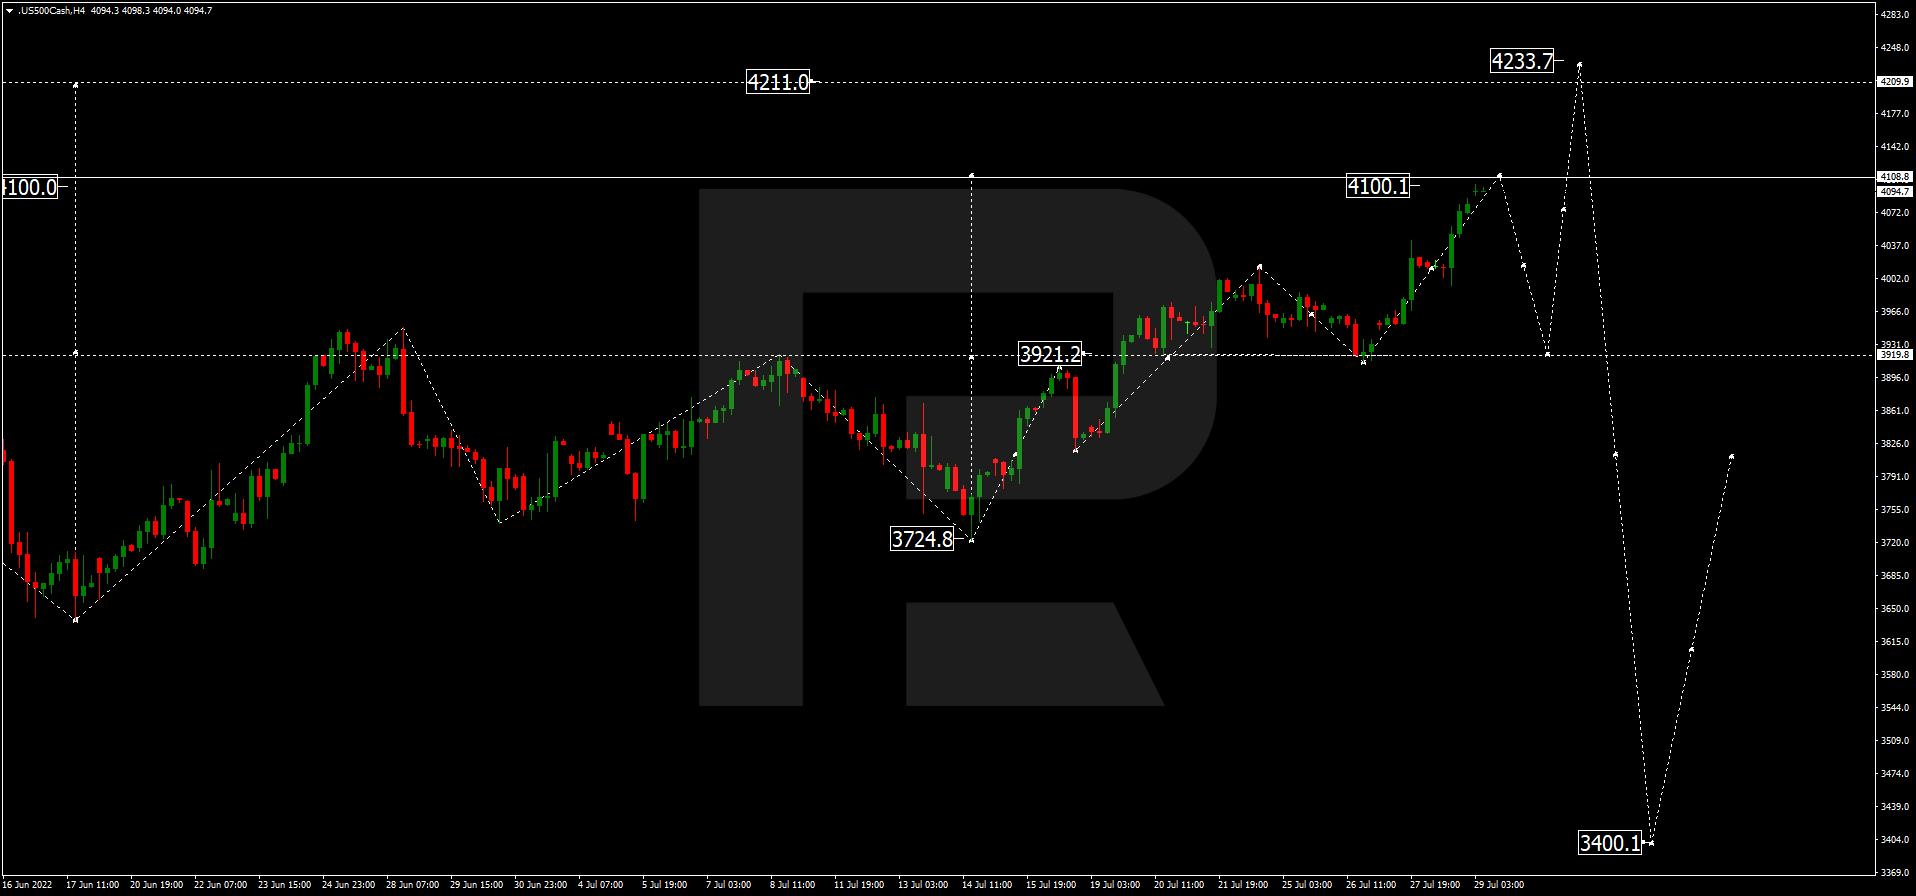
S&P 500
The S&P index has reached the short-term upside target at 4100.0. Possibly, today the asset may consolidate around this level. If later the price breaks the range to the downside, the market may start a new correction towards 3921.2; if to the upside – form one more ascending structure with the target at 4211.0.
Article By RoboForex.com
Attention!
Forecasts presented in this section only reflect the author’s private opinion and should not be considered as guidance for trading. RoboForex LP bears no responsibility for trading results based on trading recommendations described in these analytical reviews.