The GBP/USD pair remains steady around 1.3515, maintaining its strength after reaching a three-year high on 26 May. The British pound has shown greater stability than other major currencies amid rising geopolitical and economic pressures.
Pound supported by global tensions and domestic optimism
Ongoing trade tensions between the US and China continue to weigh on market sentiment, indirectly supporting the pound. President Donald Trump’s decision to double tariffs on steel and aluminium triggered an intense backlash from China, which accused the US of breaching the recent trade deal and threatened to retaliate.
At the same time, optimism about the British economy is helping to sustain demand for the pound. The International Monetary Fund (IMF) upgraded the UK’s 2025 growth forecast to 1.2% from 1.1%. However, it also warned Chancellor Rachel Reeves of the need to exercise strict fiscal discipline ahead of her budget presentation on 11 June.
Inflation remains elevated, particularly in the food sector, where prices rose by 4.1% in May – the highest increase since February 2024. According to Kantar, this has prompted UK consumers to seek more discounts and shift towards cheaper brands.
Due to persistent inflation, the market is currently pricing in only a 40-basis-point rate cut from the Bank of England this year.
Technical analysis of GBP/USD
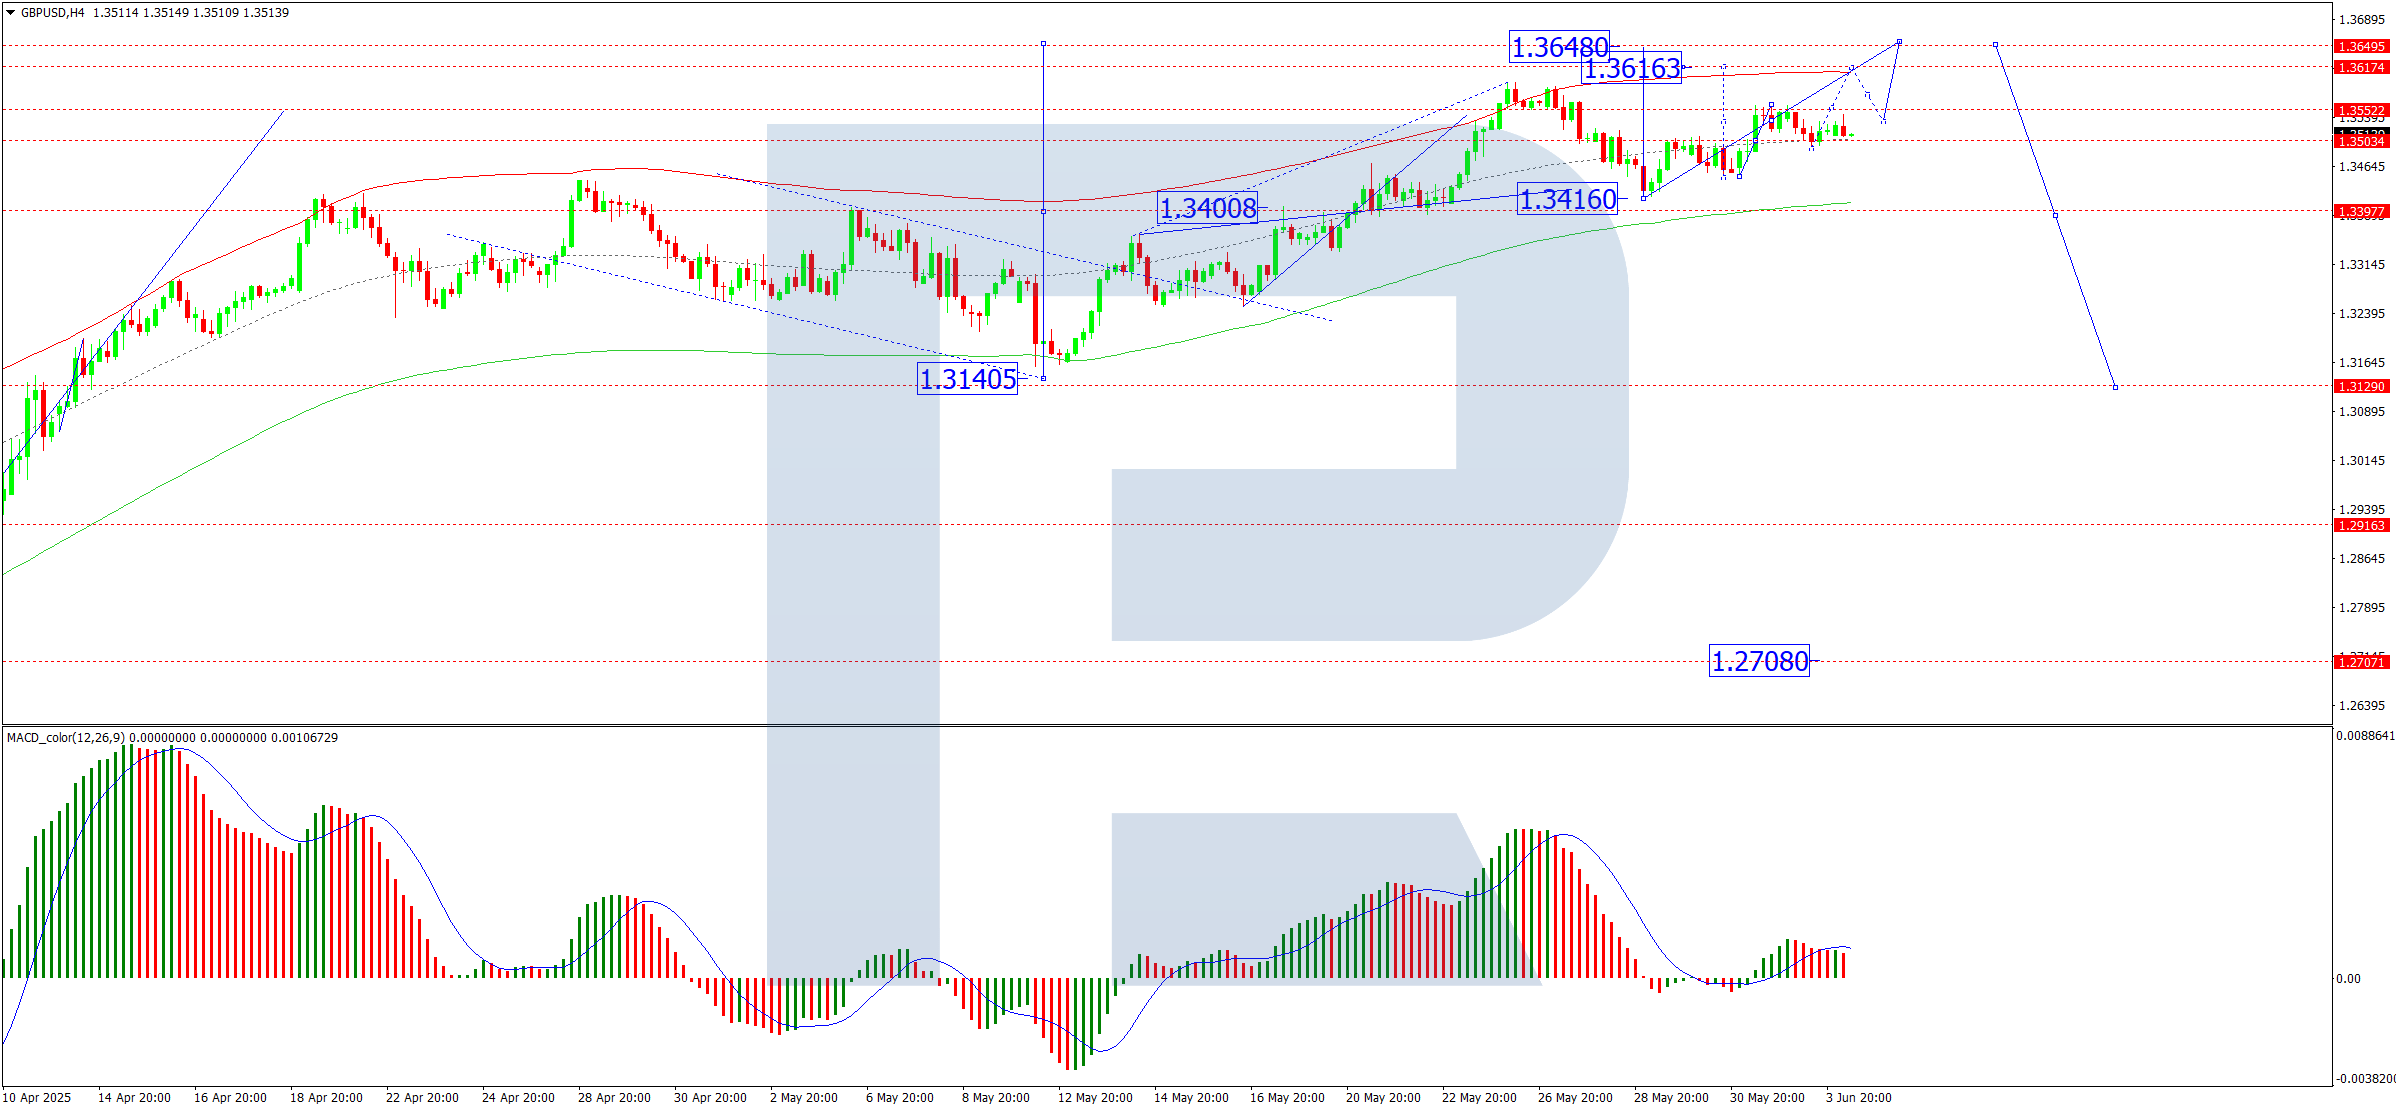
On the H4 chart, GBP/USD continues to develop the fifth wave of growth towards 1.3648. The market is consolidating near 1.3515 and is expected to break upwards towards 1.3616, with the wave potentially extending to 1.3648. If the market breaks downwards, a further correction to 1.3400 is possible before resuming growth. The MACD indicator confirms the bullish scenario, with its signal line above zero and pointing firmly upwards.
On the H1 chart, GBP/USD formed a consolidation range around 1.3515 and broke upwards, nearly hitting the local target of 1.3559. The market is now undergoing a correction, targeting 1.3489. Once this pullback is complete, the next growth wave may reach 1.3583. The Stochastic oscillator supports this view, with its signal line below 50 and heading sharply downwards towards 20, suggesting room for a short-term dip before renewed upward momentum.
Conclusion
GBP/USD remains firm near multi-year highs, supported by a mix of global trade tensions, domestic economic optimism, and elevated inflation. Technically, the outlook remains bullish, with key targets at 1.3583, 1.3616 and 1.3648. Support levels are at 1.3489 and 1.3400 in the event of a pullback. The pound’s relative stability continues to position it as one of the more resilient major currencies in the current environment.
Disclaimer
Any forecasts contained herein are based on the author’s particular opinion. This analysis may not be treated as trading advice. RoboForex bears no responsibility for trading results based on trading recommendations and reviews contained herein.
The EUR/USD pair rose to 1.1418 before pausing, as bearish sentiment towards the US dollar intensified following the release of disappointing US macroeconomic data and escalating trade tensions.
The dollar is under pressure from weak data and trade uncertainty
The dollar came under renewed pressure after the release of weaker-than-expected US manufacturing activity data for May, which pointed to a deeper-than-anticipated slowdown. These figures indicate that economic risks remain elevated, particularly amid continued trade policy uncertainty under President Donald Trump.
Trump’s recent decision to raise steel import tariffs to 50% sparked fresh concerns and drew sharp criticism from major trading partners, further heightening investor unease.
Tensions with China have also escalated, with Beijing rejecting Trump’s accusations of violating the interim trade deal and vowing retaliatory measures to defend its interests.
Looking ahead, markets will closely monitor a series of US macroeconomic releases due on Tuesday, including job openings, durable goods orders, and factory orders – all of which will help assess the health of the US economy.
The eurozone is also set to publish preliminary inflation data for May, which may influence euro sentiment. However, for now, investors remain optimistic about EUR/USD. Barring any surprises, the pair appears well-supported.
Technical analysis of EUR/USD
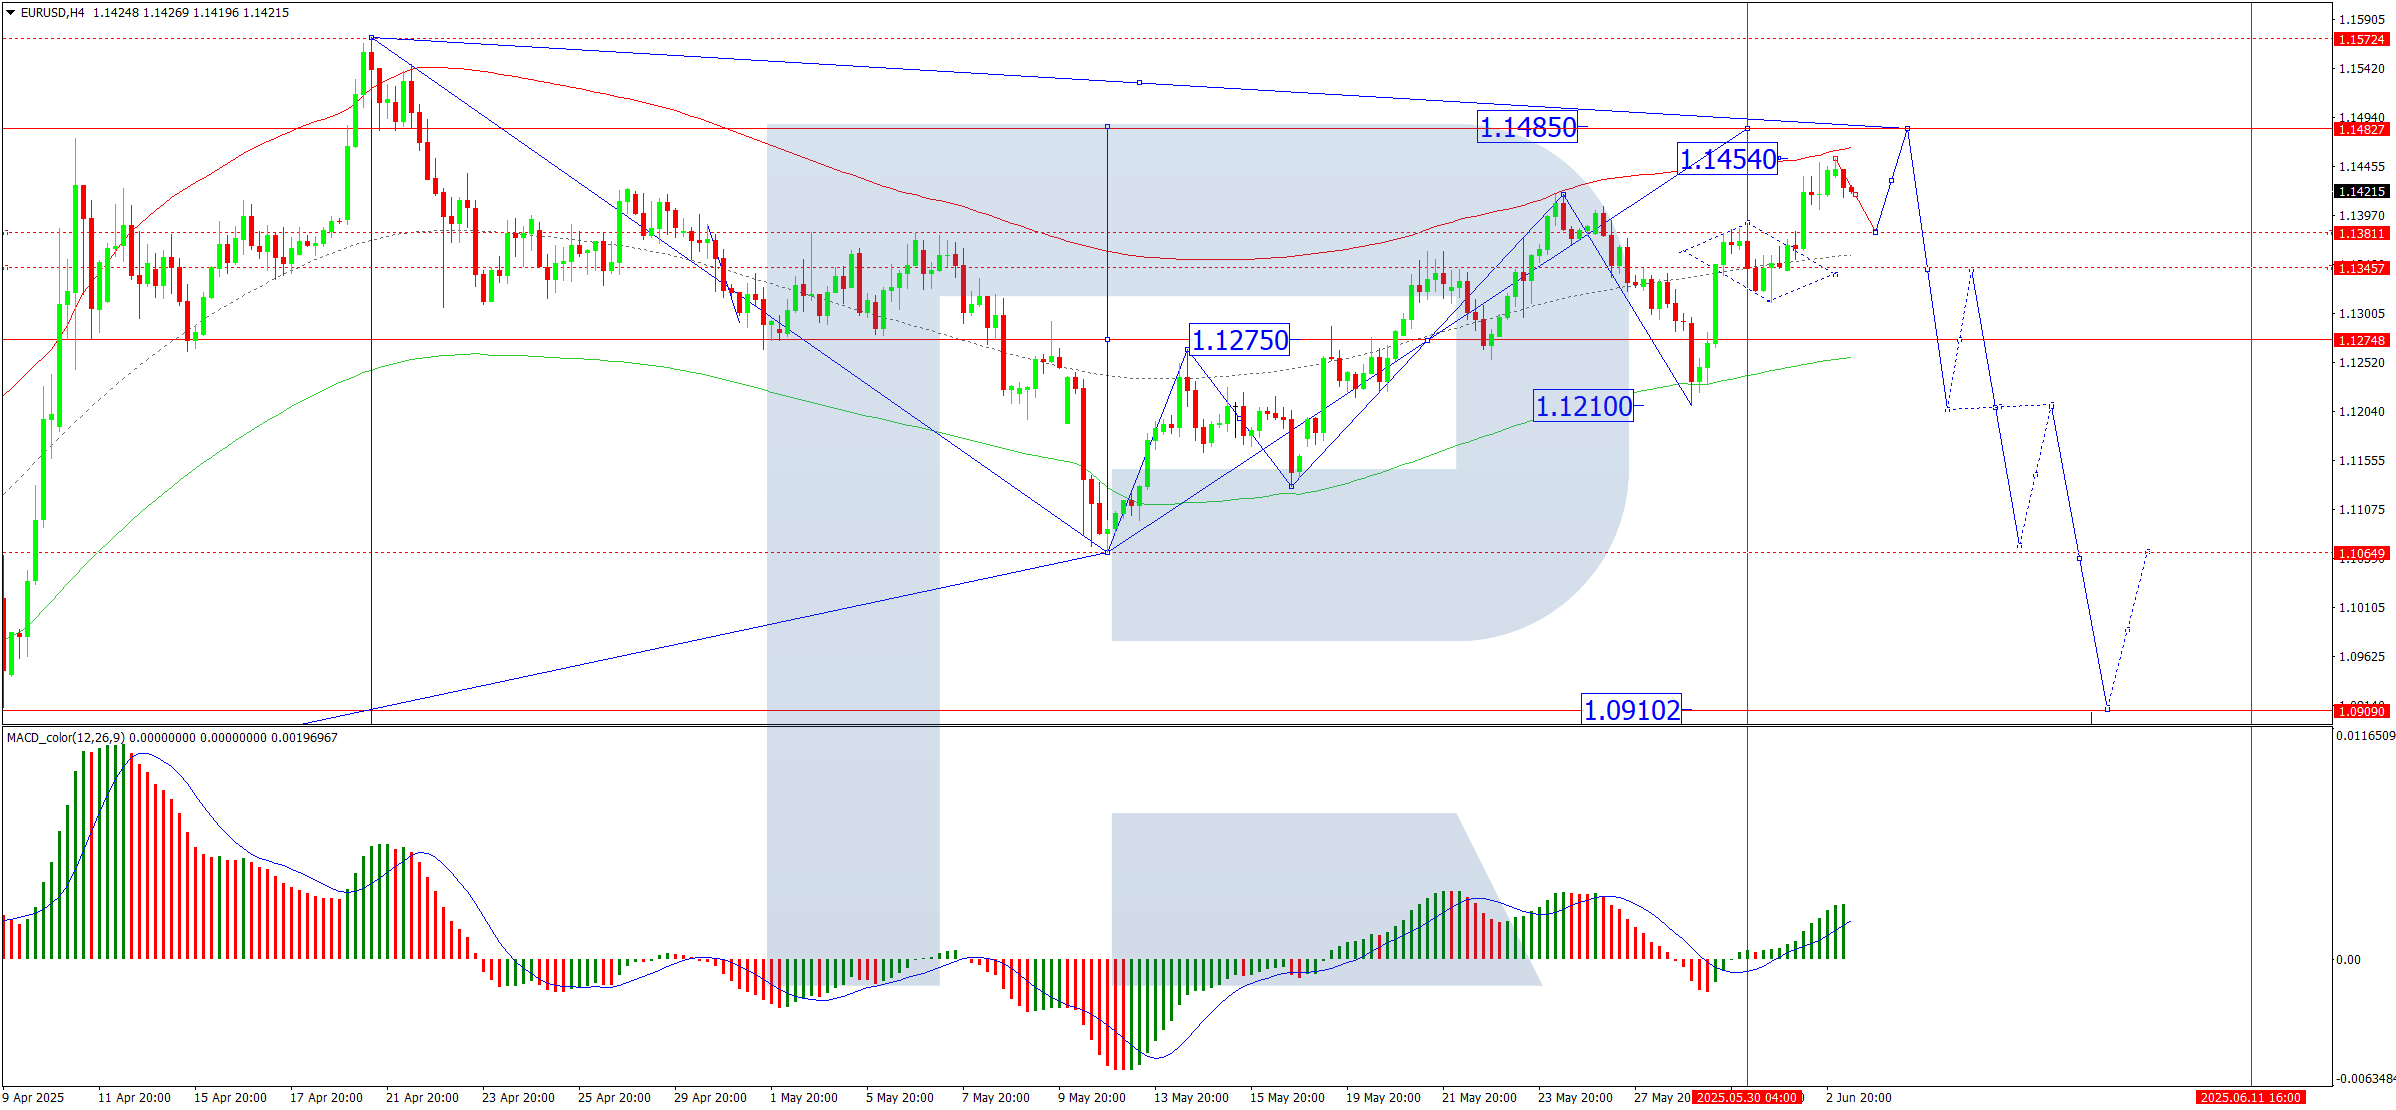
On the H4 chart, EUR/USD is extending the fifth wave of growth towards 1.1485. The market has already met the local target at 1.1450, and a short-term correction to 1.1380 is expected next. Once this pullback concludes, a final push towards 1.1485 is likely, marking the end of the current growth wave. From there, a new downward phase may begin, with a target at 1.1210. The MACD indicator supports this scenario, with its signal line above zero and pointing sharply upwards, indicating continued bullish momentum.
On the H1 chart, EUR/USD formed a consolidation range around 1.1350, broke to the upside, and completed the growth structure, reaching a local target of 1.1450 within the fifth wave. A correction to 1.1380 is anticipated, followed by another growth wave towards 1.1485. The Stochastic oscillator confirms this outlook, with its signal line below 20 and preparing to rise towards 80, signalling a potential bullish continuation after the correction.
Conclusion
EUR/USD remains well-positioned for further gains amid mounting US economic concerns and renewed trade tensions. The pair has short-term support at 1.1380 and faces resistance at 1.1485. A reversal could occur once the current growth wave is exhausted, with 1.1210 as a longer-term downside target. For now, technical indicators and market sentiment continue to point to further upside, particularly if upcoming US data confirms a weakening economic outlook.
Disclaimer
Any forecasts contained herein are based on the author’s particular opinion. This analysis may not be treated as trading advice. RoboForex bears no responsibility for trading results based on trading recommendations and reviews contained herein.
The US stocks rose on Monday, starting June with growth, despite heightened tensions in global trade. At the end of Monday, the Dow Jones Index (US30) rose by 0.08%. The S&P 500 Index (US500) added 0.41%. The Nasdaq Technology Index (US100) closed higher at 0.67%. Tensions between the US and China have risen again after Beijing responded to US accusations of violating the tariff truce by accusing Washington of doing so. Markets are watching for a possible conversation this week between President Trump and Chinese President Xi, which could be decisive in clarifying the trade situation.
The Mexican peso strengthened to 19.2 per US dollar, its highest level in eight months, largely reflecting the weakening of the US dollar amid renewed trade restrictions and dovish shifts in US monetary expectations. Domestically, moderate growth in unemployment to 2.5% in April and stable core inflation support the Bank of Mexico’s decision to keep rates unchanged, underscoring the peso’s resilience amid global headwinds.
The Canadian dollar strengthened above the 1.37 threshold against the US dollar, reaching its highest level in almost eight months, supported by strong domestic economic indicators and rising commodity prices. In the first quarter, Canada’s economy grew by 2.2% year-on-year, exceeding the consensus expectations of 1.7%, thanks to significant growth in exports and accumulation of inventories, as companies began active deliveries ahead of expected steel tariffs in the US, while retail sales also showed notable growth in the second month, indicating broad demand.
European stock markets traded without a single trend yesterday. The German DAX (DE40) fell by 0.28%, the French CAC 40 (FR 40) closed down 0.19%, and the Spanish IBEX35 (ES35) rose by 0.36%, and the British FTSE 100 (UK100) closed up 0.02%. Negotiations between Kyiv and Moscow ended without a ceasefire, with only an agreement on the exchange of prisoners. Investors have now shifted their attention to the upcoming ECB meeting, where another rate cut is expected.
WTI oil prices rose to around $62.9 per barrel on Tuesday, continuing their rise for the second session in a row, as ongoing geopolitical tensions heighten concerns about a reduction in global supply. On Monday, Russia and Ukraine held a second round of direct peace talks after a sharp escalation of hostilities the day before, but the discussions did not yield significant progress in resolving the conflict. Iran is ready to reject the US proposal to end the decades-long nuclear dispute, arguing that it does not serve Tehran’s interests and does not soften Washington’s position on uranium enrichment.
On Monday, silver prices rose more than 5% to $34.60 per ounce, reaching two-month highs, as escalating tensions in global trade increased demand for safe assets. Amid growing uncertainty surrounding global trade policy and its potential economic implications, investors have turned to precious metals as a hedge, causing silver prices to rise alongside gold prices.
Asian markets mostly fell yesterday. Japan’s Nikkei 225 (JP225) fell by 1. 30%, China’s FTSE China A50 (CHA50) lost 0.44%, Hong Kong’s Hang Seng (HK50) decreased by 0.57%, and Australia’s ASX 200 (AU200) posted a negative result of 0.24%.
The Australian dollar weakened to 0.647 US dollars on Tuesday, reversing the sharp rise of the previous session, after the Australian Central Bank said it had considered an excessive rate cut last month. During its May meeting, the Central Bank said that policymakers had considered a bold 50 basis point rate cut as “insurance” against growing global trade risks, but ultimately opted for a more cautious 25 basis point cut. Nevertheless, markets now estimate the probability of another rate cut at the next RBA meeting at around 70%, although many analysts expect the Central Bank to wait for second-quarter inflation data before taking further action.
On Tuesday, the New Zealand dollar fell to around US$0.60, cutting its gains by 1% from the previous session and retreating from its highest level since November last year, as the US dollar regained strength. Investors continued to weigh the risks associated with ongoing global trade tensions, with friction between China and the US intensifying after Beijing rejected Trump’s claim of trade rule violations and vowed to retaliate. Additional pressure on bears came from private data from China showing a sharp decline in factory activity in May, raising concerns about kiwi exports given China’s role as a key trading partner.
S&P 500 (US500) 5,935.94 +24.25 (+0.41%)
Dow Jones (US30) 42,305.48 +35.41 (+0.084%)
DAX (DE40) 23,930.67 −66.81 (−0.28%)
FTSE 100 (UK100) 8,774.26 +1.88 (+0.021%)
USD Index 98.71 −0.62 (−0.62%)
News feed for: 2025.06.03
Australia Monetary Policy Meeting Minutes at 04:30 (GMT+3);
Caixin China Manufacturing PMI (m/m) at 04:45 (GMT+3);
Switzerland Consumer Price Index (m/m) at 09:30 (GMT+3);
Eurozone Consumer Price Index (m/m) at 12:00 (GMT+3);
Eurozone Unemployment Rate (m/m) at 12:00 (GMT+3);
This article reflects a personal opinion and should not be interpreted as an investment advice, and/or offer, and/or a persistent request for carrying out financial transactions, and/or a guarantee, and/or a forecast of future events.
At the end of Friday, the Dow Jones Index (US30) rose by 0.13% (+1.79% for the week). The S&P500 (US500) Index fell by 0.01% (+2.24% for the week). The Nasdaq (US100) technology Index closed down 0.11% (+2.57% for the week). The US stocks recouped most of their earlier losses in late trading on Friday after Donald Trump said he expected talks with Xi Jinping following accusations that China had violated trade agreements. President Trump said that China had “completely violated” its trade agreement with the US, heightening fears of a protracted dispute. Chipmakers led the decline in the technology sector: Nvidia, AMD, Micron, and Intel fell more than 1.5%. Meanwhile, the Fed’s preferred inflation gauge showed easing price pressures, providing some relief.
The Canadian dollar strengthened above 1.38 per dollar, approaching the seven-month high of 1.37 reached on May 26, as strong data prompted markets to reevaluate the extent of rate cuts by the Bank of Canada. In the first quarter, Canada’s GDP grew by 2.2% year-on-year, significantly exceeding growth expectations of 1.7%. Although much of the support came from strong exports and inventories due to stockpiling ahead of US tariffs, the result was still supported by other data pointing to the resilience of the Canadian economy. Retail sales rose sharply for the second month in a row.
European stock markets were mostly up on Friday. The German DAX (DE40) rose by 0.27% (-0.05% for the week), while the French CAC 40 (FR40) closed down 0.36% (-1.04% for the week), the Spanish IBEX35 (ES35) added 0.25% (-0.75% for the week), and the British FTSE 100 (UK100) closed up 0.64% (+0.38% for the week). Investors welcomed economic data, including favorable inflation data from Germany, Italy, and Spain, which reinforced expectations of an ECB rate cut this week. However, market sentiment was weakened by ongoing trade uncertainty. The Federal Appeals Court overturned a lower court ruling and temporarily reinstated President Donald Trump’s tariffs, a day after they were overturned for exceeding presidential authority.
On Saturday, OPEC+ announced an increase in oil production of 411,000 barrels per day (bpd) in July. The decision was made during a virtual meeting in which member countries, including Saudi Arabia, Russia, Iraq, the UAE, Kuwait, Kazakhstan, Algeria, and Oman, assessed the state of the global market. The group had initially planned a more modest increase of 134,000 barrels per day, but adjusted its strategy, citing “the sustained outlook for the global economy and the current healthy fundamentals of the market, reflected in low oil inventories.” Goldman Sachs expects OPEC+ to complete a 0.41 million barrel per day increase in production in August, which will be the last planned adjustment to the current production strategy.
Asian markets traded without a single trend last week. Japan’s Nikkei 225 (JP225) rose by 2.03%, China’s FTSE China A50 (CHA50) fell by 2.03%, Hong Kong’s Hang Seng (HK50) decreased by 0.92%, and Australia’s ASX 200 (AU200) showed a positive result of 0.89%.
The official PMI Index for China’s manufacturing sector from NBS rose to 49.5 in May 2025 from April’s 16-month low of 49.0, matching market expectations and marking the second consecutive month of decline in business activity. Production volumes recovered (50.7 vs. 49.8 in April), helped by the truce in the trade war and Beijing’s efforts to stimulate domestic demand and strengthen the sluggish economy. The official PMI Index for China’s non-manufacturing sector from the NBS fell to 50.3 in May 2025 from 50.4 in the previous month, falling short of market expectations of 50.6 and marking the lowest level since January.
The Australian dollar rose to around 0.646 on Monday, supported by a weaker US dollar amid investor concerns over US President Donald Trump’s tariff measures. On Friday, Trump announced plans to double tariffs on steel and aluminum imports from 25% to 50% starting June 4. This announcement, along with escalating trade tensions between the US and China, heightened investor concerns about slowing growth and rising inflationary pressures. In Australia, data showed that the manufacturing sector weakened for the second consecutive month in May, falling to its lowest level since February, indicating a slowdown in industrial activity.
Annual inflation in Indonesia fell to 1.60% in May 2025 from an eight-month high of 1.95% in April, as price pressures eased after the Eid al-Fitr celebrations. Inflation remained within the central bank’s target range of 1.5% to 3.5%. Core inflation, which excludes administered and volatile food prices, fell to a four-month low of 2.4% from a 22-month peak of 2.50% in April.
S&P 500 (US500) 5,911.69 −0.48 (−0.01%)
Dow Jones (US30) 42,270.07 +54.34 (+0.13%)
DAX (DE40) 23,997.48 +64.25 (+0.27%)
FTSE 100 (UK100) 8,772.38 +55.93 (+0.64%)
USD Index 99.44 +0.16 (+0.16%)
News feed for: 2025.06.02
Australia Manufacturing PMI (m/m) at 02:00 (GMT+3);
Japan Manufacturing PMI (m/m) at 03:30 (GMT+3);
Switzerland Retail Sales (m/m) at 09:30 (GMT+3);
Switzerland GDP (q/q) at 10:00 (GMT+3);
Switzerland Manufacturing PMI (m/m) at 10:30 (GMT+3);
German Manufacturing PMI (m/m) at 10:55 (GMT+3);
Eurozone Manufacturing PMI (m/m) at 11:00 (GMT+3);
UK Manufacturing PMI (m/m) at 11:30 (GMT+3);
US ISM Manufacturing PMI (m/m) at 17:00 (GMT+3);
Eurozone ECB President Lagarde Speaks at 19:30 (GMT+3);
This article reflects a personal opinion and should not be interpreted as an investment advice, and/or offer, and/or a persistent request for carrying out financial transactions, and/or a guarantee, and/or a forecast of future events.
The USD/JPY pair fell to 143.58, marking its third consecutive day of losses. The Japanese yen continues to gain ground as demand for safe-haven assets rises amid escalating global trade tensions.
Trade risks boost yen demand
Demand for safe-haven currencies surged after US President Donald Trump threatened to double tariffs on steel and aluminium imports to 50% from 4 June. This announcement weighed on Japanese steelmakers, with JFE Holdings and Kobe Steel potentially facing headwinds. Nippon Steel may fare better, thanks to Trump’s favourable comments regarding its planned merger with US Steel.
Meanwhile, tensions between the US and China escalated further as Beijing rejected Trump’s accusations of breaching the recently negotiated trade agreement in Geneva.
Domestic data supports the yen
Japan’s latest data revealed stronger-than-expected capital expenditure growth in Q1. Investment activity increased across both the manufacturing and non-manufacturing sectors, reinforcing domestic fundamentals amid global headwinds.
With uncertainty lingering and market preference shifting towards defensive assets, the yen continues to show resilience and may remain firm if current conditions persist.
Technical analysis of USD/JPY
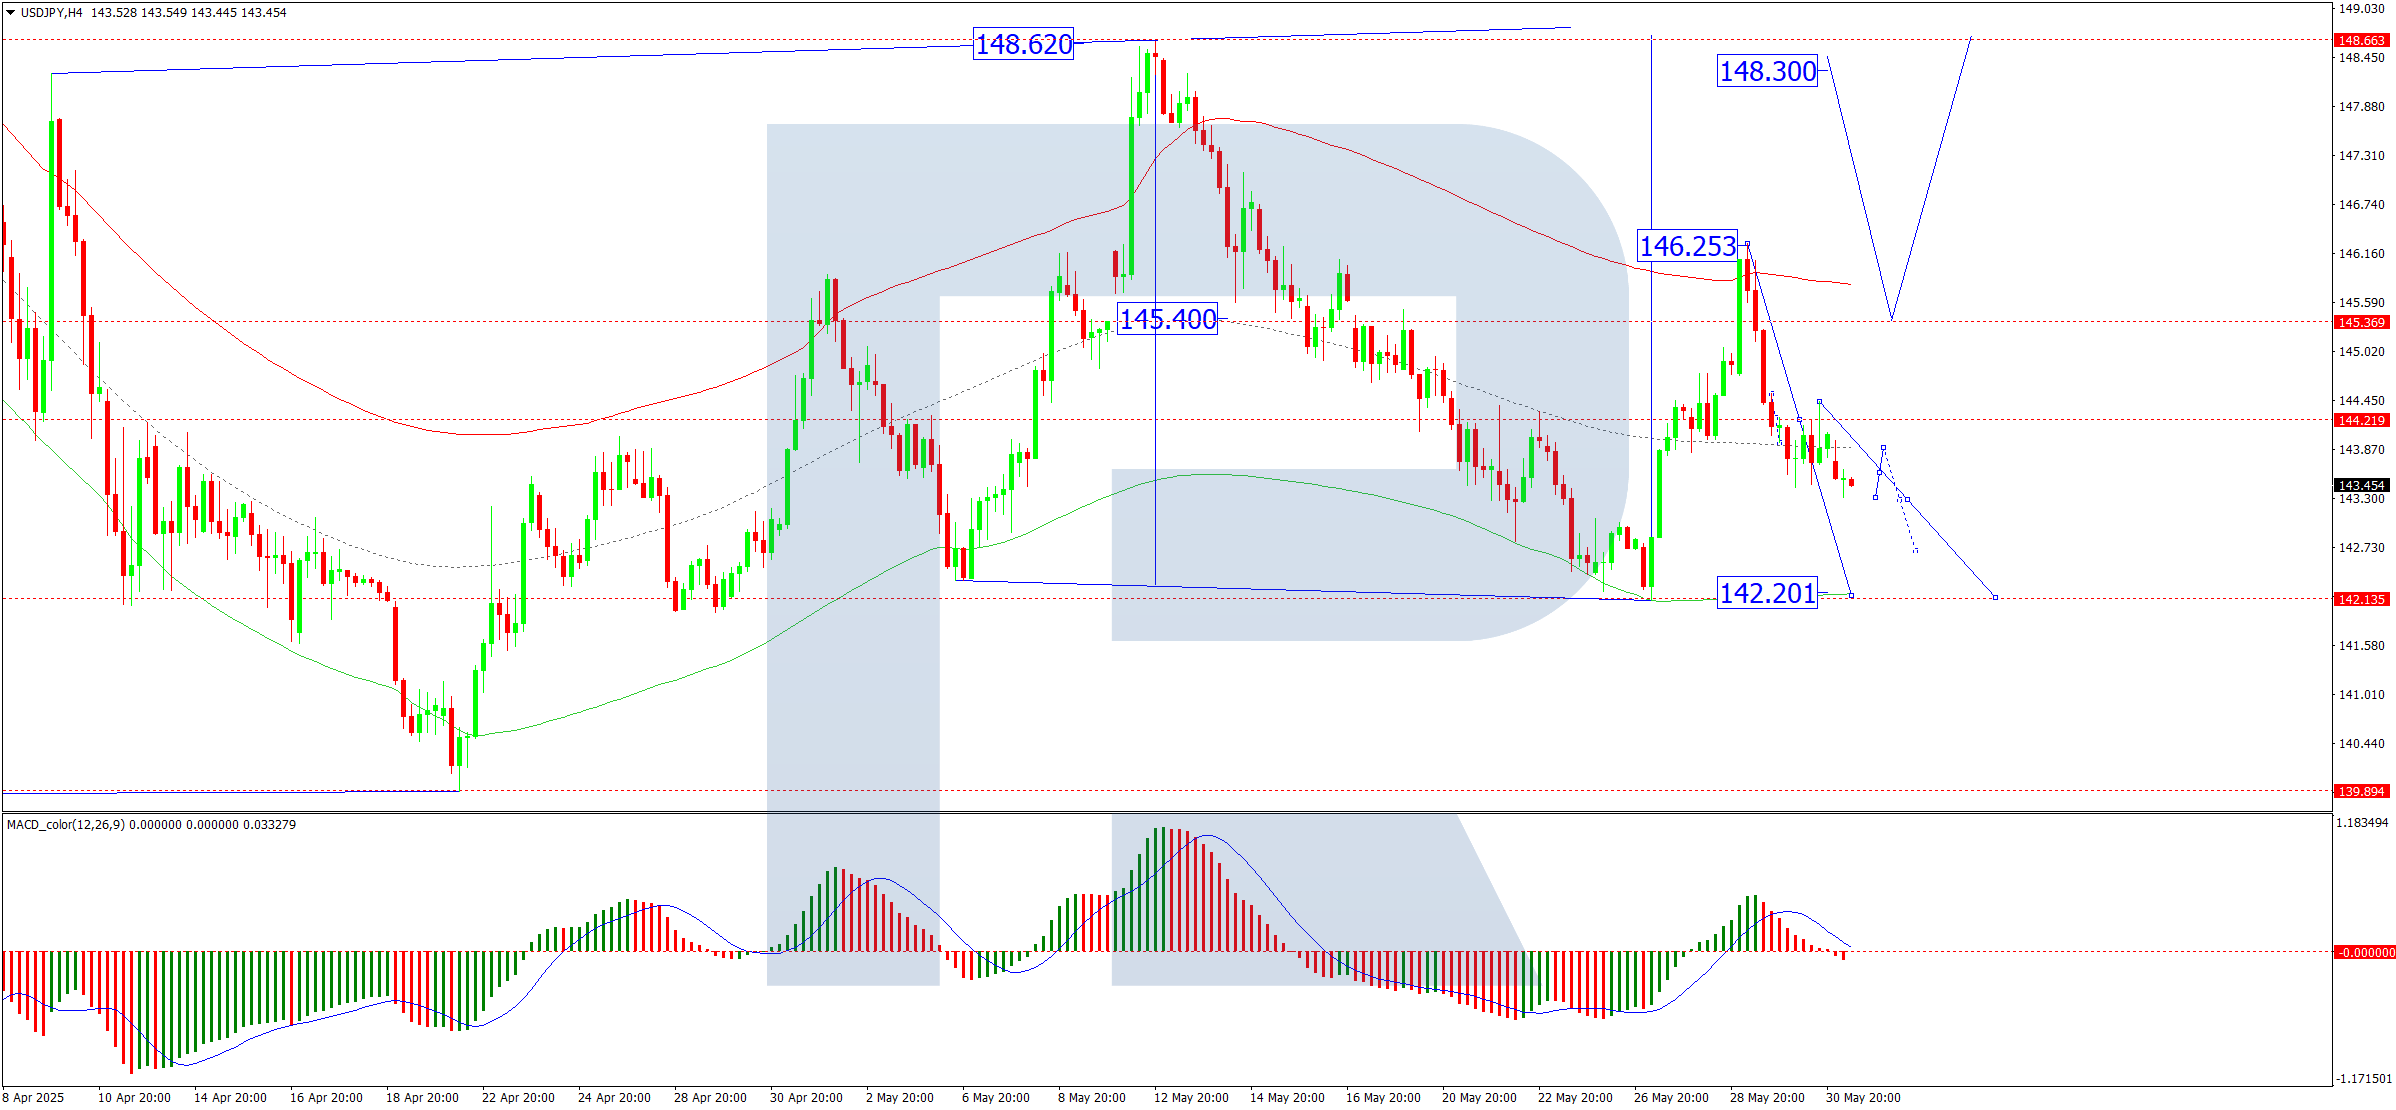
On the H4 chart, USD/JPY formed a narrow consolidation range around 144.22, which the market broke below earlier today. This breakout opens the way for a continued move down towards 142.20. After reaching this level, a corrective rebound to 144.22 is possible. The MACD indicator confirms this scenario, with its signal line below zero and pointing steeply downwards, indicating strong bearish momentum.
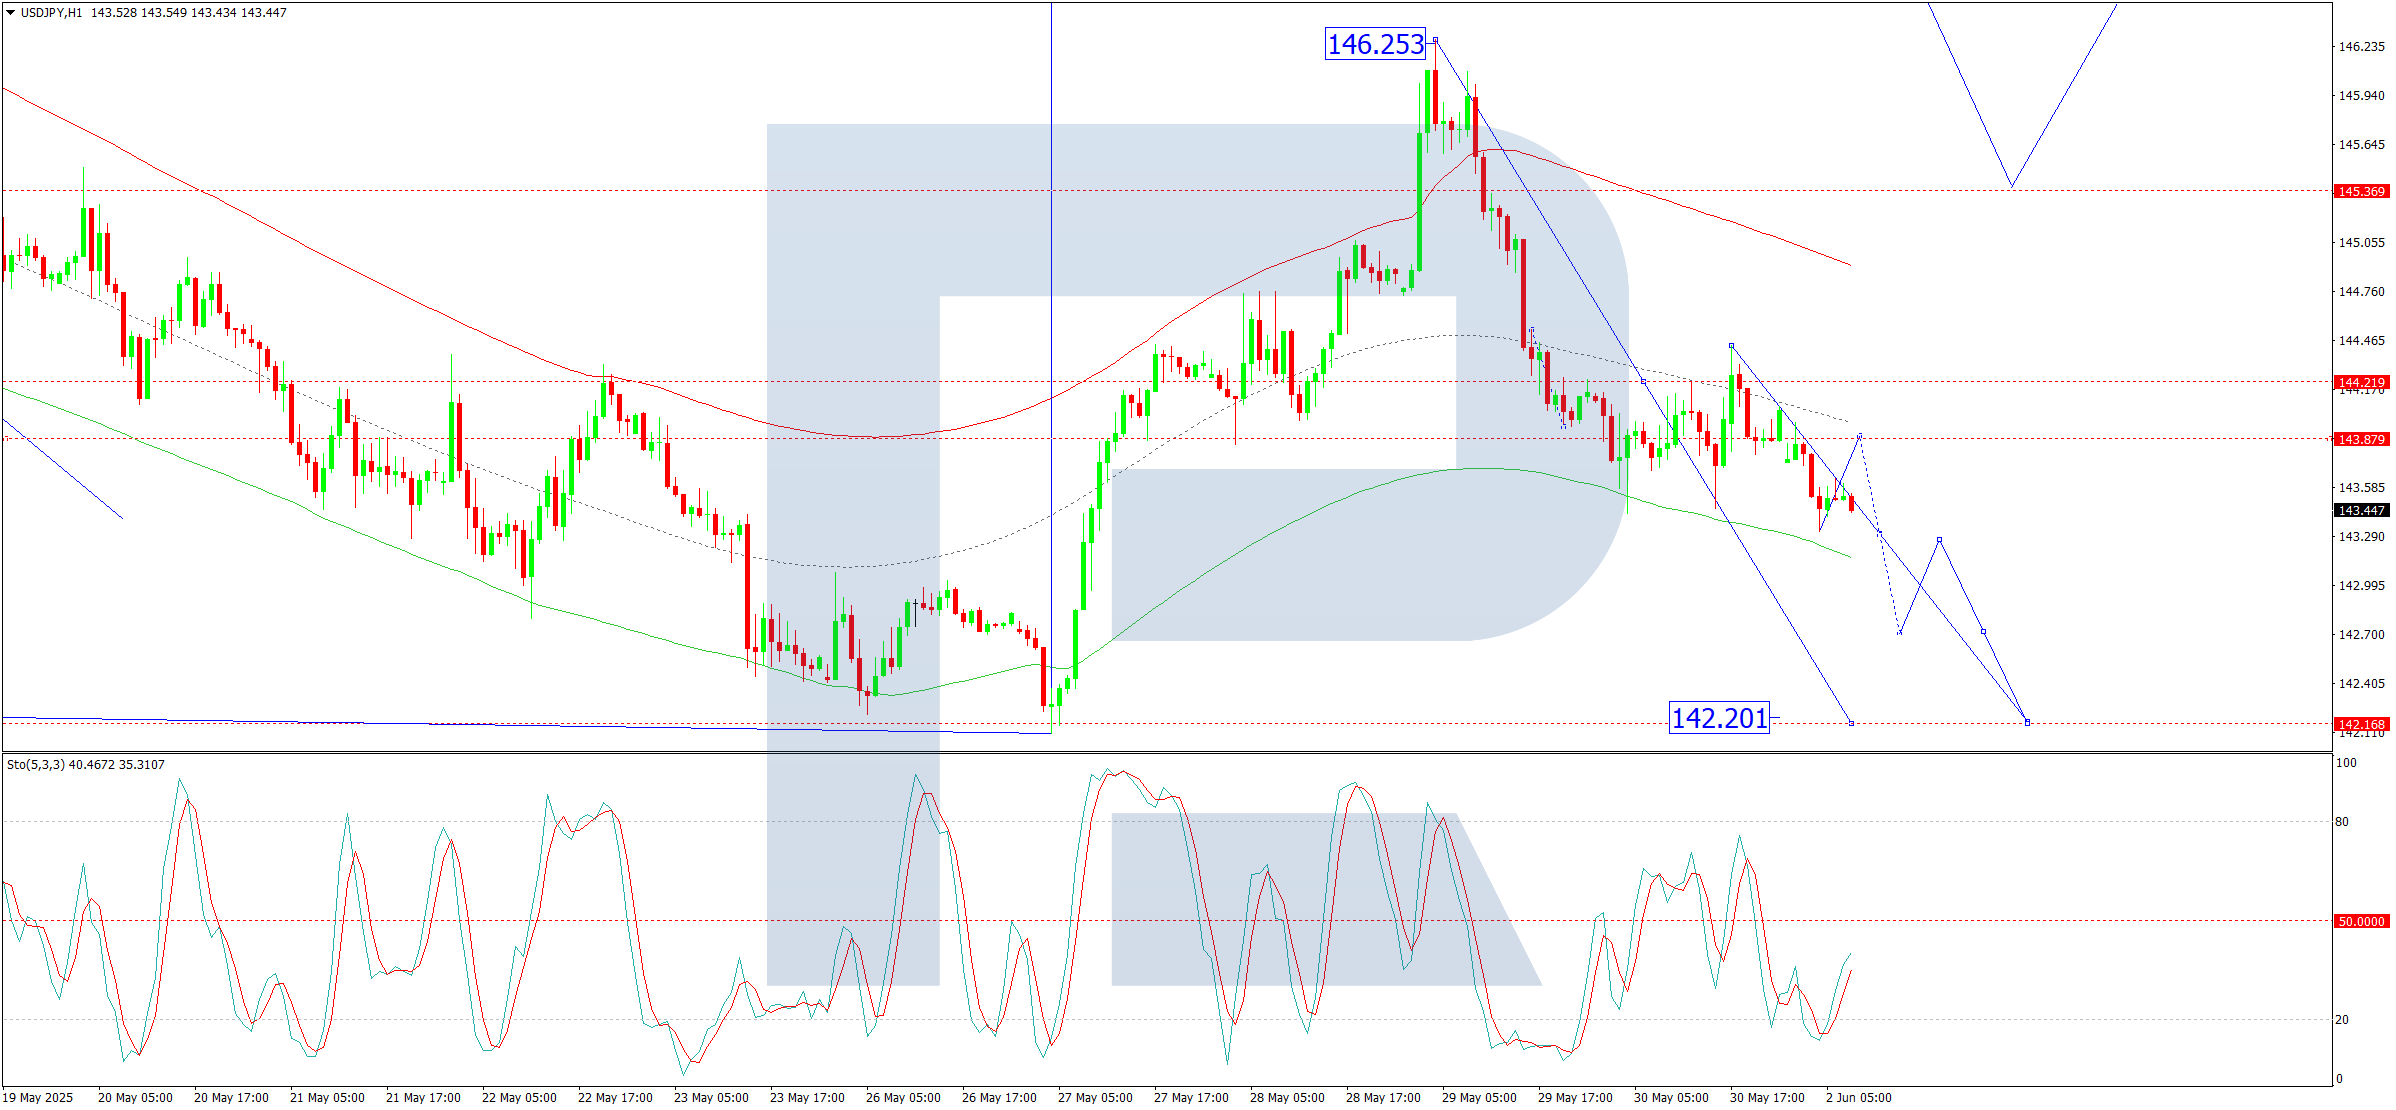
On the H1 chart, the pair is forming the fifth wave of the current downtrend, targeting 142.20. A temporary rebound to 143.88 is expected today, followed by a continuation of the decline to 142.70, with the potential for further movement down to 142.20. The Stochastic oscillator supports this outlook, with its signal line rising above 20 towards 50, suggesting a brief corrective move before further downside.
Conclusion
The USD/JPY pair remains under pressure due to heightened trade-related risk and growing demand for safe-haven assets such as the Japanese yen. Technically, the pair is poised for further decline, with 142.20 as the next key target. While a short-lived rebound may occur, broader sentiment continues to favour yen strength as long as global trade concerns persist.
Disclaimer
Any forecasts contained herein are based on the author’s particular opinion. This analysis may not be treated as trading advice. RoboForex bears no responsibility for trading results based on trading recommendations and reviews contained herein.
At the end of Thursday, the Dow Jones Index (US30) rose by 0.28%. The S&P 500 (US500) added 0.40%. The Nasdaq (US100) closed higher at 0.21%. Market growth was held back by ongoing legal battles over President Donald Trump’s tariffs. A federal court initially blocked most of the tariffs, ruling that they were imposed illegally, but on Thursday afternoon, a US appeals court reinstated them, creating uncertainty about trade policy. Weak data reinforced expectations of multiple Fed rate cuts this year. In the first quarter of 2025, the US economy contracted by 0.2% on an annualized basis, which was slightly better than the initial estimate of a 0.3% decline, but still marked the first quarterly contraction in GDP in three years.
European stock markets were mostly lower on Thursday. The German DAX (DE40) fell by 0.44%, the French CAC 40 (FR40) closed down 0.11%, the Spanish IBEX35 (ES35) rose by 0.11%, and the British FTSE 100 (UK100) closed lower at 0.11%. Initial optimism following the US Court of International Trade’s ruling that President Donald Trump had exceeded his authority in imposing retaliatory tariffs and ordering the administration to stop collecting them faded as investors weighed the possibility that the administration would use alternative legal avenues to maintain its trade policy.
WTI crude oil prices fell to $60.7 per barrel on Thursday under pressure from weak US economic data and concerns about rising global supply. A report from the US showed that the economy contracted in early 2025, raising concerns about slowing fuel demand. At the same time, Kazakhstan said that OPEC+ is likely to increase production at its meeting on Saturday, although the size of the increase has not yet been determined. The head of the International Energy Agency said that oil consumption in China remains weak, exacerbating concerns about demand. On the supply side, US crude oil inventories unexpectedly fell by 2.8 million barrels last week.
Asian markets were mostly higher yesterday. Japan’s Nikkei 225 (JP225) rose by 1. 88%, China’s FTSE China A50 (CHA50) added 0.06%, Hong Kong’s Hang Seng (HK50) increased by 1.35%, and Australia’s ASX 200 (AU200) showed a positive result of 0.15%. The Hang Seng Index is showing steady monthly growth of around 5%, recovering from sharp losses in the previous period. The recovery was aided by strong GDP data for the first quarter, a 90-day tariff pause between the US and China, high IPO activity, and a resurgence in tourism.
In Australia, retail sales unexpectedly fell by 0.1% month-on-month in April, reversing the 0.3% growth in March, which was also in line with the consensus expectations. In addition, building permit data was also unexpectedly low, heightening concerns about a weakening economic outlook. The data reinforced expectations that the Reserve Bank of Australia will maintain its easing bias after cutting rates by 25 basis points last week.
According to Reserve Bank Deputy Governor Karen Silk, interest rates in New Zealand are now in a neutral range of 2.5-3.5%, and further changes will depend on economic developments, as past rate cuts have not yet fully taken effect. She also noted that uncertainty in global trade remains high, but expects the economy to recover, supported by previously adopted easing measures that may offset some risks. The Reserve Bank of New Zealand (RBNZ) cut rates by 25 basis points to 3.25% at its May meeting, signaling that the easing cycle may be coming to an end after cutting rates by 225 basis points since August.
S&P 500 (US500) 5,912.17 +23.62 (+0.40%)
Dow Jones (US30) 42,215.73 +117.03 (+0.28%)
DAX (DE40) 23,933.23 −104.96 (−0.44%)
FTSE 100 (UK100) 8,716.45 −9.56 (−0.11%)
USD Index 99.33 −0.54 (−0.54%)
News feed for: 2025.05.30
Japan Tokyo Core CPI (m/m) at 02:30 (GMT+3);
Japan Unemployment Rate (m/m) at 02:30 (GMT+3);ʼ
Japan Retail Sales (m/m) at 02:50 (GMT+3);
Japan Industrial Production (m/m) at 02:50 (GMT+3);
Australia Retail Sales (m/m) at 04:30 (GMT+3);
German Retail Sales (m/m) at 09:00 (GMT+3);
Switzerland KOF Leading Indicators (m/m) at 10:00 (GMT+3);
German Inflation Rate (m/m) at 15:00 (GMT+3);
Canada GDP (m/m) at 15:30 (GMT+3);
US Core PCE Index (m/m) at 15:30 (GMT+3);
US Chicago PMI (m/m) at 16:45 (GMT+3);
US Revised UoM Inflation Expectations (m/m) at 17:00 (GMT+3);
This article reflects a personal opinion and should not be interpreted as an investment advice, and/or offer, and/or a persistent request for carrying out financial transactions, and/or a guarantee, and/or a forecast of future events.
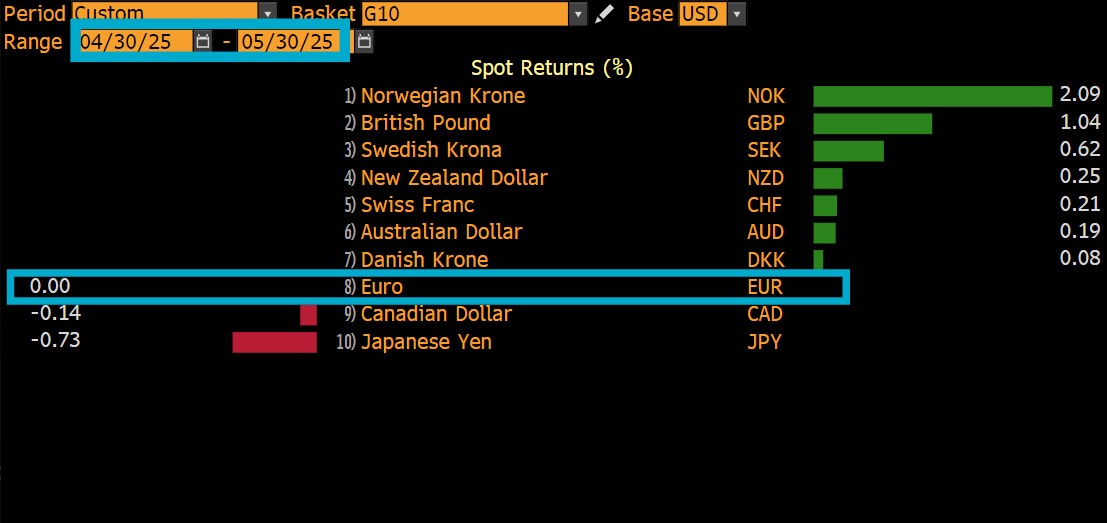
EURUSD set to end May unchanged; mostly kept to 1.11 – 1.14 range this month
June 3: Eurozone inflation (CPI) expected to slow in May
June 5: European Central Bank set to cut rates again, signal future cuts
June 6: US jobs report may add to US risks – fiscal deficit, tariff rollout, etc.
Bloomberg model: 74% chance EURUSD trades between 1.118 – 1.149 next week
The euro is flat against the US dollar this month.
At the time of writing, EURUSD is right back where it began May 2025, with just hours remaining in the last trading day of the month (though the US PCE data is still due prior to the weekend).
The euro has clearly lagged behind its G10 peers’ performance against the USD:
(IMPORTANT: The data below was generated before the US PCE data is released)
Imagen
FX markets still gripped by Trump policies
As we enter the first week of June, of course markets remain watchful over:
US fiscal deficit
The Senate is set to have their take on the tax and spending legislation, which had already been passed by the House, and stoked fears of a widening fiscal deficit (US government spending more than it earns from taxes)
US tariff policies President Trump’s on-then-off tariff rollout, along with the shifting percentage numbers, have rocked markets.
Although the shock-and-awe from these tariff-related developments have waned of late, they still warrant constant vigilance.
The above-listed factors will be a common theme during a week that features all these economic events:
Monday, June 2
SGD: Singapore May PMI
US30 index: US May ISM manufacturing
USDInd: Speeches by Fed Chair Jerome Powell, Fed Governor Christopher Waller, Dallas Fed President Lorie Logan, Chicago Fed President Austan Goolsbee
NAS100 index: US Senate to hash out Trump’s tax and spending bill this week?
Tuesday, June 3
AUD: RBA meeting minutes; Australia 1Q current account balance
CN50 index: China May manufacturing PMI
EU50 index: Eurozone May CPI; April unemployment rate
US400 index: US April JOLTS job openings, factory orders
USDInd: Chicago Fed President Austan Goolsbee, Dallas Fed President Lorie Logan speech
Wednesday, June 4
AU200 index: Australia 1Q GDP
SG20 index: Singapore May PMI
CAD: Bank of Canada rate decision
USDInd: Speeches by Atlanta Fed President Raphael Bostic and Fed Governor Lisa Cook
Thursday, June 5
AUD: Australia April trade balance
CHINAH index: China May services, composite PMI
TWN index: Taiwan May CPI, PPI
EU50 index: Eurozone April PPI; Germany April factory orders
EUR: ECB rate decision
US30 index: US weekly initial jobless claims
USDInd: Fed Governor Adriana Kugler, Philadelphia Fed President Patrick Harker speech
Friday, June 6
EU50 index: Eurozone April retail sales; 1Q GDP and employment (final)
EUR: Germany April industrial production, trade balance
CAD: Canada May unemployment
US500 index: US May nonfarm payrolls
3 scheduled events that could rock EURUSD
For EURUSD in particular, these scheduled events could have a major say on whether the world’s most-traded FX pair could get a catch-up boost:
1) Tuesday, June 3: Eurozone May consumer price index (CPI)
Economists predict that Eurozone inflation eased lower in May:
CPI year-on-year (May 2025 vs. May 2024): 2% If so, that would lower than April’s 2.2% y/y print
CPI month-on-month (May 2025 vs. April 2025): 0% Unchanged from April
Core CPI year-on-year (excluding energy, food, alcohol, tobacco prices): 2.4% If so, that would lower than April’s core 2.7% y/y print
Slower-than-expected inflation, closer to the ECB’s 2% target, should pave the way for more rate cuts. Such prospects could keep the euro on the backfoot.
However, a surprise uptick in the CPI figures may boost EURUSD.
EURUSD is expected to react with a 0.44% climb or a 0.25% drop in the 6 hours after this CPI release.
2) Thursday, June 5th: European Central Bank (ECB) rate decision
The ECB is widely expected to again lower its rates by a further 25-basis points – anything else would be a shocker.
More importantly, forward-looking traders and investors are eager to get more clues about the timing of the next ECB rate cut.
Markets currently predict that, after the June policy meeting, there’s a 78% chance that the ECB will cut rates again in September – the final cut for 2025.
EURUSD could get a lift if the ECB pushes back against such forecasts, setting the bar higher for future rate cuts.
However, if the ECB next week opens the door wide open and hints at more-than-one cut (after next week) by end-2025, that could soften the euro.
EURUSD could move 0.36% up or 0.23% down in the 6 hours after ECB’s rate decision.
3) Friday, June 6th: US May nonfarm payrolls (NFP)
Here are what economists predict for this always-pivotal monthly jobs report out of the world’s largest economy:
May headline NFP number: 130,000 If so, that would be lower than the 177k new jobs added in April
May unemployment rate: 4.2% Unchanged from April
The US dollar could weaken/EURUSD could rise on a weaker-than-expected US jobs report (fewer-jobs added/higher unemployment) that makes for a more challenging economic outlook.
However, a still-robust US labour market could strengthen the buck and drag EURUSD lower.
EURUSD could move 0.27% up or 0.8% down in the 6 hours after this US NFP release.
Imagen
Potential Scenarios
According to the Bloomberg FX forecast model …
EURUSD is likely (74% chance) to trade between 1.118 – 1.149 next week.
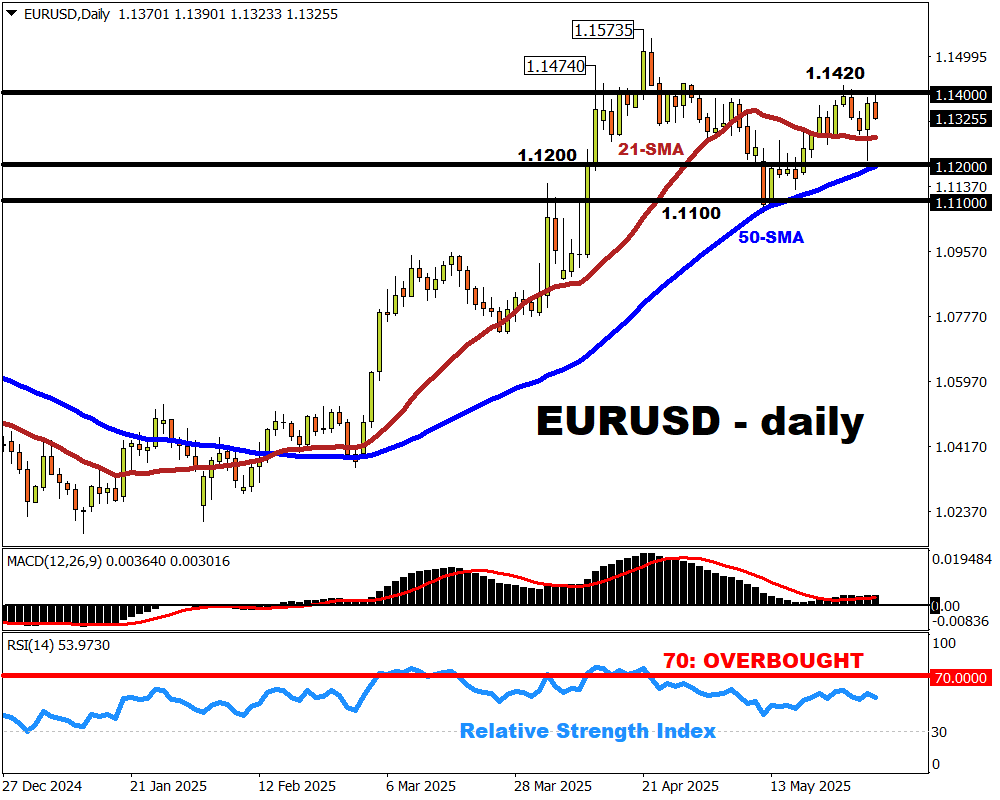
BULLISH: If EURUSD can break above the stubborn resistance around 1.1420, then bulls can set their sights on the 1.1490 region – the upper bound of Bloomberg’s FX forecasted range.
A major bout of US dollar weakness may encourage EURUSD bulls (those hoping prices will go higher) to revisit the 1.157 peak in April – also the highest levels since November 2021.
BEARISH: A daily close below its 21-day simple moving average (SMA) – a critical support in recent days – may see EURUSD re-testing support around the 1.1200/50-day SMA.
The price of gold fell below 3,300 USD per troy ounce on Friday, closing the week with a loss of approximately 1%.
Key drivers behind gold’s movement
Investors remain cautious ahead of today’s US PCE inflation report, which could offer fresh clues on potential Federal Reserve rate adjustments.
On Thursday, gold prices gained nearly 1% after an appeals court temporarily upheld tariffs imposed during Donald Trump’s presidency. This followed a ruling by a US trade court a day earlier, which had blocked the tariffs, deeming their implementation unlawful.
San Francisco Fed President Mary Daly reiterated that the Fed could still deliver two rate cuts this year, as projected in March. However, she emphasised that rates must hold steady for now to achieve the 2% inflation target.
Gold faced volatility in May as global risk sentiment improved, reducing demand for safe-haven assets. Hopes of a resolution in US trade disputes spurred investors back into equity markets.
Technical analysis: XAU/USD
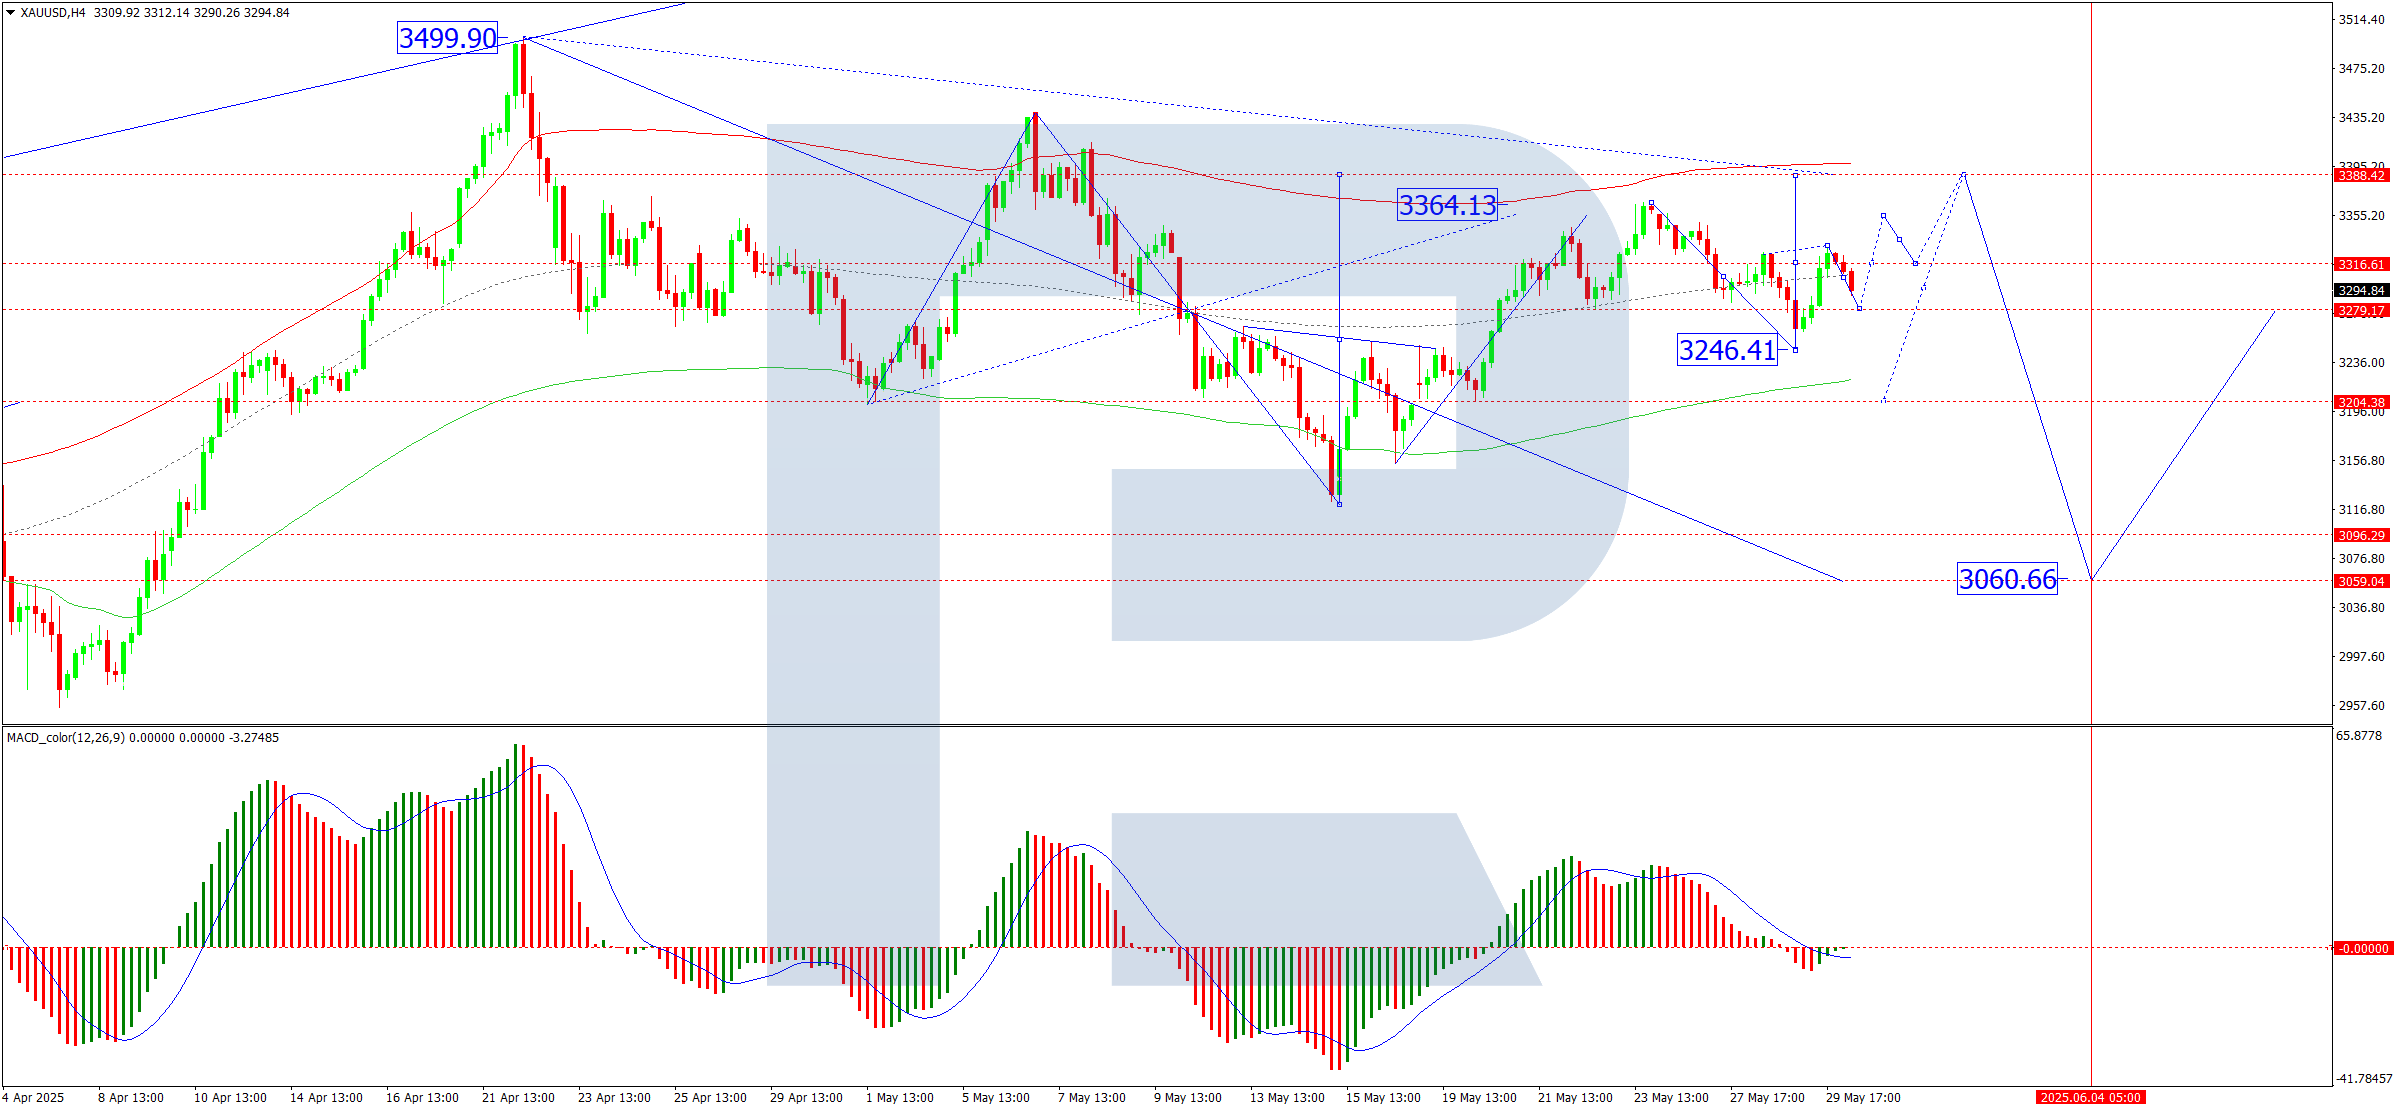
H4 Chart:
The market completed a correction wave to 3,246, followed by an upward impulse to 3,331
Currently, a downward pullback towards 3,280 is forming, with consolidation around 3,320
A downside breakout could extend losses to 3,200, while an upside breakout may fuel a rally towards 3,388, exhausting the bullish wave
A subsequent downtrend towards 3,060 is anticipated
MACD confirmation: The signal line has exited the histogram zone, indicating a firm upward trend
H1 Chart:
The upward wave to 3,331 has concluded, with a correction to at least 3,255 expected today
Thereafter, another upswing towards 3,355 (potentially extending to 3,388) may follow, although this is viewed as a corrective pullback within the broader downtrend
Once complete, a new decline towards 3,222 (possibly 3,060) is likely
The stochastic indicator supports this view: The signal line is below 20, rising sharply towards 80
Conclusion
Gold’s near-term direction hinges on breakouts from the current range, with technical indicators suggesting further volatility ahead.
Disclaimer
Any forecasts contained herein are based on the author’s particular opinion. This analysis may not be treated as trading advice. RoboForex bears no responsibility for trading results based on trading recommendations and reviews contained herein.
Newsletter writer Stewart Thomson addresses the question: Should investors own junior gold stocks, junior silver stocks, or junior uranium stocks?
With the U.S. government’s new and righteous backing of nuclear energy (fission for now and ultimately fusion), gold and silver stock enthusiasts may wonder if they should be adding some yellowcake stocks to their portfolios.
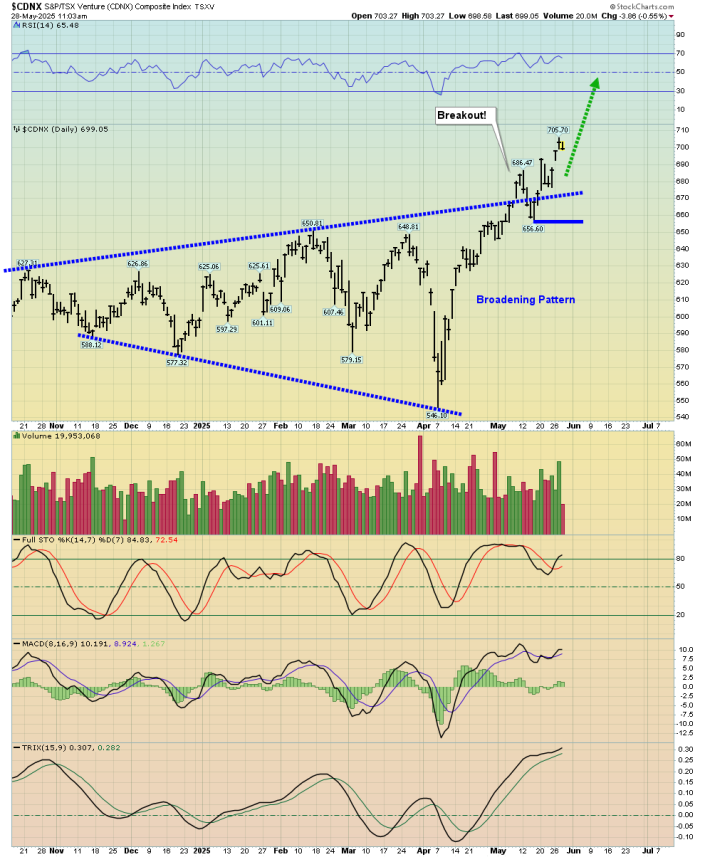
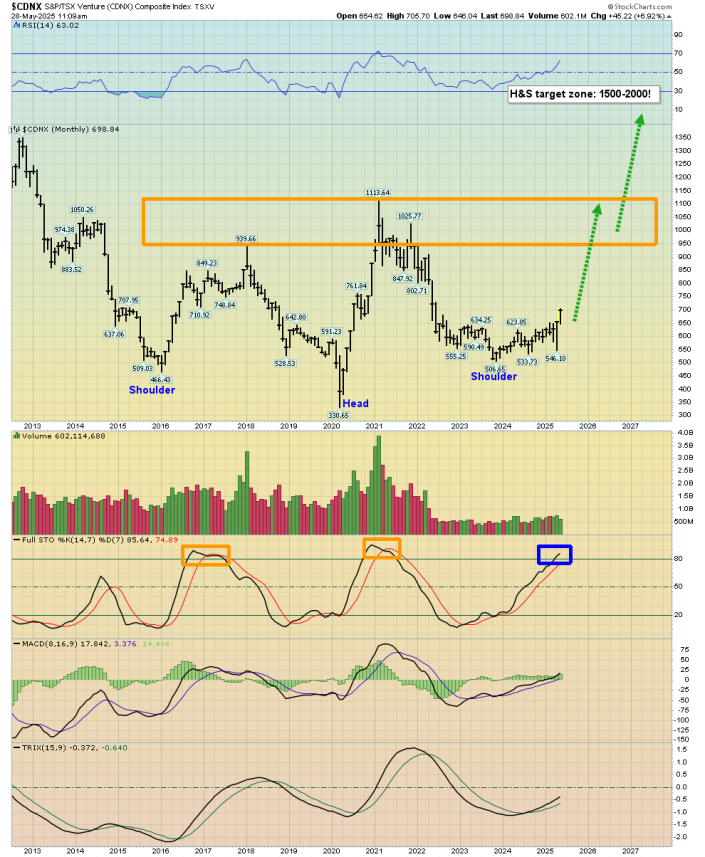
First, a bit of background on the CDNX venture market, where most of the world’s junior resource stocks trade. There’s no ETF (one was tried back around the year 2006, but it failed), so investors need to focus on the individual companies.
Here’s a look at the daily chart:
A significant breakout from a broadening pattern is in play and the target is a nice one, at 900. The long-term monthly chart is even more stunning, and here it is:
The target of this massive H&S pattern is at least 1500 and as high as round number 2000. Given the amount of time that has gone into it, it’s reasonable to expect the CDNX to reach much higher prices, even, perhaps, an all-time high.
Note the key Stochastics oscillator at the bottom of the chart. During regular rallies, an overbought situation is an amber light for investors.
In contrast, when the price is rallying towards a key breakout point, overbought Stochastics adds weight to the upside scenario.
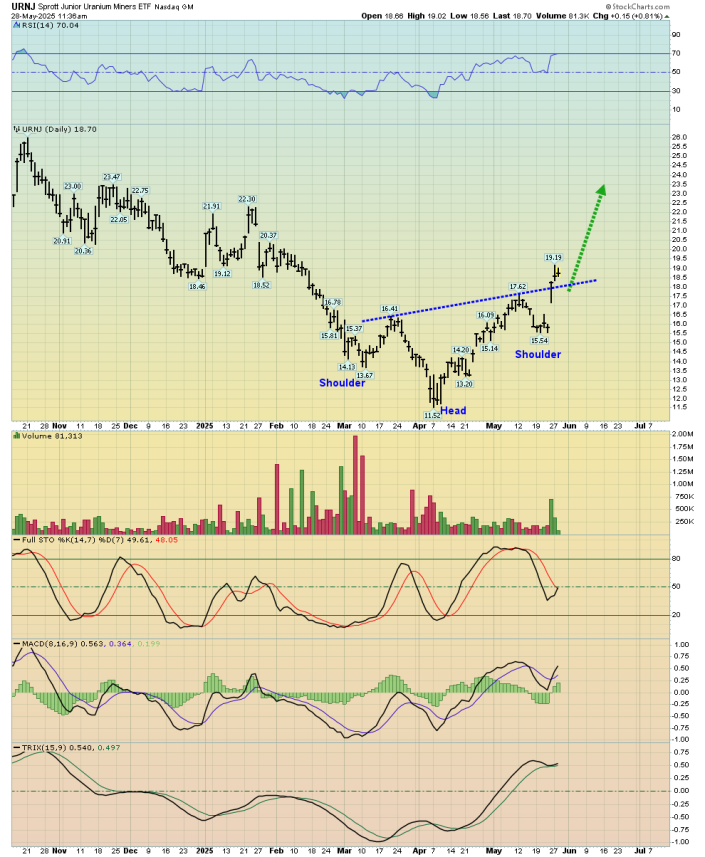
When it comes to yellowcake (uranium) stocks, it’s difficult to find ones with a lot of liquidity on the CDNX. Most of them are on the bigger TSX. The good news is that there are many juniors there too.
Here’s a look at Sprott’s URNJ junior uranium stocks ETF chart:
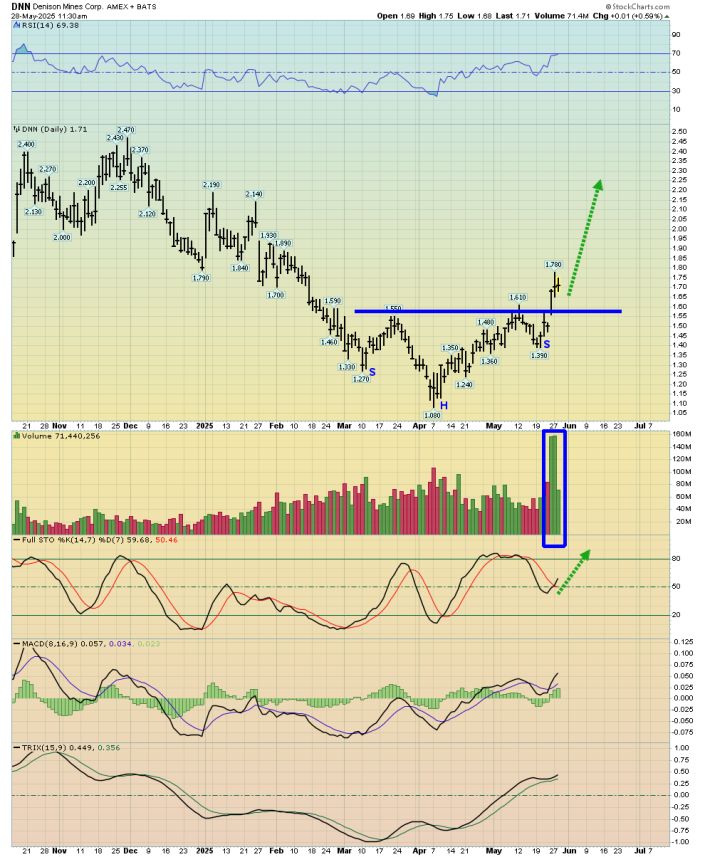
Investors who are new to the uranium sector should consider starting with the ETF and adding individual stocks from there. Denison Mines Corp. (DML:TSX; DNN:NYSE.MKT) is an experienced uranium player, with a stock price junior investors will like.
Here’s the chart:
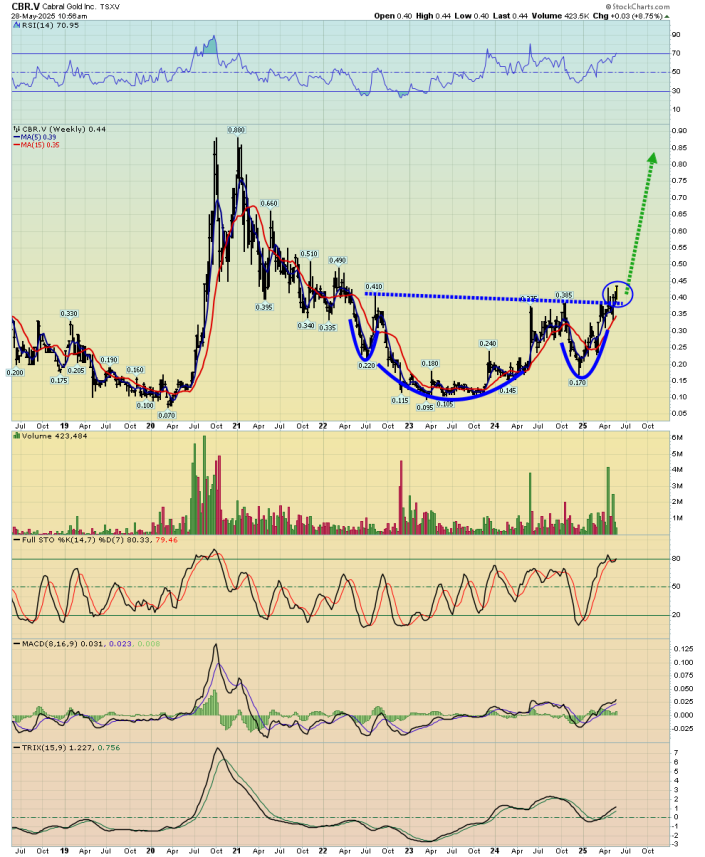
Most of the junior uranium stocks look poised for 50%-100% gains. For gold, an interesting play is Cabral Gold Inc. (CBR:TSX.V; CBGZF:OTCMKTS).
Here’s a look at the bio for the company’s no-nonsense president:
The good news is that the chart looks as enticing as the robust management team indicates it could be:
It looks like Michelangelo sculpted it!
The target is at least the highs near 80 cents, and the breakout looks solid.
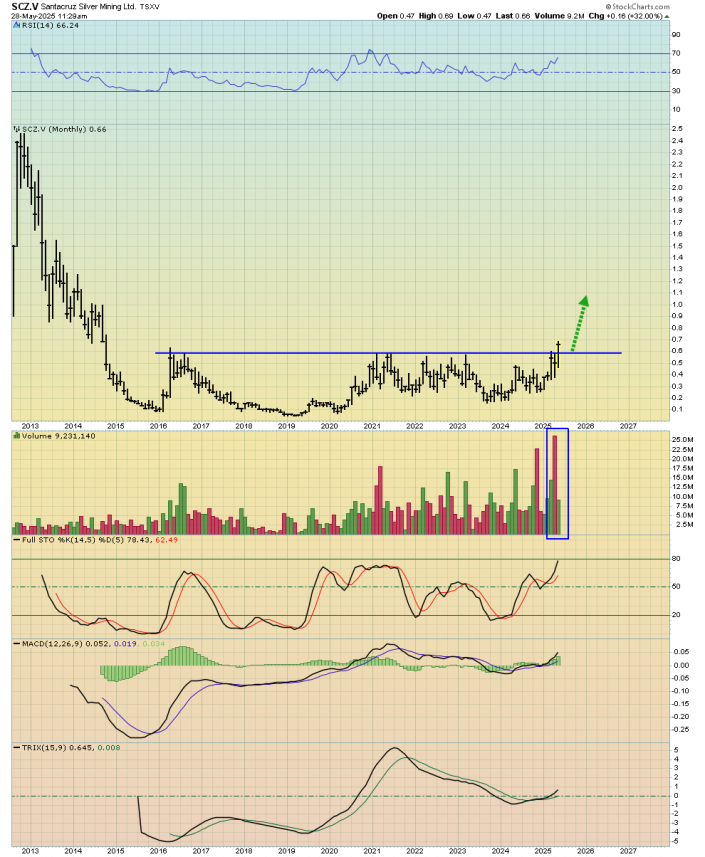
Silver?
Well, here’s my take on Santacruz Silver Mining Ltd. (SCZ:TSX.V; SCZMF:OTC; 1SZ:FSE):
If I had to pick just one CDNX silver stock to buy right now, well, I couldn’t.
There are many of them leaping up from massive base patterns and that’s just one of many reasons the CDNX index charts look so fantastic!
Special Offer for Streetwise Readers: Please send me an Email to [email protected] and I’ll send you my free “CNDX Ten Baggers: The Time To Buy Is Now!” report. I highlight stocks with breakout gaps, big volume, solid projects, great management, and rock-solid investor tactics to play the action!
I write my junior resource stocks newsletter about twice a week, and at just $199/12mths it’s an investor favourite. I’m doing a special pricing this week of $169 for 14mths. Click this link or send me an email if you want the offer and I’ll get you onboard. Thank-you.
Important Disclosures:
Stewart Thomson: I, or members of my immediate household or family, own securities of: None. My company has a financial relationship with: None. My company has purchased stocks mentioned in this article for my management clients: None. I determined which companies would be included in this article based on my research and understanding of the sector.
Statements and opinions expressed are the opinions of the author and not of Streetwise Reports, Street Smart, or their officers. The author is wholly responsible for the accuracy of the statements. Streetwise Reports was not paid by the author to publish or syndicate this article. Streetwise Reports requires contributing authors to disclose any shareholdings in, or economic relationships with, companies that they write about. Any disclosures from the author can be found below. Streetwise Reports relies upon the authors to accurately provide this information and Streetwise Reports has no means of verifying its accuracy.
This article does not constitute investment advice and is not a solicitation for any investment. Streetwise Reports does not render general or specific investment advice and the information on Streetwise Reports should not be considered a recommendation to buy or sell any security. Each reader is encouraged to consult with his or her personal financial adviser and perform their own comprehensive investment research. By opening this page, each reader accepts and agrees to Streetwise Reports’ terms of use and full legal disclaimer. Streetwise Reports does not endorse or recommend the business, products, services or securities of any company.
Stewart Thomson is no longer an investment advisor. The information provided by Stewart and Graceland Updates is for general information purposes only. Before taking any action on any investment, it is imperative that you consult with multiple properly licensed, experienced and qualified investment advisors and get numerous opinions before taking any action. Your minimum risk on any investment in the world is: 100% loss of all your money. You may be taking or preparing to take leveraged positions in investments and not know it, exposing yourself to unlimited risks. This is highly concerning if you are an investor in any derivatives products. There is an approx $700 trillion OTC Derivatives Iceberg with a tiny portion written off officially. The bottom line:
Curious Kids is a series for children of all ages. If you have a question you’d like an expert to answer, send it to [email protected].
Is it possible to upload the consciousness of your mind into a computer? – Amreen, age 15, New Delhi, India
The concept, cool yet maybe a little creepy, is known as mind uploading. Think of it as a way to create a copy of your brain, a transmission of your mind and consciousness into a computer. There you would live digitally, perhaps forever. You’d have an awareness of yourself, you’d retain your memories and still feel like you. But you wouldn’t have a body.
Within that simulated environment, you could do anything you do in real life – eating, driving a car, playing sports. You could also do things impossible in the real world, like walking through walls, flying like a bird or traveling to other planets. The only limit is what science can realistically simulate.
Yet science has a track record of turning theoretical possibilities into reality. Just because a concept seems terribly, unimaginably difficult doesn’t mean it’s impossible. Consider that science took humankind to the Moon, sequenced the human genome and eradicated smallpox. Those things too were once considered unlikely.
One requirement: The uploaded brain needs the same inputs it always had. In other words, the external world must be available to it. Even cloistered inside a computer, you would still need a simulation of your senses, a reproduction of the ability to see, hear, smell, touch, feel – as well as move, blink, detect your heart rate, set your circadian rhythm and do thousands of other things.
But why is that? Couldn’t you just exist in a pure mental bubble, inside the computer without sensory input?
Depriving people of their senses, like putting them in total darkness, or in a room without sound, is known as sensory deprivation, and it’s regarded as a form of torture. People who have trouble sensing their bodily signals – thirst, hunger, pain, an itch – often have mental health challenges.
That’s why for mind uploading to work, the simulation of your senses and the digital environment you’re in must be exceptionally accurate. Even minor distortions could have serious mental consequences.
For now, researchers don’t have the computing power, much less the scientific knowledge, to perform such simulations.
New and updated scanning technology is a necessity.
Scanning billions of pinheads
The first task for a successful mind upload: Scanning, then mapping the complete 3D structure of the human brain. This requires the equivalent of an extraordinarily sophisticated MRI machine that could detail the brain in an advanced way. At the moment, scientists are only at the very early stages of brain mapping – which includes the entire brain of a fly and tiny portions of a mouse brain.
In a few decades, a complete map of the human brain may be possible. Yet even capturing the identities of all 86 billion neurons, all smaller than a pinhead, plus their trillions of connections, still isn’t enough. Uploading this information by itself into a computer won’t accomplish much. That’s because each neuron constantly adjusts its functioning, and that has to be modeled, too.
It’s hard to know how many levels down researchers must go to make the simulated brain work. Is it enough to stop at the molecular level? Right now, no one knows.
Technological immortality comes with significant ethical concerns.
2045? 2145? Or later?
Knowing how the brain computes things might provide a shortcut. That would let researchers simulate only the essential parts of the brain, and not all biological idiosyncrasies. It’s easier to manufacture a new car knowing how a car works, compared to attempting to scan and replicate an existing car without any knowledge of its inner workings.
However, this approach requires that scientists figure out how the brain creates thoughts – how collections of thousands to millions of neurons come together to perform the computations that make the human mind come alive. It’s hard to express how very far we are from this.
Here’s another way: Replace the 86 billion real neurons with artificial ones, one at a time. That approach would make mind uploading much easier. Right now, though, scientists can’t replace even a single real neuron with an artificial one.
But keep in mind the pace of technology is accelerating exponentially. It’s reasonable to expect spectacular improvements in computing power and artificial intelligence in the coming decades.
One other thing is certain: Mind uploading will certainly have no problem finding funding. Many billionaires appear glad to part with lots of their money for a shot at living forever.
Although the challenges are enormous and the path forward uncertain, I believe that one day, mind uploading will be a reality. The most optimistic forecasts pinpoint the year 2045, only 20 years from now. Others say the end of this century.
But in my mind, both of these predictions are probably too optimistic. I would be shocked if mind uploading works in the next 100 years. But it might happen in 200 – which means the first person to live forever could be born in your lifetime.
Hello, curious kids! Do you have a question you’d like an expert to answer? Ask an adult to send your question to [email protected]. Please tell us your name, age and the city where you live.
And since curiosity has no age limit – adults, let us know what you’re wondering, too. We won’t be able to answer every question, but we will do our best.