At the resistance level, gold has formed a Shooting Star reversal pattern. The pair is currently going by the pattern in a descending wave. The goal of the correction might be 1915.00. Upon testing the support level, the pair may bounce off it and continue the uptrend. However, the quotes may grow to 1945.00 without testing the support level.
NZDUSD, “New Zealand Dollar vs US Dollar”
On H4, at the support level, the pair has formed a Hammer reversal pattern. Currently, the pair is going by the signal in an ascending wave. The goal of the growth might be 0.6485. After this resistance level is broken away, the quotes might get a chance to continue the uptrend. However, the price may pull back to 0.6370 before growth.
GBPUSD, “Great Britain Pound vs US Dollar”
On H4, at the resistance level, the pair has formed a Harami reversal pattern. The pair may now go by the signal in a descending wave. The goal of the correction might be the support level of 1.2310. However, the price may grow to 1.2500 and continue the uptrend without any pullback to the support level.
Attention! Forecasts presented in this section only reflect the author’s private opinion and should not be considered as guidance for trading. RoboForex LP bears no responsibility for trading results based on trading recommendations described in these analytical reviews.
The ECB is still determined to keep raising rates by 50 basis points in its next meetings. At the same time, there is a growing possibility that the ECB will cut its bond holdings faster. The ECB’s December monetary policy report showed that many policymakers were initially in favor of raising the ECB’s key interest rates by 75 basis points because inflation was expected to be too high. Given the latest Eurozone inflation data, analysts are leaning toward the ECB raising rates by 50 basis points in February and March and then another 25 basis points in May, after which Europe’s Central Bank will pause for a few months.
Trading recommendations
Support levels: 1.0780, 1.0710, 1.0650, 1.0597, 1.0535, 1.0497, 1.0480
Resistance levels: 1.0846, 1.0867
The trend on the EUR/USD currency pair on the hourly time frame is still bullish. The price is forming a price corridor and is trading at the level of the moving averages. The MACD indicator has become inactive, while signs of divergence persist. Under such market conditions, buy trades are best considered from the support level of 1.0780, with confirmation on intraday time frames in the form of a false breakout of the level. Sell deals can be considered from the resistance level of 1.0846, but better with confirmation in the form of a reverse initiative.
Alternative scenario: if the price breaks down through the support level of 1.0710 and fixes below it, the downtrend will likely resume.
News feed for 2023.01.20:
– US FOMC Member Williams Speaks at 01:35 (GMT+2).
– Eurozone ECB President Lagarde Speaks at 12:00 (GMT+2);
– US FOMC Member Harker Speaks at 16:00 (GMT+2);
– US Existing Home Sales (m/m) at 17:00 (GMT+2);
– US FOMC Member Waller Speaks at 20:00 (GMT+2).
The GBP/USD currency pair
Technical indicators of the currency pair:
Prev Open: 1.2345
Prev Close: 1.2390
% chg. over the last day: +0.36 %
Demand for the dollar is generally declining as markets begin to price in the scenario that the Federal Reserve is at the end of its tightening cycle, while the British pound and the euro still have “room” as the central banks in England and the ECB plan to continue raising interest rates. The economic situation in the UK is worse than in the Eurozone. The strong labor market is a positive factor for the Bank of England in the tightening cycle. But high inflation has left manufacturing activity, the service sector, and the real estate market already on the verge of recession. Economists expect the Bank of England to raise its key interest rate from 3.5% to 4% at its meeting in February.
Trading recommendations
Support levels: 1.2296, 1.2220, 1.2145, 1.2080, 1.2000, 1.1928, 1.1875, 1.1684
Resistance levels: 1.2383, 1.2446, 1.2519
From the technical point of view, the trend on the GBP/USD currency pair on the hourly time frame is bullish. The price is trading above the levels of the moving averages. The MACD indicator is in the positive zone, but the presence of divergence and the daily resistance is still limiting the further growth of quotes. Under such market conditions, it is better to look for buy trades on intraday time frames from the support level of 1.2296, but with confirmation. Sell trades are best sought from the resistance level of 1.2383 but also better with confirmation on the lower time frames.
Alternative scenario: if the price breaks down through the 1.2080 support level and fixes above it, the downtrend will likely resume.
News feed for 2023.01.20:
– UK Retail Sales (m/m) at 09:00 (GMT+2).
The USD/JPY currency pair
Technical indicators of the currency pair:
Prev Open: 128.88
Prev Close: 128.42
% chg. over the last day: -0.36 %
Japan’s nationwide core consumer price index rose from 3.7% to 4.0% in annual terms, a 41-year high. While well below the still exorbitant levels of inflation in the United States, the United Kingdom, and elsewhere, the figure is well above the Bank of Japan’s 2% inflation target. Rising inflation in Japan only adds to the likelihood that the central bank will reverse the policy to a tightening cycle in the spring.
From the technical point of view, the medium-term trend on the currency pair USD/JPY is still bearish. The price did not manage to consolidate above the priority level, but within the day, buying pressure will prevail. The MACD indicator is positive again. It is best to look for buy trades from the support level of 128.16, but only with confirmation on intraday time frames. Sell positions can be searched from the resistance level of 130.05, provided that there is a reverse reaction.
Alternative scenario: If the price fixes above the resistance level of 131.34, the uptrend will be renewed with a high probability.
News feed for 2023.01.20:
– Japan National Core Consumer Price Index at 01:30 (GMT+2).
The USD/CAD currency pair
Technical indicators of the currency pair:
Prev Open: 1.3485
Prev Close: 1.3466
% chg. over the last day: -0.14 %
The Canadian dollar is a commodity currency and is highly correlated with instruments such as the dollar index and oil prices. Oil prices increased about 1% on Thursday despite rising inventories. The main trigger for the rise is optimism about China’s opening. Oil demand in China is up nearly 1 million BPD from the previous month. The International Energy Agency said that global oil demand might reach a record high in 2023 as China lifts blockages and restrictions. Considering the current supply levels in the market, it will put upward pressure on oil prices, which will strengthen the Canadian dollar.
From the point of view of technical analysis, the trend on the USD/CAD currency pair is close to changing to a bullish one. The MACD indicator has become positive and buying pressure prevails during the day. Under such market conditions, sell transactions can be considered from the resistance level of 1.3513, but with additional confirmation in the form of a false breakout, as the level has already been tested. Buy deals should be considered from the support level of 1.3445 or 1.3396, but only with short targets and confirmation.
Alternative scenario: if the price breaks out and consolidates above the resistance level of 1.3513, the uptrend will likely resume.
This article reflects a personal opinion and should not be interpreted as an investment advice, and/or offer, and/or a persistent request for carrying out financial transactions, and/or a guarantee, and/or a forecast of future events.
The Canadian Dollar has the smallest year-to-date gain out of all G10 currencies against the US dollar.
Only the Norwegian Krone, another oil-linked currency, has had it worse so far in 2023, with a 0.86% percent year-to-date decline versus the greenback at the time of writing.
CAD traders will be paying close attention to the Bank of Canada’s rate decision due in the coming week, alongside these major economic data releases and events:
Monday, January 23
JPY: Bank of Japan December meeting minutes
EUR: Eurozone January consumer confidence; ECB President Christine Lagarde speech
Tuesday, January 24
AUD: Australia January PMIs, December business confidence
EUR: Eurozone January PMIs
GBP: UK January PMIs
USD: US January PMIs
Microsoft earnings
Wednesday, January 25
NZD: New Zealand 4Q CPI
AUD: Australia 4Q CPI
JPY: Bank of Japan to announce amount of outright purchases of government securities
EUR: Germany January IFO business climate
CAD: Bank of Canada rate decision
S&P 500: Earnings from Tesla, NextEra Energy, IBM
Thursday, January 26
USD: US 4Q GDP; weekly initial jobless claims
S&P 500: Earnings from Intel, American Airlines, Southwest Airlines, Mastercard, Visa
Friday, January 27
NZD: New Zealand January business confidence
JPY: Japan Tokyo CPI
USD: US December PCE deflator, personal income and spending; January consumer sentiment
The Bank of Canada (BoC) is expected to hike its benchmark rate by another 25 basis points (bps), with markets allocating a 74% chance of such an event occurring this Wednesday.
Alternative scenarios:
If the BoC surprises with a larger-than-expected 50bps hike, that could send the Canadian dollar soaring, which would drag USDCAD lower.
If the BoC surprises by pressing pause on its rate hikes, given that Canada’s inflation has been easing lower, that could pull the loonie lower while boosting USDCAD.
USDCAD: Key levels
RESISTANCE
1.35 area – where this pair’s 50-day and 100-day simple moving averages are currently converging alongside the 23.6% Fibonacci level from USDCAD’s runup between June 2021 – October 2022.
1.36 area – upper boundary of the downward slope from October’s high
1.37043 – mid-December high, though the path up to these levels could be choppy, given that it features varying price action throughout last month.
SUPPORT
1.332 – previous cycle low
1.322 – November low/38.2 Fibonacci level from USDCAD’s June 2021 – October 2022 runup
1.320 psychologically-important region – 200-day SMA/early-September cycle highs
At the time of writing, markets are giving a slight edge for a downside move rather than an upside move for USDCAD.
Here are some forecasts for the next one-week period (from levels at the time of writing):
39% chance that USDCAD may touch 1.332 previous cycle low for support
35% chance that USDCAD will touch 1.360 resistance at upper boundary of downtrend
USDCAD: Fundamental analysis
Next week’s BoC hike is expected to be the final such move in its policy tightening cycle.
The central bank’s rate hikes have already sent its overnight lending rate soaring by a cumulative 4 percentage points throughout all of last year, with this policy tightening campaign also featuring that gargantuan 100 basis point hike last July.
Why was the BoC been hiking rates so aggressively?
Those aggressive hikes were done to quell a near 40-year high in inflation back in the summer of 2022. Canada’s recent bout of red-hot inflation peaked at 8.1% in June, which marked its highest print since January 1983!
However, since then, the consumer price index (CPI) has cooled down to 6.3% year-on-year for December 2022. On a month-on-month basis (comparing the Dec’22 figure with that of Nov’22), the CPI actually fell by 0.6% – its biggest drop since April 2020, at the onset of the pandemic.
BoC forecasted to pause after January hike
Although CPI still remains far above the central bank’s 2% target, moderating inflation may soon bring the curtains down on the Bank of Canada’s rate-hike campaign.
And such dovish expectations have dampened the Canadian dollar’s performance, as cited at the top of this article.
After all, markets are forward-looking in nature. That means today’s prices for USDCAD are reflecting market expectations for what the respective central banks may or may not do in the future.
Also focus on the USD side of the USDCAD equation
The US dollar is set to continue reacting to expectations surrounding the US Federal Reserve’s own rate decision due February 1st, exactly one week after the BoC’s rate decision. As that keenly-awaited FOMC meeting looms closer, keep a close watch on:
PCE Deflator – the Fed’s preferred inflation gauge – due Friday.
If the December PCE deflator does not ease lower from November’s prints, pointing to stubborn inflation in the world’s largest economy, that could force the Fed to persist with a bigger rate hike than the mere 25bps liftoff currently priced in by the markets.
Other key US economic data due in the coming week: US GDP, weekly initial jobless claims, and consumer income/spending/sentiment.
Further signs of waning US economic growth momentum should weigh on the US Dollar, and drag USDCAD lower.
How do market expectations surrounding Fed vs. BoC impact USDCAD?
And as an oversimplified breakdown:
Fed to keep hiking rates while BoC slows down/pauses
= stronger US dollar + weaker Canadian dollar
= USDCAD to move higher
Bank of Canada to keep hiking rates while Fed slows down/pauses
= stronger Canadian dollar + weaker US dollar
= USDCAD to move lower
For added reference, here are two other markets that have a major bearing on USDCAD:
The difference in yields between US and Canadian 2-year bonds (Rising US vs. Canada spreads = weaker CAD = rising USDCAD; and vice versa)
The US stock indices continued their decline yesterday. Quarterly results fell short of estimates, with increasing negativity that the Federal Reserve will remain hawkish for a long time as the labor market shows little sign of easing. As the stock market closed yesterday, the Dow Jones Index (US30) decreased by 0.76%, and the S&P 500 Index (US500) fell by 0.76%. The NASDAQ Technology Index (US100) was down by 0.96% on Thursday.
About 190,000 people filed for unemployment claims in the US last week, well below economists’ forecast of 214,000. The strong labor market leaves the US Federal Reserve with room to raise rates further.
Fed spokeswoman Lael Brainard said Thursday that the Fed intends to stay the course on tightening monetary policy and will keep rates fairly restrictive for some time to ensure inflation returns to the Central Bank’s 2% target.
Netflix (NFLX) reported fourth-quarter results that fell short of net income expectations, but the number of new subscribers exceeded expectations. The company added 7.66 million subscribers, well above the 4.6 million expected. The company’s stock jumped by 7% after the report was released in the evening session.
Tesla (TSLA) decreased by 1% yesterday as investors worry that the electric carmaker’s quarterly results may not meet expectations amid slowing demand and production disruptions in China.
Norwegian Cruise Line (NCLH) shares are down more than 4%. The cruise company warned that it expects to report net losses for the quarter and a full year.
Stock markets in Europe were mostly down yesterday. Germany’s DAX (DE30) decreased by 1.72%, France’s CAC 40 (FR40) fell by 1.86%, Spain’s IBEX 35 Index (ES35) lost -1.60%, and the British FTSE 100 (UK100) closed down by 1.07%.
ECB head Christine Lagarde said yesterday that the labor market in Europe has never been as vibrant as it is now, and the economic outlook is much more positive. Given the latest Eurozone inflation data, analysts are leaning towards the ECB raising rates by 50 basis points in February and March and then by another 25 basis points in May, after which Europe’s central bank will take a pause for a few months.
Consumer sentiment in the UK has fallen to a nearly 50-year low. GfK research shows that fears about the economy and a sharp rise in the cost of living have added pressure to household finances. Energy bills and food prices have risen rapidly in recent months, eating away at households’ disposable income. Treasury Secretary Jeremy Hunt and Prime Minister Rishi Sunak cut a two-year household energy scheme that would have kept annual bills at £2,500.
The situation in Ukraine is heating up. According to foreign intelligence, Russia is preparing a new major offensive against Ukraine in the coming weeks. This is the reason the Western allies have become more active in providing weapons, including tanks. Today there will be an important meeting in Ramstein at the NATO base, where it will be decided how much and what weapons to give Ukraine to defend its territories. The front line has largely frozen over the past two months, and neither side has made much progress, despite heavy losses in positional fighting.
Oil prices rose about 1% on Thursday, even as inventories rose. The Energy Information Administration, or EIA, said in its weekly report that US crude inventories rose by 8.408 million barrels for the week. The main trigger for the rise is optimism about China’s opening. Oil demand in China is up nearly 1 million BPD from the previous month. The International Energy Agency said Wednesday that global oil demand could reach an all-time high in 2023 as China lifts blockages and restrictions.
Natural gas closed yesterday at June 2021 lows. A warm winter in Europe led to a sharp drop in gas consumption, which at current supply levels puts downward pressure on quotes. But the main weather forecast models, the Global Forecast System (GFS) and the European ECMWF model expect colder short-term temperature forecasts by the last week of January. This could cause a short-term rise in prices.
Asian markets traded yesterday without a single dynamic. Japan’s Nikkei 225 (JP225) decreased by 1.44% on Thursday, China’s FTSE China A50 (CHA50) added 0.15%, Hong Kong’s Hang Seng (HK50) ended the day down by 0.12%, India’s NIFTY 50 (IND50) fell by 0.32%, and Australia’s S&P/ASXv200v(AU200) ended the day up by 0.57%.
Japan’s nationwide core CPI rose from 3.7% to 4.0% year-over-year, a 41-year high. Rising inflation in Japan adds to the likelihood that the central bank will reverse the policy to tighten the cycle in the spring.
S&P 500 (F) (US500) 3,898.85 −30.01 (−0.76%)
Dow Jones (US30) 33,044.56 −252.40 (−0.76%)
DAX (DE40) 14,920.36 −261.44 (−1.72%)
FTSE 100 (UK100) 7,747.29 −83.41 (−1.07%)
USD Index 102.07 −0.29 (−0.29%)
Important events for today:
– Japan National Core Consumer Price Index at 01:30 (GMT+2);
– US FOMC Member Williams Speaks at 01:35 (GMT+2);
– UK Retail Sales (m/m) at 09:00 (GMT+2);
– World Economic Forum Annual Meetings at 10:00 (GMT+2);
– Switzerland SNB Chairman Jordan Speaks at 10:00 (GMT+2);
– Eurozone ECB President Lagarde Speaks at 12:00 (GMT+2);
This article reflects a personal opinion and should not be interpreted as an investment advice, and/or offer, and/or a persistent request for carrying out financial transactions, and/or a guarantee, and/or a forecast of future events.
I am a policy expert and analyst who studies how governmental investment in science, technology and innovation improves social welfare. While a country’s scientific prowess is somewhat difficult to quantify, I’d argue that the amount of money spent on scientific research, the number of scholarly papers published and the quality of those papers are good stand-in measures.
China is not the only nation to drastically improve its science capacity in recent years, but China’s rise has been particularly dramatic. This has left U.S. policy experts and government officials worried about how China’s scientific supremacy will shift the global balance of power. China’s recent ascendancy results from years of governmental policy aiming to be tops in science and technology. The country has taken explicit steps to get where it is today, and the U.S. now has a choice to make about how to respond to a scientifically competitive China.
Growth across decades
In 1977, Chinese leader Deng Xiaoping introduced the Four Modernizations, one of which was strengthening China’s science sector and technological progress. As recently as 2000, the U.S. produced many times the number of scientific papers as China annually. However, over the past three decades or so, China has invested funds to grow domestic research capabilities, to send students and researchers abroad to study, and to encourage Chinese businesses to shift to manufacturing high-tech products.
Since 2000, China has sent an estimated 5.2 million students and scholars to study abroad. The majority of them studied science or engineering. Many of these students remained where they studied, but an increasing number return to China to work in well-resourced laboratories and high-tech companies.
Thanks to all this investment and a growing, capable workforce, China’s scientific output – as measured by the number of total published papers – has increased steadily over the years. In 2017, Chinese scholars published more scientific papers than U.S. researchers for the first time.
Quantity does not necessarily mean quality though. For many years, researchers in the West wrote off Chinese research as low quality and often as simply imitating research from the U.S. and Europe. During the 2000s and 2010s, much of the work coming from China did not receive significant attention from the global scientific community.
But as China has continued to invest in science, I began to wonder whether the explosion in the quantity of research was accompanied by improving quality.
To quantify China’s scientific strength, my colleagues and I looked at citations. A citation is when an academic paper is referenced – or cited – by another paper. We considered that the more times a paper has been cited, the higher quality and more influential the work. Given that logic, the top 1% most cited papers should represent the upper echelon of high-quality science.
My colleagues and I counted how many papers published by a country were in the top 1% of science as measured by the number of citations in various disciplines. Going year by year from 2015 to 2019, we then compared different countries. We were surprised to find that in 2019, Chinese authors published a greater percentage of the most influential papers, with China claiming 8,422 articles in the top category, while the U.S had 7,959 and the European Union had 6,074. In just one recent example, we found that in 2022, Chinese researchers published three times as many papers on artificial intelligence as U.S. researchers; in the top 1% most cited AI research, Chinese papers outnumbered U.S. papers by a 2-to-1 ratio. Similar patterns can be seen with China leading in the top 1% most cited papers in nanoscience, chemistry and transportation.
Our research also found that Chinese research was surprisingly novel and creative – and not simply copying western researchers. To measure this, we looked at the mix of disciplines referenced in scientific papers. The more diverse and varied the referenced research was in a single paper, the more interdisciplinary and novel we considered the work. We found Chinese research to be as innovative as other top performing countries.
Taken together, these measures suggest that China is now no longer an imitator nor producer of only low-quality science. China is now a scientific power on par with the U.S. and Europe, both in quantity and in quality.
Fear or collaboration?
Scientific capability is intricately tied to both military and economic power. Because of this relationship, many in the U.S. – from politicians to policy experts – have expressed concern that China’s scientific rise is a threat to the U.S., and the government has taken steps to slow China’s growth. The recent Chips and Science Act of 2022 explicitly limits cooperation with China in some areas of research and manufacturing. In October 2022, the Biden administration put restrictions in place to limit China’s access to key technologies with military applications.
A number of scholars, including me, see these fears and policy responses as rooted in a nationalistic view that doesn’t wholly map onto the global endeavor of science.
Academic research in the modern world is in large part driven by the exchange of ideas and information. The results are published in publicly available journals that anyone can read. Science is also becoming ever more international and collaborative, with researchers around the world depending on each other to push their fields forward. Recent collaborative research on cancer, COVID-19 and agriculture are just a few of many examples. My own work has also shown that when researchers from China and the U.S. collaborate, they produce higher quality science than either one alone.
China has joined the ranks of top scientific and technological nations, and some of the concerns over shifts of power are reasonable in my view. But the U.S. can also benefit from China’s scientific rise. With many global issues facing the planet – like climate change, to name just one – there may be wisdom in looking at this new situation as not only a threat, but also an opportunity.
The US Producer Price Index (PPI) fell more than expected in December. This data shows the rate of inflation between factories and plants. The lower PPI puts more pressure on the Fed to slow the pace of interest rate hikes. But despite the easing of inflationary pressures, the US indices declined yesterday. At the close of the stock market yesterday, the Dow Jones Index (US30) decreased by 1.81%, and the S&P 500 Index (US500) fell by 1.56%. The NASDAQ Technology Index (US100) lost 1.24% on Wednesday.
The latest economic data indicates that December was a tough month for consumers. This is evidenced by retail sales data, which decreased by 1.1% from the previous month. Early in the fourth quarter reporting season, major US banks increased their cash reserves in anticipation of more credit losses due to the tough economy. On the one hand, lower inflation is boosting stocks as potentially softer economic conditions create a more favorable trading environment for companies. On the other hand, amid weak retail sales, a sharp drop in industrial production, and news of new layoffs, fears that the US may already be in a recession are growing. This is the third consecutive month of declining industrial activity, with the decline in production looking widespread. The chief economist at RSM US believes that the current trajectory of the economy suggests a “soft recession” in 2023.
Fed spokesman Bullard thinks a 0.5% point rate hike at the next meeting is appropriate, even though inflationary pressures in the US are declining. Another Fed official, Barkin, is of the same opinion. But others are in favor of a 0.25% rate hike at the February 1 meeting. A 0.25% hike in February is considered the most likely (92%) scenario today.
Shares of Microsoft Corporation (MSFT) fell by 1.9% after the company reported cutting 10,000 jobs and receiving a $1.2 billion fine. Moderna, Inc. (MRNA) shares rose by 3.3% after the maker of the COVID-19 vaccine said it was successful in a trial of its experimental vaccine against RSV (contagious respiratory virus) in older adults.
Stock markets in Europe traded without a single trend. German DAX (DE30) decreased by 0.03%, French CAC 40 (FR40) gained 0.09%, Spanish IBEX 35 (ES35) added 0.40%, and British FTSE 100 (UK100) closed yesterday down by 0.26%.
The UK inflation rate fell from 10.7% to 10.5% year-on-year. Core inflation (excluding food and energy prices) remained at 6.3%. The underlying factor behind the decline in inflation is the December decline in energy prices. Money markets are highly confident in favor of a 50 basis point gain at the Bank of England’s February meeting.
Oil prices retreated from Wednesday’s highs amid a Chinese economic opening as US industrial, and retail trade data failed to meet economists’ expectations.
Asian markets were mostly up yesterday. Japan’s Nikkei 225 (JP225) gained 2.5% on Wednesday, China’s FTSE China A50 (CHA50) decreased by 0.36%, Hong Kong’s Hang Seng (HK50) ended the day up by 0.47%, India’s NIFTY 50 (IND50) increased by 0.62%, and Australia’s S&P/ASX 200 (AU200) ended the day up by 0.10%.
Columbia University academic Takatoshi Ito, who is considered a candidate for governor of the Bank of Japan, said Thursday that higher-than-expected inflation could eventually push Japan’s central bank to extend the range of benchmark bond yields this year. It’s a step toward normalizing monetary policy. Japan’s consumer inflation data will be released this Friday and is expected to be 4%.
Australian labor market data indicates that the labor market is starting to cool off. Over the past month, the employment rate fell by 14.6k jobs, with an expected 58.3k growth. If this trend continues, it will give the Reserve Bank less economic room to raise interest rates.
S&P 500 (F) (US500) 3,928.86 −62.11 (−1.56%)
Dow Jones (US30) 33,296.96 −613.89 (−1.81%)
DAX (DE40) 15,181.80 −5.27 (−0.035%)
FTSE 100 (UK100) 7,830.70 −20.33 (−0.26%)
USD Index 102.40 +0.01 (+0.01%)
Important events for today:
– Australia Unemployment Rate (m/m) at 02:30 (GMT+2);
– World Economic Forum Annual Meetings at 10:00 (GMT+2);
– Eurozone ECB President Lagarde Speaks at 12:30 (GMT+2);
– Eurozone ECB Monetary Policy Meeting Accounts at 14:30 (GMT+2);
– US Building Permits (m/m) at 15:30 (GMT+2);
– US Initial Jobless Claims (w/w) at 15:30 (GMT+2);
– US Philadelphia Fed Manufacturing Index (m/m) at 15:30 (GMT+2);
– US Natural Gas Storage (w/w) at 17:30 (GMT+2);
– US Crude Oil Reserves (w/w) at 18:00 (GMT+2);
– US FOMC Member Brainard Speaks at 20:15 (GMT+2).
This article reflects a personal opinion and should not be interpreted as an investment advice, and/or offer, and/or a persistent request for carrying out financial transactions, and/or a guarantee, and/or a forecast of future events.
Concerns about an incoming economic slowdown have hit markets, while continued hawkish rhetoric by Fed speakers has added to negative risk sentiment.
Asian stocks have traded mixed with most major indices rangebound following the negative handover from Wall Street.
The dollar had a choppy session yesterday on the back of the BoJ meeting and softer data and is in the red to kick off this morning’s session.
Gold is trying to hold onto to recent highs and remains above $1900.
Weak US economic data spurred further speculation that inflation is peaking, and policymakers may be nearing the end of their hiking cycles.
US retail sales fell more than expected, industrial production declined and US PPI also slid more than forecast.
But while slowing inflation has been a positive for markets, worries about slowing economic growth have started to bite as well.
This did actually push the DXY to new cycle lows below 102 on more dovish Fed rate expectations, with the May lows also offering immediate support to the benchmark US dollar index, for now.
A further capitulation in dollar bulls could invite bears to push the DXY into sub-100 levels.
BoJ seen to bow to the inevitable
The yen has reversed nearly all its losses from yesterday’s spike higher in USD/JPY, even after the BoJ defied hawkish speculation yesterday that it would widen its yield curve control band further.
Policymakers are seen eventually changing or abandoning the YCC policy when Governor Kuroda steps down in April after he laid the groundwork in December with only the third change to the yield cap in seven years.
That window when he hands over the baton of the BoJ governing board may herald more extreme volatility in the yen.
USD/JPY has been at the forefront of the broad dollar decline since October.
Intervention helped near the highs just shy of 152. Easing US CPI prints, especially in November saw huge moves to the downside.
The upper part of the long-term descending channel, with its series of lower highs and lower lows, was nearly touched yesterday on the spike high after the BoJ meeting, only to be repelled by USDJPY’s 21-day simple moving average (SMA).
But the sharp about-turn looks strongly bearish with funds loading up on long yen positions in anticipation of more BoJ policy changes going forward.
Looking back on 2022, one of the biggest fears about oil was that prices would skyrocket even more than they did due to a disruption in supply from Russia.
Of course, Russia has been a major world supplier of oil, but after Russia invaded Ukraine, many global financial institutions refused to back transactions involving Russian oil.
So, back in March of 2022, we had this headline from a major financial website (CNBC, March 4):
Oil market heads for ‘biggest supply crisis in decades’ with Russia’s exports set to fall, IEA says
Conventional wisdom says that a disruption in supply, let alone the biggest in decades, would lead to soaring oil prices.
However, at the time that March headline published, NYMEX crude oil was trading around $115 a barrel — and prices have been in a downtrend for most of the time since, for almost a year now.
In December, even the New York Times had a hard time explaining the disconnect (Dec. 9):
Oil Prices Drop, Despite Heightened Sanctions on Russian Crude
So, what’s going on?
Well, Elliott Wave International has studied the historic price patterns of oil and has concluded that investors cannot count on a relationship between prices and the oil market’s “fundamentals.”
Indeed, Robert Prechter’s Socionomic Theory of Finance provided historical analysis with this chart and commentary:
[The chart] shows the annual ratio between consumption and production worldwide. … Take a look at the three shaded trends on the graph. The huge surge in the ratio between 1980 and 1982 — the biggest rise on the chart — did not cause the price of oil to rise; rather, it fell, a lot. Nor did the large decline in the ratio between 2002 and 2005 cause the price of oil to fall; rather, it rose, a lot. And the rapid plunge in the ratio during 2009 did not cause the price of oil to fall; rather, it tripled. These extreme anomalies render the proposed causality spurious.
What Elliott Wave International has observed is that oil’s price does tend to follow Elliott wave patterns. As you probably know, Elliott waves reflect the repetitive patterns of investor psychology, the primary driver of financial markets.
Using the Elliott wave model, the December Global Market Perspective, a monthly Elliott Wave International publication which covers 50-plus financial markets, stated:
Crude should be at the forefront of a … decline.
Indeed, as of this intraday writing on Jan. 9, NYMEX crude oil is trading lower than it was when the December Global Market Perspective published.
Now, the new January Global Market Perspective offers more insight into what you can expect for oil’s future price path.
And, speaking of the Elliott wave model, if you’re new to the subject, or simply need a refresher, read Frost & Prechter’s Elliott Wave Principle: Key to Market Behavior. Here’s a quote:
In markets, progress ultimately takes the form of five waves of a specific structure. Three of these waves, which are labeled 1, 3 and 5, actually effect the directional movement. They are separated by two countertrend interruptions, which are labeled 2 and 4. The two interruptions are apparently a requisite for overall directional movement to occur.
[R.N.] Elliott noted three consistent aspects of the five-wave form. They are: Wave 2 never moves beyond the start of wave 1; wave 3 is never the shortest wave; wave 4 never enters the price territory of wave 1.
… Elliott did not specifically say that there is only one overriding form, the “five-wave” pattern, but that is undeniably the case. At any time, the market may be identified as being somewhere in the basic five-wave pattern at the largest degree of trend. Because the five-wave pattern is the overriding form of market progress, all other patterns are subsumed by it.
Read EWI’s new Global Market Perspective FREE
Now — February 3
Dozens of markets around the globe are ending Elliott wave patterns right now. When they turn, they will make headlines.
And can change fortunes.
You can be ahead of that news — ready, waiting and well-positioned. EWI’s freeState of the Global Markets event will get you ready.
Starting on January 16, and every two days, you’ll get a section of the latest issue of EWI’s Global Market Perspective.
At the end, you’ll have the entire January 2023 Global Market Perspective. This will arm you with the wave patterns around the world that are about to reverse.
Don’t miss it. And don’t miss the edge it will give you. Follow the link to join in free below.
This article was syndicated by Elliott Wave International and was originally published under the headline Why Oil Prices Fell in the Face of “Supply Shock”. EWI is the world’s largest market forecasting firm. Its staff of full-time analysts led by Chartered Market Technician Robert Prechter provides 24-hour-a-day market analysis to institutional and private investors around the world.
In light of Bion Environmental Technologies signing a letter of intent to develop a 45,000- head sustainable beef project with Olson Farms/TD Angus, Penny Queen reviews the company to tell you whether she believes it is a good buy.
Huge news came out from Bion Environmental Technologies Inc. (BNET:OTCQB) last Monday! They announced a letter of intent to develop a 45,000- head sustainable beef project with Olson Farms/TD Angus. I was in the middle of writing an article about Bion and why I think they are a great buy when this news came out. So, I am going to carry on, but now with even higher expectations.
Bion Technologies and Walmart
What really sticks out to me about their latest announcement is how it ties Bion to Walmart. The company has been careful with its words, but you don’t have to look very deep to see the connection.
Bion is now planning a 45k head project with Olson Farms/TD Angus. It is worth noting that Olson Farms/TD Angus is a founding member of Sustainable Beef, LLC, with a rancher-owned, US$325 million packing plant being developed in North Platte, NE.
Walmart Inc. (WMT:NYSE) just announced an equity investment to buy a minority stake in Sustainable Beef, LLC.
Connecting the dots seems pretty easy here. It looks like Walmart is showing that they have sufficient demand for a premium product and want to secure its distribution.
In late September, Bion added Bill Rupp to its Advisory Group; he also happens to be a principle of Sustainable Beef, LLC., a former president at Cargill and JBS, two of the world’s top three meat packers.
Demand
Fun Fact: In 2021, Walmart US did US$4.1 billion in beef sales, and Walmart Mexico did US$321 million in beef sales. That is just under 6 million cattle being sold through Walmart alone.
Before the announcement, Bion already had plans for one 15,000-head sustainable beef project with Ribbonwire Ranch, and the economics of it are impressive!
Most investors are familiar with the meteoric rise (and subsequent fall) of plant-based meat companies over 2021 and 2022.
I believe the lesson to be learned from it is two-fold, there is a great demand for alternatives to current farming practices, and there is still a massive demand for animal proteins. A recent survey by Midan Marketing showed that 62% of American consumers purchase premium beef.
The global demand for beef cattle is 1.1 billion, with 90 million of that being in the U.S.
BION is effectively creating a new premium niche, sustainable beef. Their system turns environmental liabilities into agricultural assets. It greatly reduces environmental damage, provides economic benefits to farmers, and also provides benefits to the end consumer.
The Problem
The problem with traditional feedlot systems is the intensity. They place cows in massive outdoor feedlots for up to 3 months of ‘finishing.’ The waste from these cows is spread untreated onto fields and leads to nitrate contamination in groundwater, toxic algae blooms, and increases phosphorus in the soil. The methane, ammonia, and NOX from the cattle is also released into the air. This is an environmental disaster on its own, but the practice also increases pathogens and antibiotic resistance in cattle.
Bion has the Solution
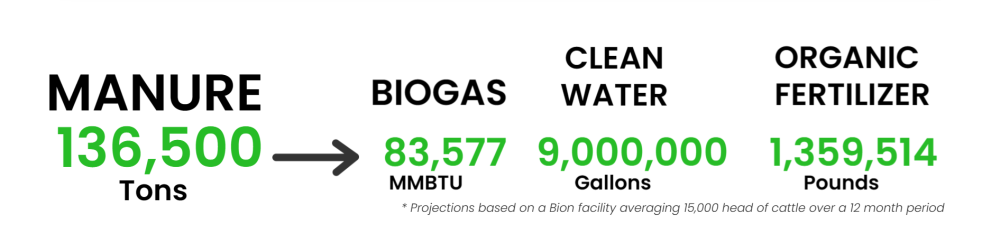
Bion Environmental Technologies specializes in developing advanced technology for treating livestock waste. In plain English, they take animal poop and turn it into money. They process the waste back into biogas, clean water, and fertilizer. The image below shows what the annual waste from 15,000 cattle becomes with their process.
The BION system can work will all sorts of livestock, but since their current agreements are cattle based, that is what I’ll focus on.
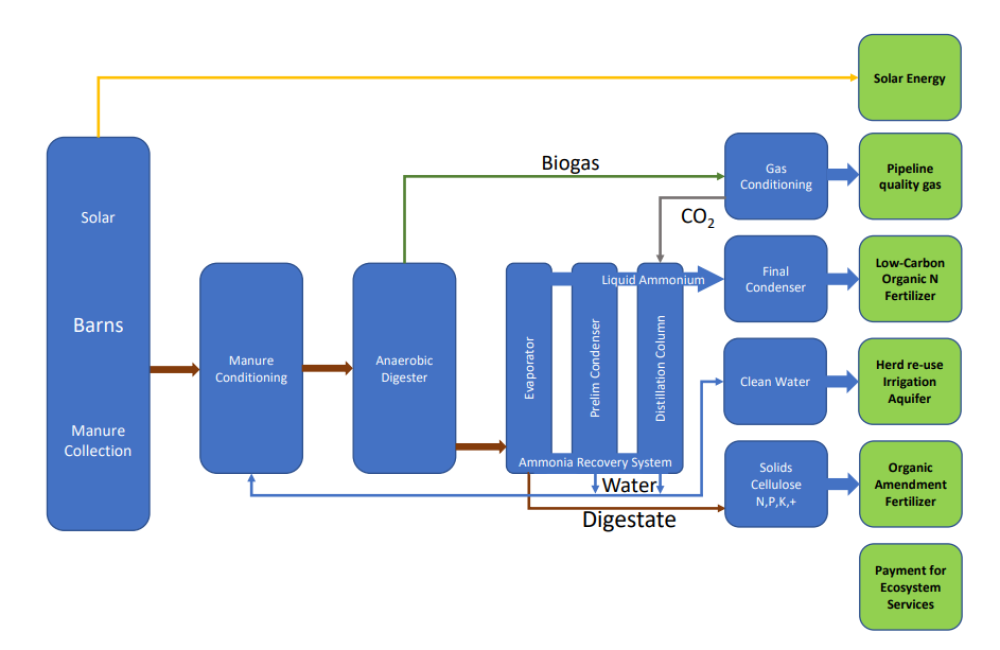
Their system includes large, covered barns that protect the animals from the elements. The system utilizes with solar-powered lighting, manure conditioning and collection, biogas upgrading and recovery, ammonia capture and manufacturing of organic fertilizer products, and clean water recovery.
All operations will be third-party validated, USDA-certified, and blockchain-recorded, resulting in a premium product that is transparent, sustainable, and has significantly lower environmental impacts on air, water, and land.
Project Economics
Before the announcement, Bion already had plans for one 15,000-head sustainable beef project with Ribbonwire Ranch, and the economics of it are impressive! (The Ribbonwire agreement is for one 15k head module, with an option for another three. The following numbers are based on one module.)
Clive Maund suggested that Bion was building up to a major bull market.
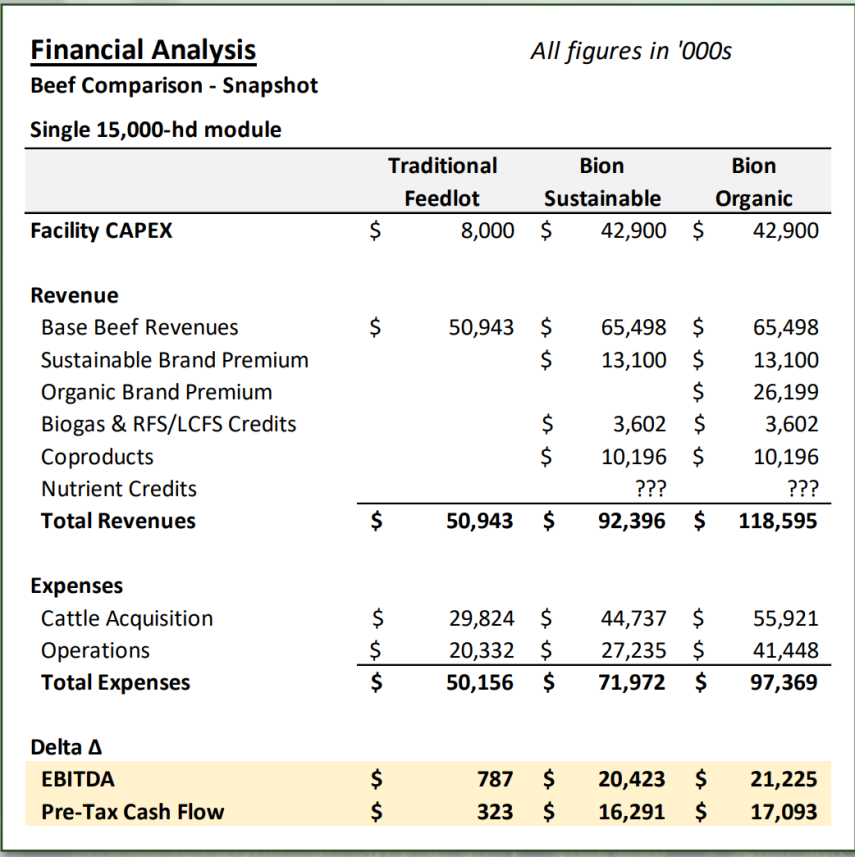
The following image is taken from their investor deck. It shows the breakdown for a 15,000-head system, including both organic and sustainable beef. The capital costs are much higher for the BION system, coming in at 42.9 million dollars each, compared to US$8 million for an outdoor feedlot.
It does not take long for a return on the investment due to the multiple income streams and higher margins.
A traditional feedlot is estimated to bring in less than half the revenue. The beef industry is a low-margin world and doubling your revenue is a dream come true for farmers.
Projects and Partnerships
Take that last analysis and triple it! Three of Bion’s 15,000-head modules will make up the Olson Farms/TD project.
Construction is expected to start in the second half of 2023, with a definitive joint venture in early 2023. By the end of 2024, early beef and coproduct earnings are anticipated, and in 2025, production might reach up to 135,000 head annually.
Showcase
Both the Ribbonwire Ranch and Olson Farms projects will serve as a sort of showroom for other cattle farmers. I expect to see significantly increased demand for their systems after a successful launch of either project.
Blockchain
Another element that I think is worth reviewing is the blockchain tracking system. I will admit to not being a fan of cryptocurrency, but if there is one good thing to come out of crypto, it is the blockchain.
I see BION being a steady grower over the next few years.
The ability to store information immutably on the blockchain provides a number of food safety protections and allows consumers to know that if they are buying organic or sustainable products, they are really getting what they paid for.
In the event of a food recall, there will be no doubt as to what products are potentially bad. This is a huge cost savings for retailers. Often there is a recall, and they just offer refunds for anything bought between certain dates. With blockchain, they could simply say, “products ending in 4232 need to be returned,” or something of the like.
Analyst Targets
Back in July, Clive Maund suggested that Bion was building up to a major bull market. It was trading at US$1.05 when he said that, and today’s price of US$1.45 seems to point to the same thing. This technology is gaining traction. The stock price is gaining traction.
A few months ago, I was able to find a report by Jeff Campbell, former analyst with Alliance Global, who gave a price target of US$3 back in August. This price target was only included the Ribbonwire deal and did not include the recent deals.
I have not given enough time or words to the environmental benefits or potential tax credits that could be involved. I see BION being a steady grower over the next few years. These projects take time to develop, but it is hard to deny that they are gaining momentum. I am hoping to see additional deals in the coming months.
PennyQueen Disclosures
I have not and will not be compensated for this report in any way. I write reports on my favorite picks; this is meant to be educational and not investment advice, as I am not an investment advisor, just a mom on a mission to make the world better and make money along the way.
Disclosures
1) PennyQueen: I, or members of my immediate household or family, own securities of the following companies mentioned in this article: Bion Environmental Technologies Inc. I personally am, or members of my immediate household or family are, paid by the following companies mentioned in this article: None.
2) The following companies mentioned in this article are billboard sponsors of Streetwise Reports: None. Click here for important disclosures about sponsor fees. The information provided above is for informational purposes only and is not a recommendation to buy or sell any security. As of the date of this article, an affiliate of Streetwise Reports has a consulting relationship with: Bion Environmental Technologies Inc. Please click here for more information.
3) Statements and opinions expressed are the opinions of the author and not of Streetwise Reports or its officers. The author is wholly responsible for the validity of the statements. The author was not paid by Streetwise Reports for this article. Streetwise Reports was not paid by the author to publish or syndicate this article. Streetwise Reports requires contributing authors to disclose any shareholdings in, or economic relationships with, companies that they write about. Streetwise Reports relies upon the authors to accurately provide this information and Streetwise Reports has no means of verifying its accuracy.
4) The article does not constitute investment advice. Each reader is encouraged to consult with his or her individual financial professional and any action a reader takes as a result of information presented here is his or her own responsibility. By opening this page, each reader accepts and agrees to Streetwise Reports’ terms of use and full legal disclaimer. This article is not a solicitation for investment. Streetwise Reports does not render general or specific investment advice and the information on Streetwise Reports should not be considered a recommendation to buy or sell any security. Streetwise Reports does not endorse or recommend the business, products, services or securities of any company mentioned on Streetwise Reports.
5) From time to time, Streetwise Reports LLC and its directors, officers, employees or members of their families, as well as persons interviewed for articles and interviews on the site, may have a long or short position in securities mentioned. Directors, officers, employees or members of their immediate families are prohibited from making purchases and/or sales of those securities in the open market or otherwise from the time of the decision to publish an article until three business days after the publication of the article. The foregoing prohibition does not apply to articles that in substance only restate previously published company releases. As of the date of this article, officers and/or employees of Streetwise Reports LLC (including members of their household) own securities of Bion Environmental Technologies Inc., a company mentioned in this article.
In conjunction with the release of its third-quarter report, Largo Inc. reported record high-purity vanadium production. Read more to hear what analysts are saying about this stock and the multiple catalysts the company has set for the future.
This November, Largo Inc. (TSX:LGO;NASDAQ:LGO)announced that it produced record high-purity vanadium production and completed battery stack manufacturing for its 6.1 MWh VCHARGE VRFB Deployment in Spain. However, despite impacts incurred during the quarter, the company continues to make moves with exciting growth plans throughout 2025.
Largo Inc. is a dual-listed vanadium producer and supplier that produces 7% of the world’s vanadium supply.
The company does everything to further its mission to provide the world with low-carbon solutions and create value through its unique vertical integration. This is done through the company’s two-pillar strategy based on 1.) vanadium production from one of the highest grade and lowest cost vanadium production facilities in Brazil and 2.) its energy storage business in the U.S. with one of the world’s most advanced VRFB technologies.
H.C. Wainwright analyst Heiko F. Ihle gave the company a Buy rating and a CA$19 target price and said, “In our view, some of this value is likely to surface in the near-term since market interest for clean energy investments remains quite high.”
Vanadium is a rare metal discovered in Mexico in 1801. It is a key transition metal suitable for use in energy storage and high-quality alloy applications. Approximately 90% of vanadium is currently used as a steel additive. It is used in the hardening of space vehicles, nuclear reactors, and airplanes.
However, more excitingly, it is also used in producing vanadium electrolyte, which is used in Vanadium redox batteries. These batteries store significant amounts of renewable energy from solar and wind power. According to an article in the Journal of Vacuum Science & Technology B, Vanadium redox batteries are “the most successful Redox flow batteries (RFB) for large-scale applications,” which may explain their recent increase in demand, particularly in China.
On December 13, Pangang Group Vanadium & Titanium Resources Co., Ltd. announced that the company’s wholly-owned subsidiary, Pangang Group Chengdu Vanadium & Titanium Resources Development Co., Ltd. and Dalian Rongke Power Group Co., Ltd. recently signed the “2023 Annual Framework Agreement on Vanadium Battery Energy Storage Material Cooperation” in Chengdu, Sichuan.
According to the agreement, both parties shall adopt the cooperative mode of purchasing and selling ammonium polyvanadate raw materials, with an estimated total quantity (converting to vanadium pentoxide) of 8,000 tons in 2023. If the agreements signed are all successfully executed, the total transaction amount is expected to be about RMB$1 billion (US$144 million) based on the current market prices of vanadium products.
This represents approximately 4% of 2022’s annualized global vanadium supply. Dalian Rongke Power operates the world’s largest vanadium battery with a capacity of 100 MW/400 MWh and plans to further increase its capacity to 200 MW/800 MWh following a second phase of expansion.
Vanadium Demand Rising
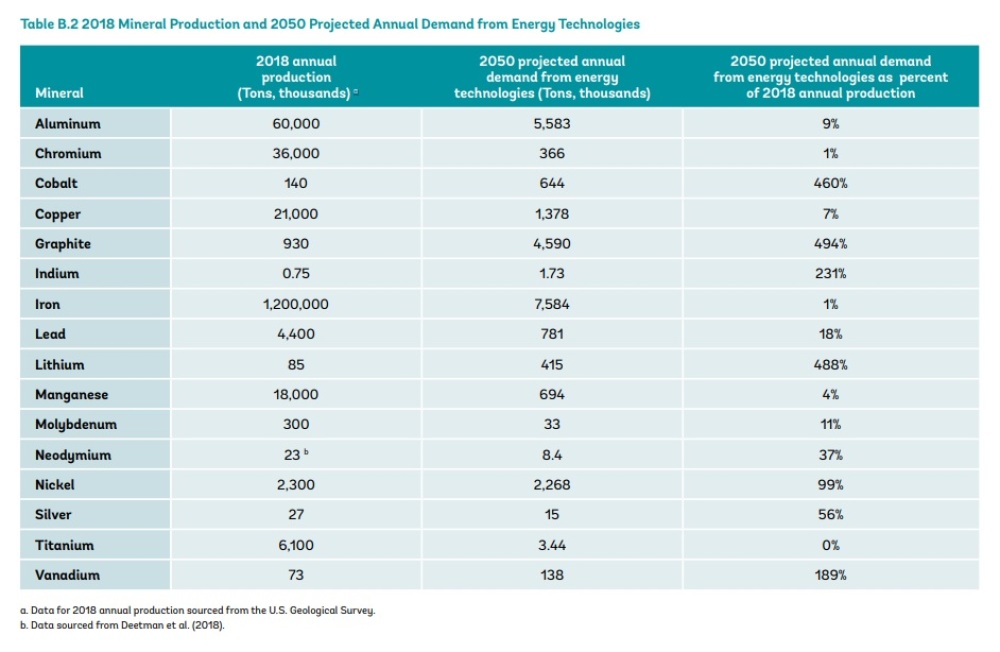
Demand for low-carbon technology has been growing worldwide. The World Bank Group report, “The Mineral Intensity of the Clean Energy Transition,” projected that demand for vanadium will rise by 189% by 2050. And it has caught the attention of experts throughout the past year.
In an April post, Shovel Stocks said, ” Investors, therefore, should look for vanadium projects with deposits which are either huge, non-TVM, or both.”
The metal is also desirable from an ESG standpoint as it includes non-degrading, fully recyclable electrolyte and carbon-reducing steel alloying applications. Yet, there is a deficit between current supply and demand.
Vanadium price spiked in 2018 to US$30 per pound, caused by a deficit of 8-10 tonnes.Last year, Roskill said it expects “structural deficit and elevated prices to remain for some time, which should incentive a handful of new projects into production over the next decade. ” This isn’t just because of unexpected demand, but projects can take up to five years to start production.
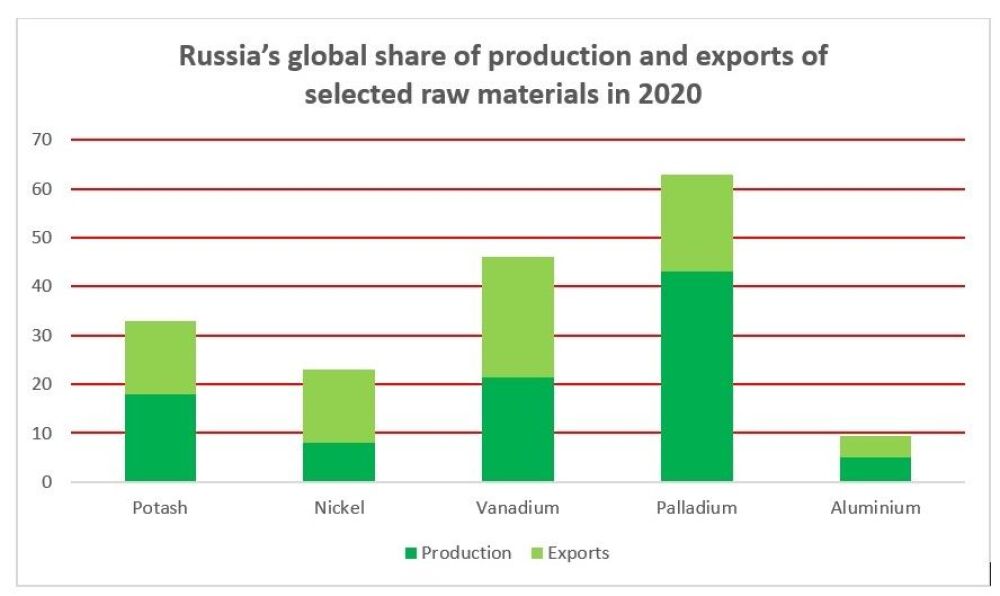
This strain is exacerbated by the war in Ukraine, as 70% of the world’s vanadium supply is currently with Russia and China.
Source: USGS Mineral Commodity Statistics and UN Comtrade via OECD.
As Simon Hilton of AG Chemi Group pointed out, “unless the war ends soon, manufacturers, raw material suppliers, and consumers everywhere will have to restrict production, manage a shortfall in supply, or simply do without.”
This is where Largo Inc. steps in as a producer outside the typical China-Russia sphere.
Largo is the Largest, Highest-Grade Primary Producer
While Largo only produces 7% of the world’s vanadium, it is the largest, highest-grade primary producer globally and is one of only two producers that supply HP to the aerospace industry.
According to the company, it generates a healthy operating margin with cash operating costs of US$4.30 per pound (US$4.30/lb) in 2022 guidance and rising vanadium prices. In late December, the price of vanadium was US$8.95/lb. This has now risen almost 10%, with the price at US$9.83/lb.
High-purity sales can also add US$1-2 more per pound for Largo’s HP vanadium.
Clean energy pillar: delivery of inaugural VRFB for Enel, exploring government subsidies, non-binding MOU to potentially form a JV with Ansaldo Energia
CIBC Equity Research noted that they “view successful execution of Largo’scapital construction projects, as well as [the] advancement of the clean energy business through further customer updates to be potential catalysts in the year ahead.”
Largo also plans to produce ilmenite and titanium pigment from the same mining stream it does vanadium, which is expected to aid in lowering the vanadium cash costs as a co-product.
The company has also signed a non-binding MOU to negotiate the formation of a joint venture with Ansaldo Green Tech to manufacture and deploy VRFBs in the European, African, and Middle East power generation markets.
In a November 11, 2022 note, H.C. Wainwright analyst Heiko F. Ihle gave the company a Buy rating and a CA$19 target price and said, “In our view, some of this value is likely to surface in the near-term since market interest for clean energy investments remains quite high.”
Gordon Lawson et al. at Paradigm Capital also echoed this with its own Buy rating on Largo and a CA$20 target.
Q3/22 Highlights
While important for its unique placement as one of the world’s largest primary vanadium producers, Largo has been making moves these past few months. In September of last year, Largo’s new venture Largo Physical Vanadiumbegan trading on the TSX Venture Exchange under the ticker “VAND.” This venture provides investors with the opportunity to own physical vanadium themselves, which could increase demand within the vanadium market and aid in Largo’s clean energy strategy. You can learn more about how vanadium will aid in a greener future here.
At the time of the listing, Largo President and CEO Paulo Misk said, “With this enhanced visibility on the TSXV, LPV will do its part to raise the profile of vanadium — a key green transition metal central to clean energy storage and greener steel.”
Then in October, the company released reports for its third quarter of 2022. Highlights of the third quarter included:
V2O5 production of 2,906 tonnes (6.4 million lbs) versus 3,260 tonnes produced in Q3 2021; Lower quarterly production due to a planned kiln and cooler refractory refurbishment and a change of mining contractor, but was in line with the company’s revised production guidance.
Record high purity V2O5 equivalent production of 962 tonnes, representing 33% of the company’s Q3 2022 production.
V2O5 equivalent sales of 2,796 tonnes (inclusive of 351 tonnes of purchased material) versus 2,685 tonnes sold in Q3 2021; Largo completed the first high-purity V2O3 sale in Europe in Q3 2022.
Average benchmark price per pound of V2O5 in Europe of US$8.23, a 12% decrease from the average of US$9.40 in Q3 2021; High purity vanadium demand has increased following ongoing recovery from 2020 COVID-19 impacts, which was partially offset by a softening of steel demand in Q3 2022.
The company advanced construction of its ilmenite concentration plant, including receiving all required metallic flotation structures and building of desliming, flotation, filtration, warehouse, and pipe rack structures; It expects commissioning to be completed in Q2 2023.
Largo Clean Energy (“LCE”) progressed with the delivery of its Enel Green Power España (“EGPE”) VCHARGE vanadium redox flow battery (“VRFB”), including the manufacturing of all high-power battery stacks required for the system; The company has begun shipping battery stacks and electrolyte to the deployment site in Mallorca, Spain.
Largo Physical Vanadium Corp. (“LPV”) commenced trading on the TSX Venture Exchange on September 27, 2022, under the symbol “VAND” and launched a new website www.lpvanadium.com.
Published inaugural Climate Report aligned with the Taskforce on Climate-Related Financial Disclosures (TCFD), providing additional transparency on the company’s approach to climate change.
Multiple Catalysts
Experts expect vanadium to have a bullish market in 2023, and Largo plans to take full advantage of this as the company is highly leveraged to increase vanadium prices. It also has an ilmenite plant that is expected to come online in Q3 2023, and the company expects this new revenue stream to arrive in 2024.
In a November 10, 2022, report, CIBC Equity Research noted that they “view successful execution of Largo’s capital construction projects, as well as [the] advancement of the clean energy business through further customer updates to be potential catalysts in the year ahead.”
The company also plans to iron out its titanium production strategy in three phases over the next six years. The official commencement of this plan is expected in 2025. Largo believes this will give them a US$2.0 billion After-Tax NPV7% and US$4.2 billion After-Tax Life of Mine Cash Flow (using US$8/lb vanadium price).
Last but not least, Largo’s inaugural VRFB installation for Enel Green Power in Spain is anticipated for quarter two of 2023.
According to Reuters, around 70% of the shares are tightly held. 25.21% of the shares are held with institutions. VC/PE Firms hold the most, with 43.81%. Arias Resources Capital Management LP has the most shares at 43.81%, with 28 million shares. West Family Investments is at 8.71%, with a little over 5 million shares, and Grantham Mayo Van Otterloo & Co. LLC is at 7.66%, with 4.9 million. BNY Asset Management has 1.84%, with a little over a million shares, and Baker Steel Capital Managers LLP has 1.27%, with 800,000 shares.
Other notable institutions and firms include Dolefin SA, Legal & General Investment Management Ltd., Konwave AG, Go ETF Solutions LLP, Rezco Investment Council, Blackrock Inc. ETFS Management, Russell Investment Management LLC, Mid-Continent Capital LLC, and BTG Pactual Asset Management SA.
0.67% of stocks are with management and insiders, and 30.31% are in retail. Of Management, President, CEO, and Director, Paulo Misk has the most shares at 0.19%, with 122,510.
As of September 30, 2022, the company has US$62.7 million in the bank.
Largo has a market cap of CA$478.75 million with 64 million shares outstanding. It trades in the 52-week range between CA$6.34 and CA$18.20.
Disclosures: 1) Katherine DeGilio wrote this article for Streetwise Reports LLC. She or members of her household own securities of the following companies mentioned in the article: None. She or members of her household are paid by the following companies mentioned in this article: None.
2) The following companies mentioned in this article are billboard sponsors of Streetwise Reports: Largo Inc.Click here for important disclosures about sponsor fees. As of the date of this article, an affiliate of Streetwise Reports has a consulting relationship with: None.Please click here for more information.
3) Statements and opinions expressed are the opinions of the author and not of Streetwise Reports or its officers. The author is wholly responsible for the validity of the statements. The author was not paid by Streetwise Reports for this article. Streetwise Reports was not paid by the author to publish or syndicate this article. Streetwise Reports requires contributing authors to disclose any shareholdings in, or economic relationships with, companies that they write about. Streetwise Reports relies upon the authors to accurately provide this information and Streetwise Reports has no means of verifying its accuracy.
4) This article does not constitute investment advice. Each reader is encouraged to consult with his or her individual financial professional and any action a reader takes as a result of information presented here is his or her own responsibility. By opening this page, each reader accepts and agrees to Streetwise Reports’ terms of use and full legal disclaimer. This article is not a solicitation for investment. Streetwise Reports does not render general or specific investment advice and the information on Streetwise Reports should not be considered a recommendation to buy or sell any security. Streetwise Reports does not endorse or recommend the business, products, services or securities of any company mentioned on Streetwise Reports.
5) From time to time, Streetwise Reports LLC and its directors, officers, employees or members of their families, as well as persons interviewed for articles and interviews on the site, may have a long or short position in securities mentioned. Directors, officers, employees or members of their immediate families are prohibited from making purchases and/or sales of those securities in the open market or otherwise from the time of the decision to publish an article until three business days after the publication of the article. The foregoing prohibition does not apply to articles that in substance only restate previously publishLargo Inc, a company mentioned in this article.