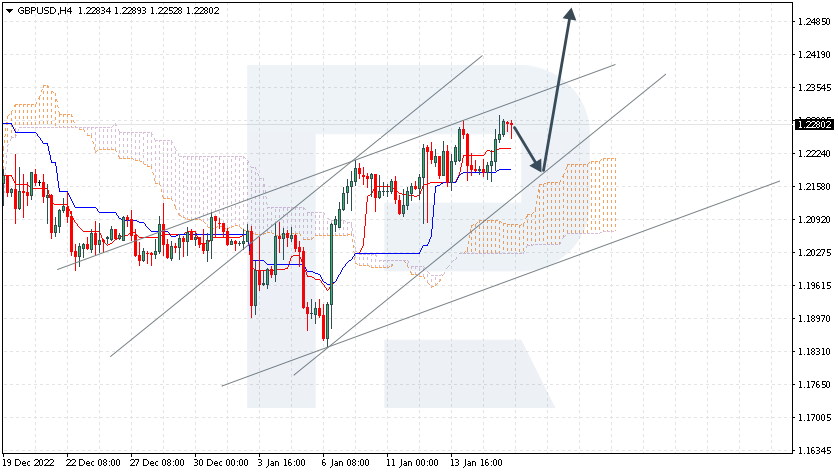
The pair is testing the resistance level. The instrument is going above the Ichimoku Cloud, which implies an uptrend. A test of the Kijun-Sen line is expected at 1.2170, followed by growth to 1.2485. An additional signal confirming the growth will be a bounce off the lower border of the ascending channel. The scenario can be cancelled by a breakaway of the lower border of the Cloud and securing under 1.2005, which will entail further falling to 1.1910.
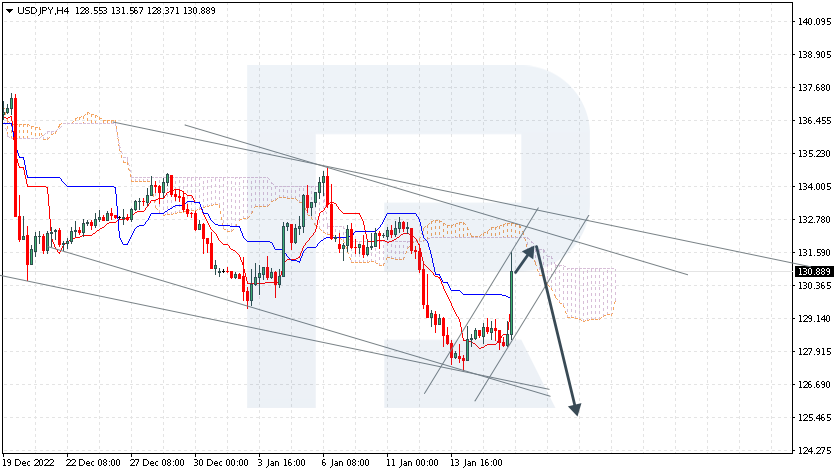
USDJPY, “US Dollar vs Japanese Yen”
The currency pair is correcting in a descending channel. The instrument is going below the Cloud, which implies a downtrend. A test of the upper border of the Cloud is expected at 131.60, followed by falling to 125.45. An additional signal confirming the decline will be a bounce off the upper border of the descending channel. The scenario can be cancelled by a breakaway of the upper border of the Cloud and securing above 132.75, which will entail further growth to 133.65. The decline can be confirmed by a breakaway of the lower border of the bullish channel and securing under 129.05.
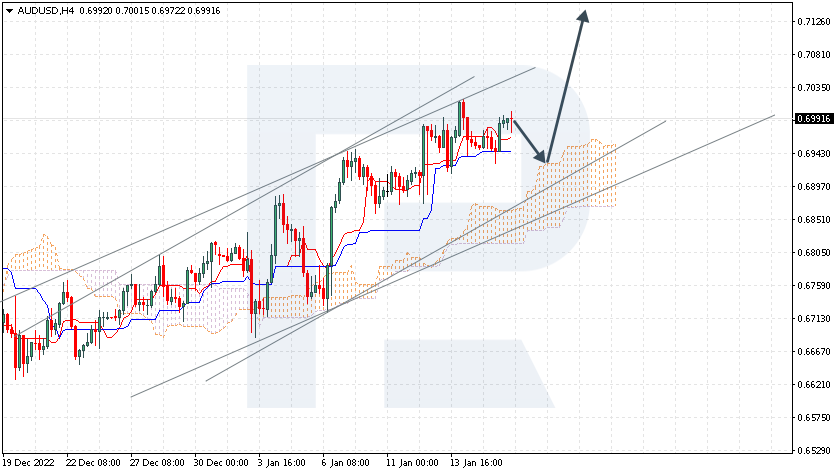
AUDUSD, “Australian Dollar vs US Dollar”
The currency pair is pushing off the signal lines of the indicator. The instrument is going above the Cloud, which implies an uptrend. A test of the upper border of the our is expected at 0.6840, followed by growth to 0.7125. An additional signal confirming the growth will be a breakaway of the lower border of the Cloud and securing under 0.6775, which will indicate further falling to 0.6685.
Attention! Forecasts presented in this section only reflect the author’s private opinion and should not be considered as guidance for trading. RoboForex LP bears no responsibility for trading results based on trading recommendations described in these analytical reviews.
Supply chain disruptions during COVID-19 brought to light how interdependent nations are when it comes to manufacturing. The inability of the U.S. to produce such needed goods as test kits and personal protective equipment during the pandemic revealed our vulnerabilities as a nation. China’s rise as a global production superpower has further underscored the weaknesses of American manufacturing.
In addition to fixing supply chain disruptions, bringing manufacturing back to the U.S. will benefit national security. Advanced computer chips, for example, are disproportionately made by a single firm, the Taiwan Semiconductor Manufacturing Co. These microchips are critical to smartphones, medical devices and self-driving cars, as well as military technology. TSMC, from a U.S. national security perspective, is located too close to China. Taiwan’s proximity to China makes it vulnerable because the Chinese government threatens to use force to unify Taiwan with the mainland.
My research and that of others examines how the lack of manufacturing competitiveness in the U.S. leaves the U.S. vulnerable to shortages of critical goods during times of geopolitical disruption and global competition. The strategies the U.S. employs in bringing back manufacturing, along with innovative practices, will be key to ensure national security.
Strengthening national security
President Joe Biden has signed two bills that propose to rebuild American manufacturing. The CHIPS and Science Act of 2022 will provide US$52.7 billion for American semiconductor research, development, manufacturing and workforce development.
Training workers for new advanced manufacturing is another key factor in strengthening a sector that has become increasingly reliant on technology. In fact, while the number of jobs in American manufacturing fell by 25% after 2000, manufacturing output did not decline. Still, American manufacturing is facing a massive shortage of labor, especially among those workers with skills needed to power a new generation of manufacturing.
This need to train a new group of skilled workers explains why federal funds in the CHIPS Act are set aside for workforce development. Complementing federal legislation are programs such as America’s Cutting Edge, a national initiative that provides free online and in-person training designed to meet the growing need in the U.S. machining and machine tool industry for skilled operators, engineers and designers.
The power of innovation
It is impractical to bring all manufacturing back to the U.S. Offshoring is often less expensive. But research shows that certain types of in-country manufacturing can not only help secure national security but also spark innovation.
When research and development are conducted close to where the goods are physically made, this proximity can increase the likelihood of collaboration between these two activities. Collaboration can lead to greater efficiencies.
Product development can benefit as well. New research demonstrates that U.S. firms that located their manufacturing and R&D physically close to each other generated more patents than firms that did not.
Even so, the contribution of U.S. manufacturing firms to innovation declined greatly between 1977 and 2016. That’s because the benefits of locating manufacturing and R&D close to each other depends on the nature of the manufacturing itself, researchers have found.
For instance, the design of new drugs often requires manufacturing facilities to be located nearby. In that respect, co-locating manufacturing and research and development makes sense. This can be true for semiconductors as well. World-class chip manufacturers in Taiwan, such as TSMC, are located alongside a growing chip design industry, which permits designers to prototype and test new ideas quickly.
The U.S. and other countries are betting on the same potential benefits from co-location. For instance, to minimize the dependence on TSMC and, more generally, on foreign sources for chips, the European Union is spending 43 billion euros, while Japan is encouraging chip manufacturing at home with a $6.8 billion investment.
People are the bottom line
In a 2011 op-ed, I argued that while federal legislation to promote U.S. manufacturing could succeed in bringing more manufacturing back to the U.S., there was no guarantee that large numbers of jobs would be created – a key point made by those seeking to promote manufacturing.
Immigration policies designed to encourage highly skilled workers to come to the U.S. may be key to a stronger American manufacturing base. mana5280 for Unsplash, CC BY-SA
In fact, market forces and informed company decisions should, I believe, play a larger role picking winners than federal investment. Where that investment comes from, what it supports and how much money is needed are critical questions.
If firms choose to relocate their companies to benefit from the synergy of R&D, then they must be able to attract the best human resource talent available. This is where U.S. investment can help build a more skilled workforce.
As pointed out by the economist Gary Pisano, many policymakers in the U.S. have long believed that manufacturing is an attractive sector for people with less education and training. Therefore, as a nation, we have not devoted many resources to train people with specialized skills in manufacturing.
This approach stands in stark contrast to the approach followed in Germany. There, practical work is valued by employers and employees and hence apprenticeship programs are routinely used to train workers who are well qualified to work in the manufacturing sector. While the U.S. approach is changing with recently announced investment by the White House through the CHIPS and the Inflation Reduction acts, more is needed.
It is my belief that if the U.S. is to remain an economic powerhouse, then corporations should not separate their workforce, sending cost-saving manufacturing offshore while retaining the innovators. Corporations like Apple have sent nearly all of their production offshore, retaining only the most skilled parts of the supply chain involving activities like R&D.
Instead, the U.S. needs to financially support firms wishing to bring manufacturing back by making it easier for such firms to find qualified manufacturing workers at home – and close to innovators when practical. This effort will bolster the U.S.‘s ability to be self-sufficient, innovative and secure in times of geopolitical conflicts.
On H4, the quotes are under the 200-day Moving Average which indicates a downtrend. The RSI is nearing the overbought area. As a result, a bounce off 4/8 (131.25) is expected, followed by falling to the support level of 2/8 (128.12). The scenario can be cancelled by rising over the resistance level of 4/8 (131.25). In this case, the pair will continue correcting and might reach 5/8 (132.81).
On M15, the lower line of VoltyChannel is too far away from the current price, so falling can only be initiated by a bounce off 4/8 (131.25) on H4.
USDCAD, “US Dollar vs Canadian Dollar”
On H4, the quotes are also under the 200-day Moving Average, which indicates prevalence of a downtrend. The RSI has broken through the support level. As a result, we expect a downward breakaway of 3/8 (1.3366) and falling to the support level of 2/8 (1.3305). The scenario can be cancelled by rising over the resistance level of 5/8 (1.3488), which might lead to a trend reversal and growth to 6/8 (1.3549).
On M15, a breakaway of the lower line of VoltyChannel will increase the probability of further price falling.
Attention! Forecasts presented in this section only reflect the author’s private opinion and should not be considered as guidance for trading. RoboForex LP bears no responsibility for trading results based on trading recommendations described in these analytical reviews.
The ZEW German Economic Sentiment Index, jumped in January, outperforming the previous month’s reading. The ZEW Business Sentiment Index is considered a leading indicator of economic activity. The positive reading, the first since February 2022, indicates a marked improvement in economic conditions over the next six months, while the prospect of further declining inflation has improved expectations for consumer sectors. The ZEW index for the Eurozone also jumped. The increase in the indicators had little impact on the EUR/USD exchange rate, but there are more and more factors for a stronger euro.
Trading recommendations
Support levels: 1.0780, 1.0710, 1.0650, 1.0597, 1.0535, 1.0497, 1.0480
Resistance levels: 1.0833, 1.0875
The trend on the EUR/USD currency pair on the hourly time frame is still bullish. But the price is trading below the moving averages, rebounding from the daily resistance level. The MACD indicator has become negative, with signs of divergence persisting. Inside the day, sales begin to prevail. Under such market conditions, buy trades are best considered from the support level of 1.0780, with confirmation on intraday time frames as a false breakdown of the level. Sell deals can be considered from the resistance level of 1.0833, but better with confirmation in the form of a reverse initiative.
Alternative scenario: if the price breaks down through the support level of 1.0700 and fixes below it, the downtrend will likely resume.
News feed for 2023.01.18:
– Eurozone Consumer Price Index (m/m) at 12:00 (GMT+2);
– US Retail Sales (m/m) at 15:30 (GMT+2);
– US Producer Price Index (m/m) at 15:30 (GMT+2);
– US Industrial Production (m/m) at 16:15 (GMT+2);
– US FOMC Member Harker Speaks at 21:00 (GMT+2).
The GBP/USD currency pair
Technical indicators of the currency pair:
Prev Open: 1.2194
Prev Close: 1.2287
% chg. over the last day: +0.76 %
The UK unemployment rate remained at 3.7%, but average earnings rose to 6.4% from 6.1% the previous month, the highest rate of growth. In real terms (adjusted for inflation), wages fell by 2.6%, one of the biggest declines of all time. In other words, people’s wages went up, but purchasing power went down because of record inflation. The combination of high inflation, rising wages, and a strong labor market may well incline the Bank of England to raise rates more than expected at next month’s meeting.
Trading recommendations
Support levels: 1.2220, 1.2145, 1.2080, 1.2000, 1.1928, 1.1875, 1.1684
Resistance levels: 1.2288, 1.2308, 1.2431, 1.2519
From the technical point of view, the trend on the GBP/USD currency pair on the hourly time frame is bullish. The price is slowly rising, forming narrow price corridors. As a rule, such narrowing of liquidity led to sharp impulse movements. The MACD indicator became positive, but the presence of divergence and the presence of the daily resistance level limits the further growth of quotes. Under such market conditions, it is better to look for buy deals on intraday time frames from the support level of 1.2220, but with confirmation. It is better to look for sell deals from the resistance level of 1.2288 or 1.2308, but it is also better with a confirmation in the form of a false breakout or a change in the structure on the lower time frames.
Alternative scenario: if the price breaks down through the 1.2080 support level and fixes above it, the downtrend will likely resume.
News feed for 2023.01.18:
– UK Consumer Price Index (m/m) at 09:00 (GMT+2).
The USD/JPY currency pair
Technical indicators of the currency pair:
Prev Open: 128.48
Prev Close: 128.15
% chg. over the last day: -0.26 %
The Japanese yen dropped more than 2% after the Bank of Japan’s monetary policy meeting. The Bank of Japan left all policy settings unchanged. This includes the discount rate (maintained at -0.1%) and the 10-year bond yield target of around 0%. Policymakers also mentioned that they would continue to buy bonds with a degree of flexibility. This underscores the Central Bank’s intention to continue to control the yield curve as planned. This disappointed investors who had hoped for the first steps of monetary policy normalization.
Trading recommendations
Support levels: 129.65, 129.12, 128.09, 127.08, 126.19
From the technical point of view, the medium-term trend on the currency pair USD/JPY is close to changing to bullish. The price is trading above the levels of the moving averages but below the change in priority. The MACD indicator has become positive and indicates overbought. Buy trades are best considered after a slight correction from support levels of 129.65 or 129.12, but only with intraday confirmation. Sell deals can be looked for from the resistance level of 131.34 or 132.73 on the condition of a reverse reaction or false breakout.
Alternative scenario: If the price fixes above the resistance level of 132.73, the uptrend will be renewed with a high probability.
News feed for 2023.01.18:
– Japan BoJ Interest Rate Decision at 05:00 (GMT+2);
– Japan BoJ Monetary Policy Statement at 05:00 (GMT+2);
– Japan BoJ Outlook Report at 05:00 (GMT+2);
– Japan Industrial Production (m/m) at 06:30 (GMT+2);
– Japan BoJ Press Conference (Tentative).
The USD/CAD currency pair
Technical indicators of the currency pair:
Prev Open: 1.3400
Prev Close: 1.3388
% chg. over the last day: -0.09 %
In Canada, the consumer price level fell from 6.8% to 6.3% year-over-year. Core inflation (which excludes food and energy prices) also declined from 5.8% to 5.4% y/y. The decline in the cost of living was mainly due to a 13% drop in fuel prices. But food prices rose another 0.3% in the last month. While the official inflation rate is still more than double the Bank of Canada’s target, it is now at its lowest level in almost a year. Economists believe the central bank is likely to raise the benchmark interest rate by at least another 0.25%.
From the point of view of technical analysis, the trend on the USD/CAD currency pair is bearish. The price is traded in the price corridor. As a rule, such accumulation of liquidity leads to sharp impulse movements. The MACD indicator has become inactive. Under such market conditions, it is best to wait for the impulse exit and only then act. Buy trades should be considered from the support level of 1.3352, but only with short targets and confirmation. Sell deals are better to consider in the intraday time frames from the resistance level of 1.3459, but with a confirmation in the form of a reverse initiative or a false breakout.
Alternative scenario: if the price breaks out and consolidates above the resistance level of 1.3500, the uptrend will likely resume.
This article reflects a personal opinion and should not be interpreted as an investment advice, and/or offer, and/or a persistent request for carrying out financial transactions, and/or a guarantee, and/or a forecast of future events.
Walmart and Sustainable Beef LLC will work collaboratively to increase visibility in the beef supply chain and help ranchers grow their business
BENTONVILLE, Ark., and NORTH PLATTE, Neb., Aug 31, 2022 — Walmart Inc. (WMT:NYSE) and Sustainable Beef LLC announced today that Walmart signed an agreement to acquire a minority stake in Sustainable Beef LLC, a rancher-owned company based in North Platte, Nebraska. Walmart’s equity investment is part of a broader strategic partnership to source top-quality angus beef from Sustainable Beef LLC’s new beef processing facility. This partnership helps supplement the current beef industry and provides additional opportunities for ranchers to increase their business. As part of the investment, Walmart will also have representation on Sustainable Beef’s board.
Walmart’s investment will help Sustainable Beef LLC open its beef processing facility in North Platte, Neb. The facility is expected to break ground next month and open by late 2024, creating more than 800 new jobs. Walmart’s work with Sustainable Beef LLC will create more capacity for the beef industry.
“At Walmart, we are dedicated to providing high-quality, affordable beef to our customers, and an investment in Sustainable Beef LLC will give us even more access to these products,” said Tyler Lehr, senior vice president of merchandising for deli services, meat, and seafood, Walmart U.S. “We know Sustainable Beef LLC has a responsible approach to beef processing, one that includes creating long-term growth for cattle ranchers and family farmers. This investment provides greater visibility into the beef supply chain and complements Walmart’s regeneration commitment to improve grazing management.”
Sustainable Beef LLC will work with cattle feeders and ranchers to understand critical elements of the supply chain cycle, such as grain sourcing and grazing management. Animal care will follow the Five Freedoms, and there will be a consistent approach to antibiotic use and reporting across herds in line with Walmart’s Position on Antibiotics in Animals, which asks suppliers to adopt and implement American Veterinary Medical Association Judicious Use Principles of Antimicrobials. All of these components will help Sustainable Beef LLC to improve and refine the beef supply chain to provide quality beef for our customers.
“We set out on a journey two years ago to create a new beef processing plant to add some capacity to the industry and provide an opportunity for producers to integrate their business of raising quality cattle with the beef processing portion of the industry and do it in a sustainable manner, said David Briggs, CEO of Sustainable Beef LLC. “During this journey, we found that Sustainable Beef and Walmart aligned on continuing to improve how we care for our animals and crops and provide consumers the positive experience of enjoying quality beef.”
Walmart’s investment in Sustainable Beef LLC is the latest step in the retailer’s commitment to increasing access to high-quality beef at an affordable price for its customers while boosting capacity for the beef industry and ensuring long-term economic viability for cattle ranchers.
Disclosures:
1) The following companies mentioned in this article are billboard sponsors of Streetwise Reports: None. Click here for important disclosures about sponsor fees. The information provided above is for informational purposes only and is not a recommendation to buy or sell any security.
2) Statements and opinions expressed are the opinions of the author (Walmart) and not of Streetwise Reports or its officers. The author is wholly responsible for the validity of the statements. The author was not paid by Streetwise Reports for this article. Streetwise Reports was not paid by the author to publish or syndicate this article. Streetwise Reports requires contributing authors to disclose any shareholdings in, or economic relationships with, companies that they write about. Streetwise Reports relies upon the authors to accurately provide this information and Streetwise Reports has no means of verifying its accuracy.
3) This article does not constitute investment advice. Each reader is encouraged to consult with his or her individual financial professional and any action a reader takes as a result of information presented here is his or her own responsibility. By opening this page, each reader accepts and agrees to Streetwise Reports’ terms of use and full legal disclaimer. This article is not a solicitation for investment. Streetwise Reports does not render general or specific investment advice and the information on Streetwise Reports should not be considered a recommendation to buy or sell any security. Streetwise Reports does not endorse or recommend the business, products, services or securities of any company mentioned on Streetwise Reports.
4) From time to time, Streetwise Reports LLC and its directors, officers, employees or members of their families, as well as persons interviewed for articles and interviews on the site, may have a long or short position in securities mentioned. Directors, officers, employees or members of their immediate families are prohibited from making purchases and/or sales of those securities in the open market or otherwise from the time of the decision to publish an article until three business days after the publication of the article. The foregoing prohibition does not apply to articles that in substance only restate previously published company releases.
About Walmart Walmart Inc. (NYSE: WMT) helps people around the world save money and live better – anytime and anywhere – in retail stores, online, and through their mobile devices. Each week, approximately 230 million customers and members visit more than 10,500 stores and numerous eCommerce websites under 46 banners in 24 countries. With fiscal year 2022 revenue of $573 billion, Walmart employs approximately 2.3 million associates worldwide. Walmart continues to be a leader in sustainability, corporate philanthropy and employment opportunity. Additional information about Walmart can be found by visiting corporate.walmart.com, on Facebook at facebook.com/walmart and on Twitter at twitter.com/walmart.
The US indices traded yesterday without a single trend. At yesterday’s stock market close, Dow Jones (US30) decreased by 1.14%, and S&P 500 (US500) lost 0.20%. The NASDAQ Technology Index (US100) gained 0.14% on Tuesday.
The Empire State Manufacturing Index, which measures activity in New York State, fell to 32.9 in January, the worst reading since the pandemic.
Goldman Sachs (GS) financial performance fell short of expectations. The company’s price fell more than 6% on the report. The report showed weakness in consumer banking and a 48% drop in investment banking revenue. On the other hand, Morgan Stanley’s (MS) stock was up more than 6% on the report. Record revenues in the asset management business offset weakness in investment banking.
Investors are waiting for Netflix’s quarterly results to be released Thursday. Analysts at UBS said they expect the streaming giant’s subscriber count to rise in the fourth quarter amid “strong content and seasonality.” Netflix is expected to add about 4.5 million subscribers in the fourth quarter, up from 2.4 million in the previous quarter.
Tesla (TSLA) shares jumped by 6% after Deutsche Bank issued its recommendation to buy the company on expectations that recent price declines are likely to support sales growth.
According to Harvard University professor Kenneth Rogoff, sustained inflation above the 2% target will force Federal Reserve policymakers to keep interest rates higher for longer. Eventually, inflation will fall, but interest rates will not fall to the level they were before.
The Ukrainian government has hired BlackRock Inc. to help set up the country’s reconstruction fund.
According to a survey released at the annual World Economic Forum in Davos, two-thirds of private and public sector economists surveyed expect a global recession this year. Meanwhile, German Chancellor Olaf Scholz said Europe’s largest economy would avoid a recession this year thanks to efforts to limit the impact of the region’s energy crisis on the economy. Bob Prince, chief investment officer at Bridgewater Associates, said the economic cycle has returned and that more people will have to lose their jobs before inflation is brought under control. According to the chief economist of the European Bank for Reconstruction and Development, it will take years for sanctions against Russia to force Vladimir Putin to back down because oil and gas revenues outweigh sanctions losses many times over. Hopes that US and European sanctions will change the balance of power in the near future are an unrealistic scenario.
Equity markets in Europe mostly rose yesterday. German DAX (DE30) gained 0.35%, French CAC 40 (FR40) jumped by 0.48%, Spanish IBEX 35 (ES35) added +0.15%, and British FTSE 100 (UK100) closed yesterday down by 0.12%.
Germany’s inflation rate fell sharply from 10% to 8.6% year-on-year. The inflation rate slowed in December 2022, mainly due to lower energy prices. But despite the decline in inflation rates across Europe, according to Philip Lane, chief economist at the ECB, the central bank should continue to aggressively raise rates to levels that will begin to limit growth.
The British FTSE 100 index is close to an all-time high. Yesterday’s labor market data showed that the UK unemployment rate remained at 3.7%, but average earnings rose to 6.4% from 6.1% the previous month, the highest rate of growth. Wage growth is a major concern for the Bank of England, as there is a risk of a wage-price spiral that will eventually lead to higher inflationary expectations. UK inflation data will be released today, where consumer prices are expected to fall for the first time in 12 months.
Reuters predicts that gold prices will return to their all-time highs above the psychologically critical $2,000 level this year unless, of course, there is a major change in the US inflation picture. The highest gold price ever in US dollars is $2077.88. This peak was reached on August 7, 2020.
Oil prices continue to rise amid hopes for a rebound in Chinese demand, even despite weak economic data. The Organization of the Petroleum Exporting Countries (OPEC) reported in its monthly report that oil demand in China will increase by 510,000 BPD this year. The rise in oil was also supported by a weaker US dollar, which fell against most major currencies on Tuesday. A weaker dollar makes oil less expensive for other currency holders.
Asian markets traded flat yesterday. Japan’s Nikkei 225 (JP225) added 1.23% on Tuesday, China’s FTSE China A50 (CHA50) decreased by 0.47%, Hong Kong’s Hang Seng (HK50) ended the day down by 0.78%, India’s NIFTY 50 (IND50) added 0.89%, and Australia’s S&P/ASX 200 (AU200) ended the day up by 0.03%.
The Bank of Japan left all policy settings unchanged at its meeting. This includes the discount rate (maintained at -0.1%) and the 10-year bond yield target of about 0%. Policymakers also mentioned that they would continue to buy bonds with a degree of flexibility. This underscores the central bank’s intention to continue to control the yield curve as planned. This disappointed investors who had hoped for the first steps of monetary policy normalization.
S&P 500 (F) (US500) 3,990.97 −8.12 (−0.20%)
Dow Jones (US30) 33,910.85 −391.76 (−1.14%)
DAX (DE40) 15,187.07 +53.03 (+0.35%)
FTSE 100 (UK100) 7,851.03 −9.04 (−0.12%)
USD Index 102.40 +0.20 (+0.19%)
Important events for today:
– Japan BoJ Interest Rate Decision at 05:00 (GMT+2);
– Japan BoJ Monetary Policy Statement at 05:00 (GMT+2);
– Japan BoJ Outlook Report at 05:00 (GMT+2);
– Japan Industrial Production (m/m) at 06:30 (GMT+2);
– Japan BoJ Press Conference (Tentative);
– UK Consumer Price Index (m/m) at 09:00 (GMT+2);
– World Economic Forum Annual Meetings at 10:00 (GMT+2);
– Eurozone Consumer Price Index (m/m) at 12:00 (GMT+2);
– US Retail Sales (m/m) at 15:30 (GMT+2);
– US Producer Price Index (m/m) at 15:30 (GMT+2);
– US Industrial Production (m/m) at 16:15 (GMT+2);
This article reflects a personal opinion and should not be interpreted as an investment advice, and/or offer, and/or a persistent request for carrying out financial transactions, and/or a guarantee, and/or a forecast of future events.
The EURUSD on the H4 time frame was in an uptrend until 16 January when a last higher top was recorded at 1.08735.
A closer look at the Momentum Oscillator reveals negative divergence between point “a” and “b” when comparing the tops at 1.08671 and 1.08735. This could have alerted technically inclined traders that the bullish trend might lose power.
After the higher top at 1.08735, the price dropped through the 15 and 34 Simple Moving Averages and the Momentum Oscillator followed by moving into bearish territory.
A possible critical support level formed when a lower bottom was recorded on 18 January at 1.07654. The bulls are currently trying to drive the price higher.
If the price of EURUSD breaks through the critical support level at 1.07654, then three possible price targets may be projected from there.
Attaching the Fibonacci tool to the lower bottom at 1.07654 and dragging it to near a resistance level that was created on 17 January at 1.08734, the following targets may be anticipated:
The first target can be estimated at 1.06987 (161.8%).
The second price target may be calculated at 1.05907 (261.8%).
The third and final target can be expected at 1.04160 (423.6%).
If the resistance level at 1.08734 is broken, the above scenario must be re-examined.
After all, this could be a case of Euro bulls consolidating around 1.087, before mustering enough mass to punch past the immediate resistance levels that had thwarted EURUSD’s upside since last week.
As long as the bears continue their negative mindset and supply continues overcoming demand, the outlook for the EURUSD currency pair will remain bearish.
Republicans and Democrats are again preparing to play a game of chicken over the U.S. debt ceiling – with the nation’s financial stability at stake.
The Treasury Department on Jan. 13, 2023, said it expects the U.S. to hit the current debt limit of US$31.38 trillion on Jan. 19. After that, the government will take “extraordinary measures” – which could extend the deadline until May or June – to avoid default.
But it’s not clear whether Republicans in the House will agree to lifting the debt ceiling without strings attached – strings that President Joe Biden and Senate Democrats have vowed to reject. Right-wing Republicans demanded that, in exchange for voting for Kevin McCarthy as speaker of the House, he would seek steep government spending cuts as a condition of raising the borrowing limit.
Economist Steve Pressman explains what the debt ceiling is and why we have it – and why it’s time to abolish it.
1. What is the debt ceiling?
Like the rest of us, governments must borrow when they spend more money than they receive. They do so by issuing bonds, which are IOUs that promise to repay the money in the future and make regular interest payments. Government debt is the total sum of all this borrowed money.
The debt ceiling, which Congress established a century ago, is the maximum amount the government can borrow. It’s a limit on the national debt.
Around one-quarter of this money the government actually owes itself. The Social Security Administration has accumulated a surplus and invests the extra money, currently $2.8 trillion, in government bonds. And the Federal Reserve holds $5.5 trillion in U.S. Treasurys.
The rest is public debt. As of October 2022, foreign countries, companies and individuals owned $7.2 trillion of U.S. government debt. Japan and China are the largest holders, with around $1 trillion each. The rest is owed to U.S. citizens and businesses, as well as state and local governments.
3. Why is there a borrowing limit?
Before 1917, Congress would authorize the government to borrow a fixed sum of money for a specified term. When loans were repaid, the government could not borrow again without asking Congress for approval.
The Second Liberty Bond Act of 1917, which created the debt ceiling, changed this. It allowed a continual rollover of debt without congressional approval.
Congress enacted this measure to let then-President Woodrow Wilson spend the money he deemed necessary to fight World War I without waiting for often-absent lawmakers to act. Congress, however, did not want to write the president a blank check, so it limited borrowing to $11.5 billion and required legislation for any increase.
When the U.S. nears its debt limit, the Treasury secretary – currently Janet Yellen – can use “extraordinary measures” to conserve cash, which she indicated would begin on Jan. 19. One such measure is temporarily not funding retirement programs for government employees. The expectation will be that once the ceiling is raised, the government would make up the difference. But this will buy only a small amount of time.
If the debt ceiling isn’t raised before the Treasury Department exhausts its options, decisions will have to be made about who gets paid with daily tax revenues. Further borrowing will not be possible. Government employees or contractors may not be paid in full. Loans to small businesses or college students may stop.
When the government can’t pay all its bills, it is technically in default. Policymakers, economists and Wall Street are concerned about a calamitous financial and economic crisis. Many fear that a government default would have dire economic consequences – soaring interest rates, financial markets in panic and maybe an economic depression.
Under normal circumstances, once markets start panicking, Congress and the president usually act. This is what happened in 2013 when Republicans sought to use the debt ceiling to defund the Affordable Care Act.
But we no longer live in normal political times. The major political parties are more polarized than ever, and the concessions McCarthy gave right-wing Republicans may make it impossible to get a deal on the debt ceiling.
5. Is there a better way?
One possible solution is a legal loophole allowing the U.S. Treasury to mint platinum coins of any denomination. If the U.S. Treasury were to mint a $1 trillion coin and deposit it into its bank account at the Federal Reserve, the money could be used to pay for government programs or repay government bondholders. This could even be justified by appealing to Section 4 of the 14th Amendment to the U.S. Constitution: “The validity of the public debt of the United States … shall not be questioned.”
Few countries even have a debt ceiling. Other governments operate effectively without it. America could too. A debt ceiling is dysfunctional and periodically puts the U.S. economy in jeopardy because of political grandstanding.
The best solution would be to scrap the debt ceiling altogether. Congress already approved the spending and the tax laws that require more debt. Why should it also have to approve the additional borrowing?
It should be remembered that the original debt ceiling was put in place because Congress couldn’t meet quickly and approve needed spending to fight a war. In 1917 cross-country travel was by rail, requiring days to get to Washington. This made some sense then. Today, when Congress can vote online from home, this is no longer the case.
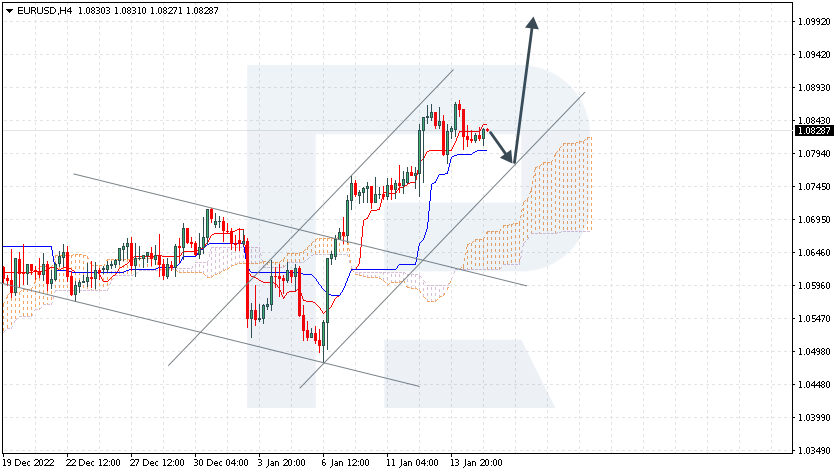
The currency pair is pushing off the signal lines of the indicator. The instrument is going above the Ichimoku Cloud, implying an uptrend. A test of the Kijun-Sen line is expected at 1.0775, followed by growth to 1.1005. An additional signal confirming the growth will be a bounce off the lower border of the bullish channel. The scenario can be cancelled by a breakaway of the lower border of the Cloud and securing under 1.0575, which will indicate further falling to 1.0485.
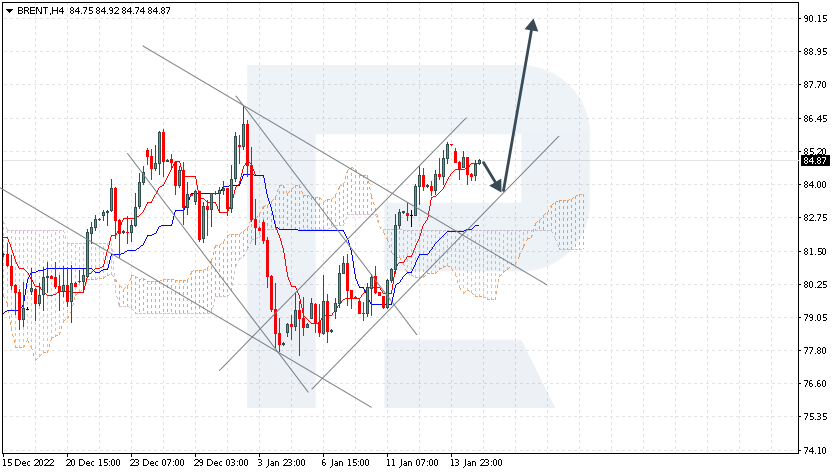
BRENT
Oil is testing the Tenkan-Sen line of the indicator. The instrument is going above the Ichimoku Cloud, which implies an uptrend. A test of the support area at 84.00 is expected, followed by growth to 90.00. An additional signal confirming the growth will be a bounce off the lower border of the ascending channel. The scenario can be cancelled by a breakaway of the lower border of the Cloud and securing under 77.00, which will entail further falling to 73.00.
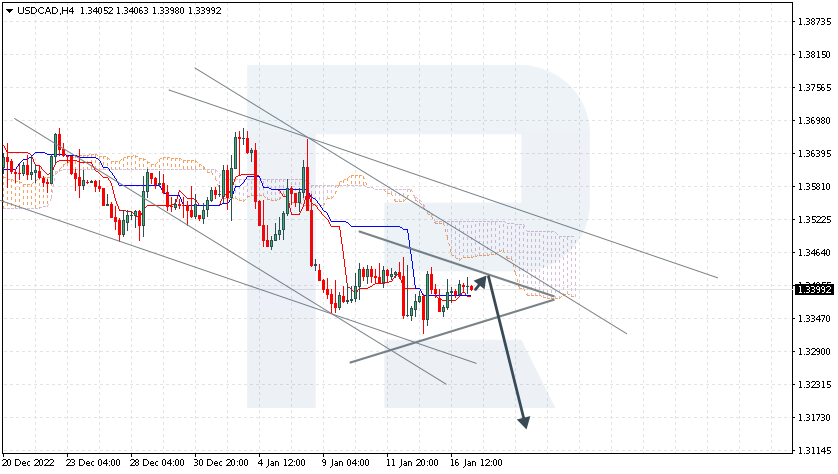
USDCAD, “US Dollar vs Canadian Dollar”
The currency pair is correcting inside a Triangle pattern. The instrument is going under the Ichimoku Cloud, which implies a downtrend. A test of the resistance level at 1.3405 is expected, followed by falling to 1.3165. An additional signal confirming the decline will be a bounce off the upper border of the Triangle pattern. The scenario can be cancelled by a breakaway of the upper border of the Cloud and securing above 1.3545, which will indicate growth to 1.3635. The decline may be confirmed by a breakaway of the lower border of the Triangle pattern and securing above 1.3295.
Attention! Forecasts presented in this section only reflect the author’s private opinion and should not be considered as guidance for trading. RoboForex LP bears no responsibility for trading results based on trading recommendations described in these analytical reviews.
The US stock market did not trade yesterday due to the holiday. But futures on indices traded in the European and partly in the US session. By the close of the futures market on Monday, the indices were down a bit, so the stock market’s opening on Tuesday will be accompanied by a price gap.
Traders should not forget that it is the earnings season in the United States. Such companies as Morgan Stanley (MS), Goldman Sachs (GS), Interactive Brokers (IBKR), and United Airlines Holdings (UAL) are reporting today.
Equity markets in Europe were mostly up yesterday. German DAX (DE30) gained 0.31%, French CAC 40 (FR40) added 0.28%, Spanish IBEX 35 (ES35) fell by 0.12%, and British FTSE 100 (UK100) closed on Monday with a 0.20% gain.
Short-term interest rate differentials are a good indicator of the future trajectory of relative monetary policy cycles. Using central bank policy projections, economists expect the two-year EUR/USD swap differential to reverse this year. Right now, swaps are trading at about 125 basis points in favor of the dollar, and by the end of this year, that differential could change to 40 basis points in favor of the euro. If this materializes, the EUR/USD currency pair will reach the 1.20 level before the end of the year.
In Europe, a surprisingly warm winter led to a drop in natural gas prices. Europe may come out of the heating season with more than 50% of its storage capacity filled. This could limit the jump in natural gas prices in the second half of 2023 to around €140-160/MWh. This is still high but well below the €250-300/MWh level seen last summer.
Goldman Sachs raised its aluminum price forecast due to rising demand in China and Europe. According to analysts, the metal is likely to cost an average of $3125 per tonne this year. However, it is pointed out that the upward price impulse will gradually increase in the spring.
Oil prices fell on Monday, consolidating after a strong rise last week ahead of the publication of demand forecasts from OPEC and IEA. These monthly reports strongly influence oil market trends in global oil demand. They may be essentially this month, given the importance the market attaches to a potential recovery in oil demand in China.
Asian markets traded flat yesterday. Japan’s Nikkei 225 (JP225) decreased by 1.14% on Monday, China’s FTSE China A50 (CHA50) added 1.50%, Hong Kong’s Hang Seng (HK50) was up by 0.04% on the day, India’s NIFTY 50 (IND50) fell by 0.34%, and Australia’s S&P/ASX 200 (AU200) was positive by 0.82%.
China’s GDP growth slowed in the latest quarter to +2.9% year-over-year, down from +3.9% in the previous quarter. But industrial production rose by 1.3% last month, while the unemployment rate fell to 5.5% from 5.7%. Analysts say rising domestic demand in China could be an important counterbalance to slowing growth in the US and Europe. Investors are once again buying up Chinese blue chips, from large consumer goods to financial companies. China’s stock market rally underscores expectations of an economic recovery at a time when most developed countries are in a recession. Foreign capital inflows into China reached about 44 billion yuan last week, the highest since May 2021.
There is a growing possibility that the Bank of Japan may announce a significant policy change this week as bond yields reach the upper limit again. According to economists, there are two options at the moment. The first (main scenario) is the abolition of the yield curve control policy. This might lead to a sell-off in Japanese equities, which would strengthen the yen. The second scenario is that Japan’s central bank can extend the range to 75 basis points on either side of its 0% target for 10-year government bonds. This would save time until the end of the quarter when Kuroda resigns. Either way, the closer we get to spring, the more likely the Bank of Japan will change course.
S&P 500 (F) (US500) 3,999.09 0 (0%)
Dow Jones (US30)34,302.61 0 (0%)
DAX (DE40) 15,134.04 +47.52 (+0.31%)
FTSE 100 (UK100) 7,860.07 +16.00 (+0.20%)
USD Index 102.39 +0.19 (+0.18%)
Important events for today:
– China GDP (q/q) at 04:00 (GMT+2);
– China Industrial Production (m/m) at 04:00 (GMT+2);
– China Retail Sales (m/m) at 04:00 (GMT+2);
– China Unemployment Rate (m/m) at 04:00 (GMT+2).
– UK Average Earnings Index (m/m) at 09:00 (GMT+2);
– UK Claimant Count Change (m/m) at 09:00 (GMT+2);
– UK Unemployment Rate (m/m) at 09:00 (GMT+2);
– German Consumer Price Index (m/m) at 09:00 (GMT+2);
– World Economic Forum Annual Meetings at 10:00 (GMT+2);
– German ZEW Economic Sentiment (m/m) at 12:00 (GMT+2);
– Eurozone ZEW Economic Sentiment (m/m) at 12:00 (GMT+2);
– Canada Consumer Price Index (m/m) at 15:30 (GMT+2);
– US NY Empire State Manufacturing Index (m/m) at 15:30 (GMT+2);
– US FOMC Member Williams Speaks at 22:00 (GMT+2).
This article reflects a personal opinion and should not be interpreted as an investment advice, and/or offer, and/or a persistent request for carrying out financial transactions, and/or a guarantee, and/or a forecast of future events.


 Geopolitics is a significant consideration in the manufacture of computer chips.