By Hannes van der Watt, University of North Dakota
Hydrogen, or H₂, is getting a lot of attention lately as governments in the U.S., Canada and Europe push to cut their greenhouse gas emissions.
But what exactly is H₂, and is it really a clean power source?
I specialize in researching and developing H₂ production techniques. Here are some key facts about this versatile chemical that could play a much larger role in our lives in the future.
So, what is hydrogen?
Hydrogen is the most abundant element in the universe, but because it’s so reactive, it isn’t found on its own in nature. Instead, it is typically bound to other atoms and molecules in water, natural gas, coal and even biological matter like plants and human bodies.
Hydrogen can be isolated, however. And on its own, the H₂ molecule packs a heavy punch as a highly effective energy carrier.
It is already used in industry to manufacture ammonia, methanol and steel and in refining crude oil. As a fuel, it can store energy and reduce emissions from vehicles, including buses and cargo ships.
Hydrogen can also be used to generate electricity with lower greenhouse gas emissions than coal or natural gas power plants. That potential is getting more attention as the U.S. government prepares new rules that would require existing power plants to cut their carbon dioxide emissions.
Because it can be stored, H₂ could help overcome intermittency issues associated with renewable power sources like wind and solar. It can also be blended with natural gas in existing power plants to reduce the plant’s emissions.
Using hydrogen in power plants can reduce carbon dioxide emissions when either blended or alone in specialized turbines, or in fuel cells, which consume H₂ and oxygen, or O₂, to produce electricity, heat and water. But it’s typically not entirely CO₂-free. That’s in part because isolating H₂ from water or natural gas takes a lot of energy.
How is hydrogen produced?
There are a few common ways to produce H₂:
- Electrolysis can isolate hydrogen by splitting water – H₂O – into H₂ and O₂ using an electric current.
- Methane reforming uses steam to split methane, or CH₄, into H₂ and CO₂. Oxygen and steam or CO₂ can also be used for this splitting process.
- Gasification transforms hydrocarbon-based materials – including biomass, coal or even municipal waste – into synthesis gas, an H₂-rich gas that can be used as a fuel either on its own or as a precursor for producing chemicals and liquid fuels.
Each has benefits and drawbacks.
Green, blue, gray – what do the colors mean?
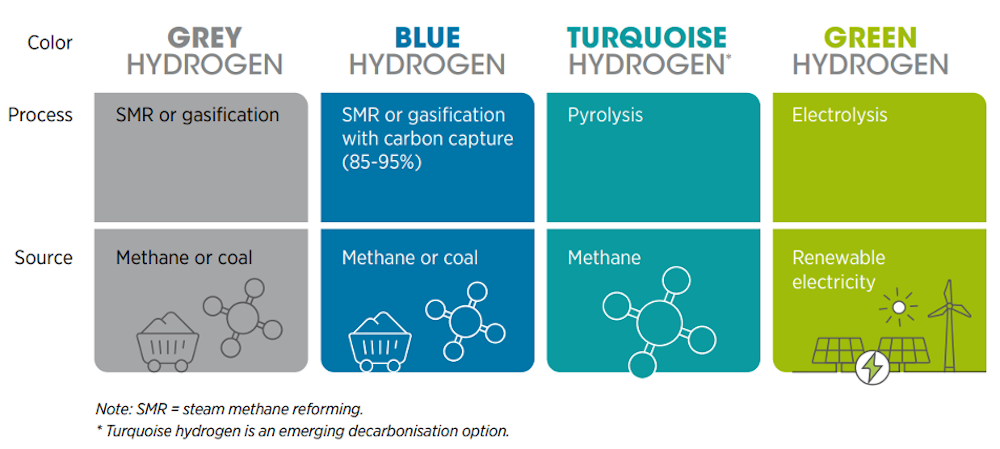
Hydrogen is often described by colors to indicate how clean, or CO₂-free, it is. The cleanest is green hydrogen.
Green H₂ is produced using electrolysis powered by renewable energy sources, such as wind, solar or hydropower. While green hydrogen is completely CO₂-free, it is costly, at around US$4-$9 per kilogram ($2-$4 per pound) because of the high energy required to split water.
IRENA (2020), Green Hydrogen: A guide to policymaking
Other less energy-intensive techniques can produce H₂ at a lower cost, but they still emit greenhouse gases.
Gray H₂ is the most common type of hydrogen. It is made from natural gas through methane reforming. This process releases carbon dioxide into the atmosphere and costs around $1-$2.50 per kilogram (50 cents-$1 per pound).
If gray hydrogen’s CO₂ emissions are captured and locked away so they aren’t released into the atmosphere, it can become blue hydrogen. The costs are higher, at around $1.50-$3 per kilogram (70 cents-$1.50 per pound) to produce, and greenhouse gas emissions can still escape when the natural gas is produced and transported.
Another alternative is turquoise hydrogen, produced using both renewable and nonrenewable resources. Renewable resources provide clean energy to convert methane – CH₄ – into H₂ and solid carbon, rather than that carbon dioxide that must be captured and stored. This type of pyrolysis technology is still new, and is estimated to cost between $1.60 and $2.80 per kilogram (70 cents-$1.30 per pound).
Can we switch off the lights on fossil fuels now?
Over 95% of the H₂ produced in the U.S. today is gray hydrogen made with natural gas, which still emits greenhouse gases.
Whether H₂ can ramp up as a natural gas alternative for the power industry and other uses, such as for transportation, heating and industrial processes, will depend on the availability of low-cost renewable energy for electrolysis to generate green H₂.
It will also depend on the development and expansion of pipelines and other infrastructure to efficiently store, transport and dispense H₂.
Without the infrastructure, H₂ use won’t grow quickly. It’s a modern-day version of “Which came first, the chicken or the egg?” Continued use of fossil fuels for H₂ production could spur investment in H₂ infrastructure, but using fossil fuels releases greenhouse gases.
What does the future hold for hydrogen?
Although green and blue hydrogen projects are emerging, they are small so far.
Policies like Europe’s greenhouse gas emissions limits and the 2022 U.S. Inflation Reduction Act, which offers tax credits up to $3 per kilogram ($1.36 per pound) of H₂, could help make cleaner hydrogen more competitive.
Hydrogen demand is projected to increase up to two to four times its current level by 2050. For that to be green H₂ would require significant amounts of renewable energy at the same time that new solar, wind and other renewable energy power plants are being built to provide electricity directly to the power sector.
While green hydrogen is a promising trend, it is not the only solution to meeting the world’s energy needs and carbon-free energy goals. A combination of renewable energy sources and clean H₂, including blue, green or turquoise, will likely be necessary to meet the world’s energy needs in a sustainable way.![]()
About the Author:
Hannes van der Watt, Research Assistant Professor, University of North Dakota
This article is republished from The Conversation under a Creative Commons license. Read the original article.