
By RoboForex Analytical Department
Gold continues its impressive streak of gains for the fourth week in a row. At the beginning of this week, the price of a troy ounce of the precious metal is around 1,973 USD.
This increase in the price of gold indicates that the market is looking for a “safe haven” from the effects of the banking crisis, which remains one of the main threats to the global economy. In addition, the US Federal Reserve’s ambiguous stance on the future interest rate makes gold quite attractive to investors.
At the end of last week, the European banking sector came under pressure again, which caused an increase in anxiety in stock markets around the world. The concern was caused by the decline in the shares of the largest European bank Deutsche Bank.
Against the backdrop of this uncertainty, gold is again becoming a “safe haven” for the capital market, which makes it one of the most demanding investment assets in the face of economic uncertainty. Some analysts believe that the price of gold may continue to rise in the near future, until there is stability in the financial markets.
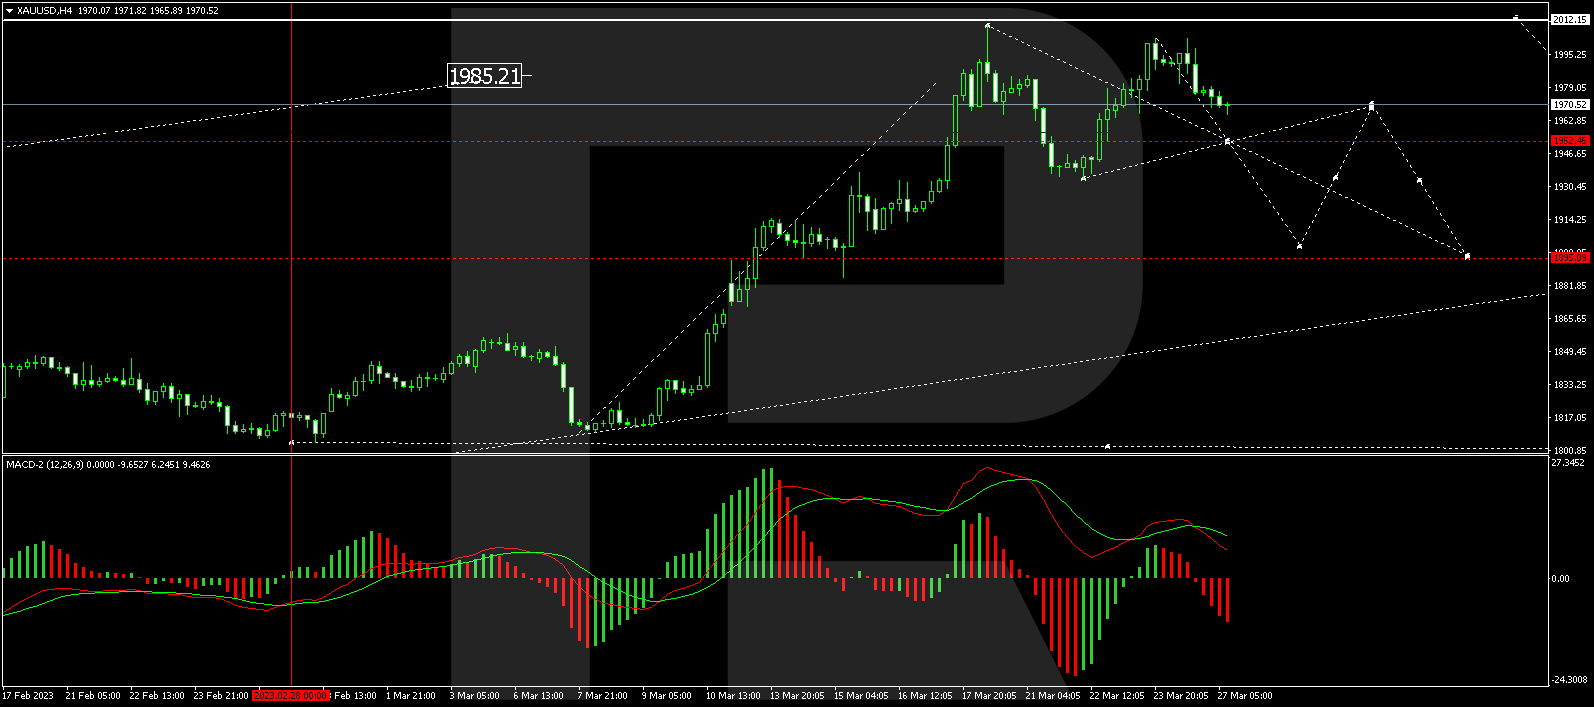
On H4, XAU/USD has performed an impulse of decline to 1934.24 and growth to 2003.30. At the moment, a consolidation range is forming at these levels. If the price breaks out of it downwards, a link of correction to 1895.00 might follow. If the price breaks through upwards, the wave might continue to 2012.12. Technically, this scenario is confirmed by the MACD. Its signal line is above zero, directed strictly down to renew the lows.
Free Reports:
 Sign Up for Our Stock Market Newsletter – Get updated on News, Charts & Rankings of Public Companies when you join our Stocks Newsletter
 Get our Weekly Commitment of Traders Reports - See where the biggest traders (Hedge Funds and Commercial Hedgers) are positioned in the futures markets on a weekly basis.
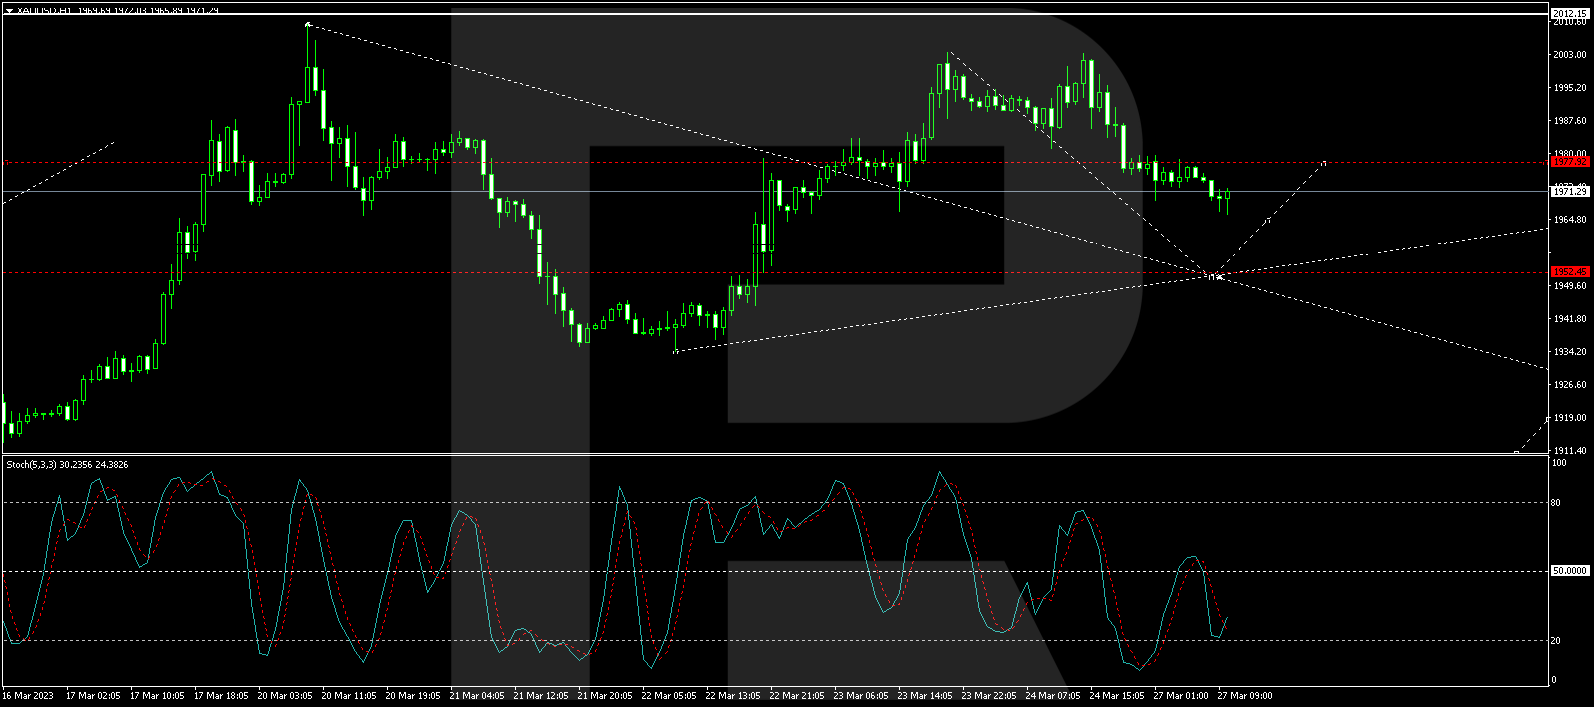
On H1, XAU/USD has performed a structure of decline to 1977.90. At the moment, a consolidation range is forming around it. With an escape from it downwards, the wave might continue to 1952.50. Then growth to 1977.90 might follow, and then — a decline to 1927.00. Technically, this scenario is confirmed by the Stochastic oscillator. Its signal line is above 20, aiming strictly upwards.
Disclaimer
Any forecasts contained herein are based on the author’s particular opinion. This analysis may not be treated as trading advice. RoboForex bears no responsibility for trading results based on trading recommendations and reviews contained herein.

- EUR/USD: Busy Week Ahead Aug 3, 2026
- Positive sentiment in the AI sector supported stock indices. Oil prices remain volatile Aug 3, 2026
- The Tech‑heavy NASDAQ Index jumped by more than 3.3%. The offshore yuan is trading at its highest level since 2023 Jul 31, 2026
- USD/JPY After Volatility: Multiple Events in One Day Jul 31, 2026
- The US indices sell off amid renewed US-Iran clashes. Oil jumps by 7% Jul 30, 2026
- USD/JPY Temporary in Equilibrium: Multiple Factors in Focus Jul 30, 2026
- GBP/USD at Month’s Lows: The Outlook Remains Weak Jul 29, 2026
- Crude oil falls below $80 per barrel. Australia sees inflation slowdown Jul 29, 2026
- The US Tech sector hit by sell‑off. Oil prices decline on renewed negotiations Jul 28, 2026
- Gold Declines, Focus on Fed and Falling Oil Prices Jul 28, 2026
