Source: Michael Ballanger (6/5/23)
Michael Ballanger of GGM Advisory Inc. takes a look at the precious metals and energy sector to tell you where he believes it is headed, as well as shares some stocks on his radar.
In a career that started on Bay Street in May/1977, I have been through every bear market since then, countless corrections, and the major crashes of 1987 (panic), 2001 (9/11), 2008 (GFC), and 2020 (Covid). There were also mini-crashes like the Asian Tigers’ blow-up in 1997 and the Long Term Capital Management vaporization in 1998 as well as a score of other scary little downdrafts that rattled one’s bones but of all of these supposedly life-altering events, it is the period of time after the crashes that stands out with vivid prominence, at least for me.
Muscle memory is quickly trained during crash events in a manner not unlike the cat that lands on the hot stove and screeches away, never to return. It has been said that the top performers in annual stock market trading contests are invariably ex-marines, and that is no surprise to me as I have learned (the very hard way) that emotion is one’s worst foe when dealing with money and markets.
Once a new generation of traders gets wiped out by a 2008 or 2020-style of market meltdown, they are quite reticent about plunging back in until many months, if not years, have passed. When I became a stock salesman in the 70s and started building my book, many of the people I would speak to were seniors in their 60s that bought only bonds because either a parent or a grandparent had been destroyed in the ’29 crash.
We tend to forget that it took a quarter of a century for the Dow Jones Industrials to surpass the 1929 highs, and in that period, the world experienced a global Depression that was indelibly etched in the minds and souls of all that were old enough to listen to the laments of parents and grandparents struggling to feed families.
Cognitive Dissonance

That post-Crash, post-Depression Era of 1929-1954 shaped the mindset of investors in a manner quite similar to how the Covid-19 pandemic (and subsequent monetary and fiscal stimulus responses) affected the behaviors of a new generation of investors and consumers with one very stark difference — since there we no social safety nets such as stimulus cheques or helicopter drops in the 1930s, our parents and grandparents were forced to get by on their own.
The government had no authority to do anything other than authorize large construction projects like the Civilian Works Administration and the Public Works Administration designed to create work for the needy, not handouts for the “inconvenienced” and certainly not bailouts.
The effort it took the North American continent to recover largely unaided from the Great Depression created a continental mindset of entrepreneurialism and independence, and as a result, it is no accident that the period of its greatest growth in living standards and household wealth occurred in the 1937-1966 period despite a world war that destroyed most of the European markets.
What arose was the “Greatest Generation,” known for resiliency and toughness AND for being the parents of the Babyboom Generation, whose dominance is only just now beginning to disappear into the annals of history. Generation X and Millennials have now grabbed the baton of influence and leadership and are instituting societal, economic, and consumption changes that would make my grandparents shudder (but that is a story for another day).
However, the markets are also changing in tandem with every 3% downturn considered a “crash” and a thirty-day pause from achieving news high a “crisis.”
Since the 1987 Crash, there has been a growing tendency for citizens to expect and government to provide a cushion against any type of adversity, be it economic or social. I first learned of it in the years after the ’87 Crash when Ronald Reagan oversaw the establishment of The Working Group on Capital Markets, which was designed to counteract any events that might lead to a threat to the financial system. I used to watch markets experiencing a late afternoon swoon (that was quite normal prior to 1987) suddenly turn on a dime at around 3:30 pm and move from down to up as if swept higher by an “invisible hand.”
Veteran gold aficionados like me have been suffering for years from cognitive dissonance where our expectations for precious metals is out of sync with what markets have been telling us.
We know now that it was the work of the legion of desk traders at the New York Fed carrying out orders from the higher-ups that sought to control “policy.”
Over the years, the practice of rescuing markets has undergone a metamorphosis whereby it is now fully expected. Gone are the days of FDR telling the poor that they had better “tough it out,” only to be replaced with billionaires like Bill Ackman begging the Fed to “DO SOMETHING!” because he was in danger of missing his P&L numbers for the quarter, as happened literally weeks ago in the midst of the regional banking crisis.
For decades before my arrival on Bay St., gold was always revered as a safe haven, and it continued in that manner until 2011, with the arrival of both cryptocurrencies and a new generation of youthful traders that found sanctuary in cannabis, crypto, meme, and SPAC stocks. Veteran gold aficionados like me have been suffering for years from cognitive dissonance where our expectations for precious metals is out of sync with what markets have been telling us.
Trading action late last week was a painful example of this, where expectations for a “breakaway move” in gold and silver were replaced with copper, oil, and the laggard cyclical stocks instead. The BLS reported a “blow-out” number of 339,000 new jobs, which caught everyone by surprise as expectations were mired at around 190,000.
Allowing the debt ceiling to be raised with the passage of the legislation earlier in the week and the sudden and unexpected creation of a torrent of new jobs are both anything but disinflationary, but precious metals still get bombed, so all metals traders can do is hope that the dip continues to be bought.
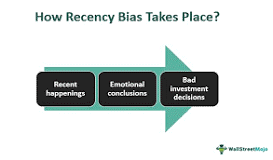
The tendency for traders to expect pressure on interest rates (up) and stocks (down) is a form of recency bias where past trading experiences mold one’s expectations for future market movements.
Every other time since late-2021 that a big NFP surprise happened, traders would sell both bonds and stocks with anticipation that the Fed would continue its hostile anti-inflation behavior.
Last Friday, markets decided to ignore the Fed and drove all asset classes that refused to participate in the 3-month, MAGMA-led rally (Microsoft, Apple, Google, Meta, and Amazon) higher, so the bears out there are now seriously underwater with hair on fire and P&L’s roasting on a spit.
I have been bullish since the October lows, albeit cautiously so until the January Barometer kicked in with a “BUY” signal giving the bulls an 83.3% probability of closing the year with a gain, the specter of which has the Twitterverse ablaze with indignation and protest.
Alas, it does not matter what the economy is doing or what the CASE index is telling us, or what Jerome Powell and Co. are saying: bad news in bear markets is bearish, while bad news in bull markets is bullish. Along similar thought lines, precious metals certainly did not deserve to be trashed into a booming jobs report because if job creation mattered in expanding the positive gap between interest rates and inflation, stock, and bonds should have been mauled – but they weren’t.
Allowing the debt ceiling to be raised with the passage of the legislation earlier in the week and the sudden and unexpected creation of a torrent of new jobs are both anything but disinflationary, but precious metals still get bombed, so all metals traders can do is hope that the dip continues to be bought.
Energy Select Sector
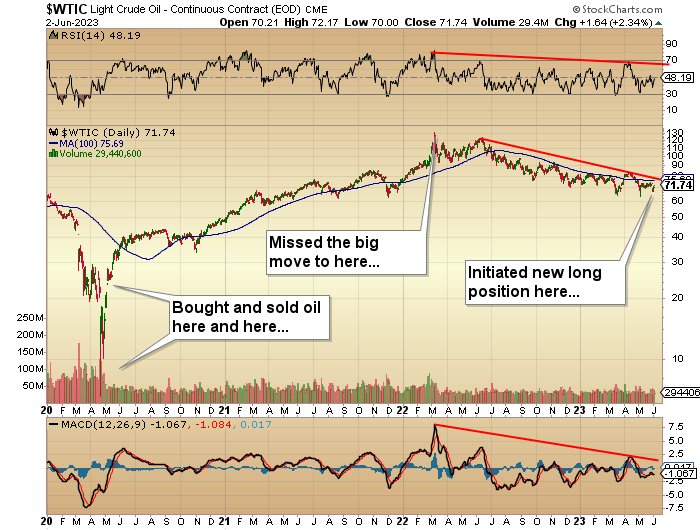
For the first time since the lows of April 2020, when crude oil futures settled at a negative US$37/bbl. sending oil traders straight to both their pharmacists and their psychiatrists on the same day, I initiated a long position in oil by way of the Energy Select Sector SPDR Fund (XLE:NYSEARC) on the last trading day of the month.
I sent a note to subscribers advising them of the move with the idea that these large professional investors (mostly hedge funds) would be throwing everything energy-related overboard before the end of May because the oil stocks have gone from “most-loved” to “most-hated” since the highs just after the Russian invasion of Ukraine sent oil screaming north of US$130/bbl.
Sure enough, oil futures went out on Wednesday at a seven-month low at US$67.32/bbl. and energy stocks joined the purge with the XLE trading down as well, such that by the closing bell, I felt like a little kid in a candy store with US$0.50 in my jeans (in 1960, of course).
I caught a superb discussion between Grant Williams (my favorite financial website) and Mike Rothman (Cornerstone Analytics) about oil prices, and I was absolutely captivated by the depth of knowledge contained in Mike’s bullish outlook for energy.
As a trader/investor, I tend to get bogged down staring at trees whilst forgetting about the forest such that my preoccupation with the electrification movement and lithium and copper has kept me from even glancing at oil and gas as a trading opportunity — UNTIL NOW.
Recency bias tends to make one assume that since oil has been declining by and large since the peak in March 2022 that it will continue to decline.
Well, after listening to the interview with Mike Rothman, I was hit with a sense of urgency because, luckily, it was on or about the 27 of the month that I heard it, and I just knew that with AI stocks dominating the landscape and with hedge funds inordinately short the S&P (and at risk of completely missing the rally) they had to scramble to cover shorts and liquidate losing longs and that is exactly what happened at month-end.
I am now long energy and see oil back at US$90/bbl. by year-end and the XLE at new highs above US$90.00 in the same time frame.
Global X Copper Miners
The other trade that leaped off the page was one of my favorite metals for the decade — copper — which has just undergone a major reversal of the downtrend that began in January with the close late week above US$3.70/lb. In the middle of last month, copper had a huge crash from US$3.90 to US$3.70 in one fell swoop as the “China resurgence” narrative sputtered, thus spooking the big global copper dealers and since then, which I picked off when it broke US$3.85, copper traded all the way down to US$3.548.
Once again, the narrative promulgated by pit traders and hedge funds alike was in complete contrast to the supply-demand metrics offered up by the major mining companies themselves that say unequivocally that if even a fraction of the demand for electricity materializes as the world moves away from fossil fuels, there will not be enough copper to fill that demand.
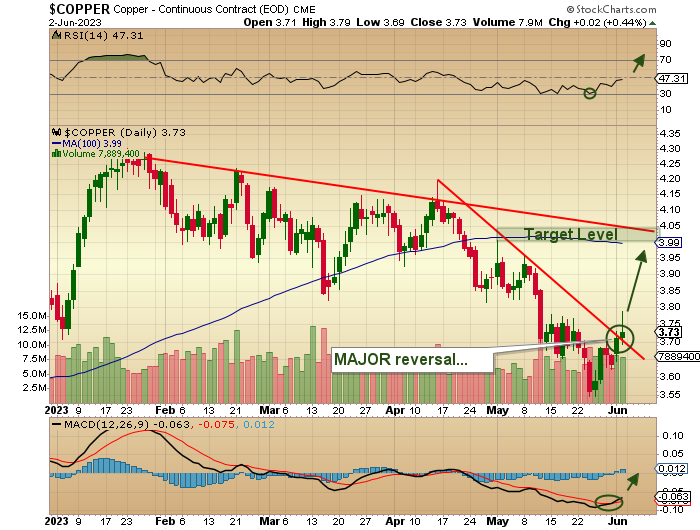
I issued a “BUY” on copper late last week, right after we bought into the energy trade, and I did that through the Global X Copper Miners ETF (COPX:NYSE).
It was no surprise to me that the action of an across-the-board expulsion of energy and copper would lead to an equal and opposite reaction after month-end, but nowhere did I expect a 4.27% bounce on COPX and a 3.04% bounce in the XLE.
Delightfully, that move in copper has now broken it out above a 7-week downtrend line while triggering a highly-bullish MACD crossover.
Accordingly, I have a short-term trading opportunity in copper within the context of a major secular bull market based upon dwindling global reserves and escalating global demand — which does not get any better for those of us that can ignore the AI noise and the tech mania that dominates the financial media these days.
I have a number of junior copper names that I sold a few months back that I will be reassessing and, once completed, will be firing off to subscribers forthwith.
Volt Lithium
I normally have a few paragraphs each week on gold and silver, and admittedly, they are usually profoundly bullish. That opinion is grounded in the ancient belief that precious metals will continue to act as portfolio anchors in a turbulent financial environment.
However, we just spent the better part of forty months in constant bombardment by central banks and government treasury departments implementing monetary and fiscal policies that should have taken gold to US$3,500/ounce and silver to over US$100/ounce.
However, for whatever reasons (and their conspiracy theorists are everywhere), prices at no time have appropriately reflected the actual demand/supply continuum as far as the U.S. dollar is concerned. This weekend I will refrain from commenting on (once again) being hijacked (“wronged”) by the bullion bank traders that can spoof the paper markets day in and day out and, when detected, pay a modest fine (“the cost of doing business”) yet continue to monkey-hammer gold and silver every time that might present a threat to U.S. dollar hegemony.
That is simply a reality in today’s world, and if one thinks that JP Morgan — the unofficial bank of the U.S. government — will ever be sanctioned in their efforts to contain precious metals pricing, you might as well take a sledgehammer to your big toe during a gout attack.
There was some positivity to the week in that I saw an event transpire that represents a rarity of sorts in the world of junior resources. I actually saw insiders of a junior lithium brine developer step up after a 42% correction and buy shares in their company stock. I have been (in one form or another) a shareholder of Volt Lithium Corp. (VLT:TSV;VLTLF:US) since 2021 as well as a few dozen other juniors, and this was the first time in ages that I have seen insiders step up to the plate.
What that does is instill confidence in the deal among the smaller shareholders, and while the dollar value of the transaction might appear inconsequential, it is the principle behind these transactions that counts. What I think or write about companies can be seen as “biased” or “talking my book,” but insider buying is where the rubber meets the road in the eyes of the minority shareholder.
It counts.
Now that equities have achieved escape velocity above the SPX 4,050-4,205 range that has confined them for most of 2023, I see capital flows moving back to the juniors that are front and center in the electrification movement and in the much-maligned energy space.
Important Disclosures:
- As of the date of this article, officers and/or employees of Streetwise Reports LLC (including members of their household) own securities of Volt Lithium.
- Michael Ballanger: I, or members of my immediate household or family, own securities of: All.
- Statements and opinions expressed are the opinions of the author and not of Streetwise Reports or its officers. The author is wholly responsible for the validity of the statements. The author was not paid by Streetwise Reports for this article. Streetwise Reports was not paid by the author to publish or syndicate this article. Streetwise Reports requires contributing authors to disclose any shareholdings in, or economic relationships with, companies that they write about. Streetwise Reports relies upon the authors to accurately provide this information and Streetwise Reports has no means of verifying its accuracy.
- This article does not constitute investment advice. Each reader is encouraged to consult with his or her individual financial professional. By opening this page, each reader accepts and agrees to Streetwise Reports’ terms of use and full legal disclaimer. This article is not a solicitation for investment. Streetwise Reports does not render general or specific investment advice and the information on Streetwise Reports should not be considered a recommendation to buy or sell any security. Streetwise Reports does not endorse or recommend the business, products, services or securities of any company.
For additional disclosures, please click here.
Michael Ballanger Disclosures
This letter makes no guarantee or warranty on the accuracy or completeness of the data provided. Nothing contained herein is intended or shall be deemed to be investment advice, implied or otherwise. This letter represents my views and replicates trades that I am making but nothing more than that. Always consult your registered advisor to assist you with your investments. I accept no liability for any loss arising from the use of the data contained on this letter. Options and junior mining stocks contain a high level of risk that may result in the loss of part or all invested capital and therefore are suitable for experienced and professional investors and traders only. One should be familiar with the risks involved in junior mining and options trading and we recommend consulting a financial adviser if you feel you do not understand the risks involved.