By InvestMacro
Here are the latest charts and statistics for the Commitment of Traders (COT) reports data published by the Commodities Futures Trading Commission (CFTC).
The latest COT data is updated through Tuesday June 6th and shows a quick view of how large traders (for-profit speculators and commercial entities) were positioned in the futures markets.
Weekly Speculator Changes led by Soybeans & Soybean Oil
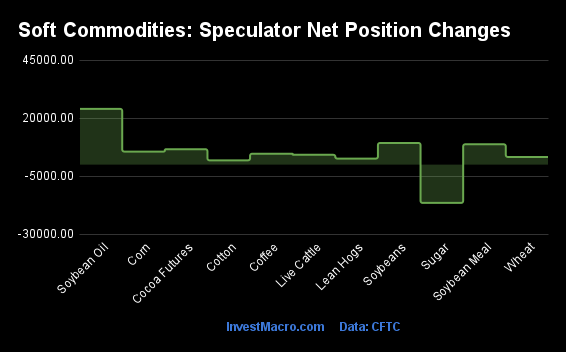
The COT soft commodities markets speculator bets were higher this week as ten out of the eleven softs markets we cover had higher positioning while the other one markets had lower speculator contracts.
Leading the gains for the softs markets was Soybean Oil (24,054 contracts) with Soybeans (9,341 contracts), Soybean Meal (8,784 contracts), Cocoa (6,661 contracts), Corn (5,636 contracts), Coffee (4,711 contracts), Live Cattle (4,243 contracts), Cotton (1,857 contracts), Lean Hogs (2,611 contracts) and Wheat (3,312 contracts) also showing positive weeks.
The market with the declines in speculator bets this week were Sugar (-16,519 contracts) with also registering lower bets on the week.
| Jun-06-2023 | OI | OI-Index | Spec-Net | Spec-Index | Com-Net | COM-Index | Smalls-Net | Smalls-Index |
|---|
| WTI Crude | 1,951,628 | 49 | 172,442 | 4 | -198,377 | 95 | 25,935 | 31 |
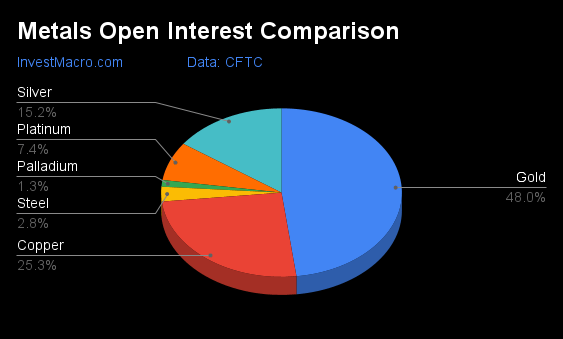
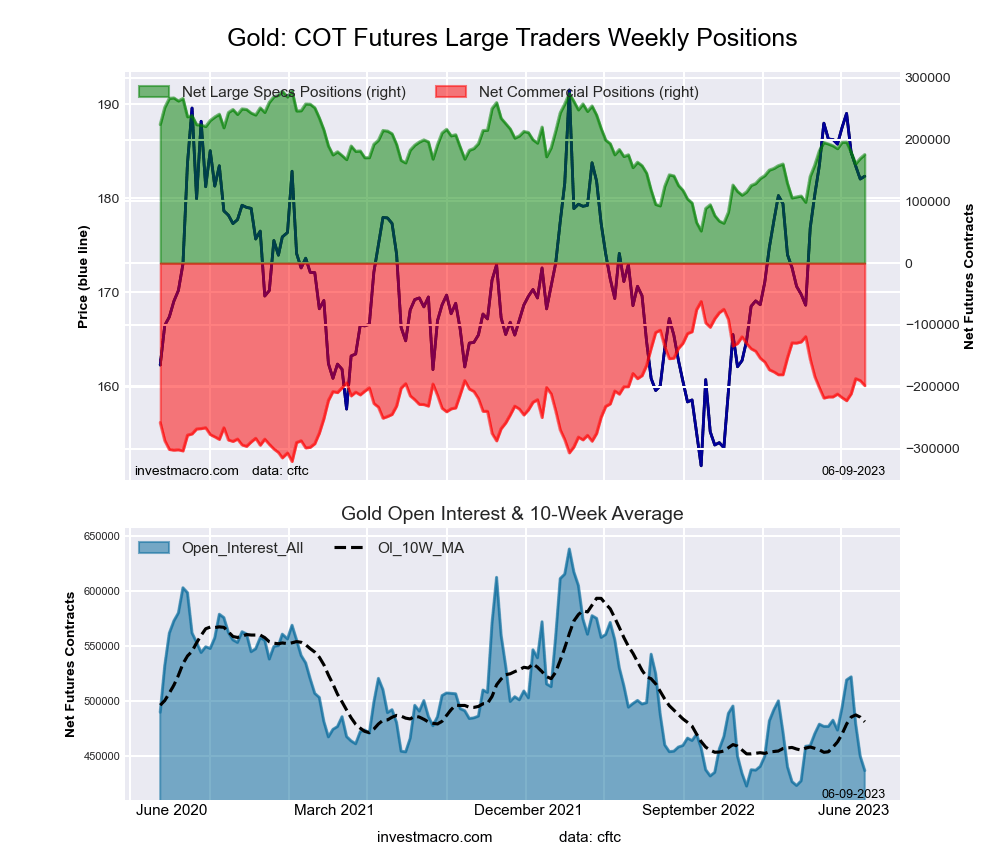
| Gold | 436,301 | 7 | 175,641 | 54 | -198,187 | 47 | 22,546 | 36 |
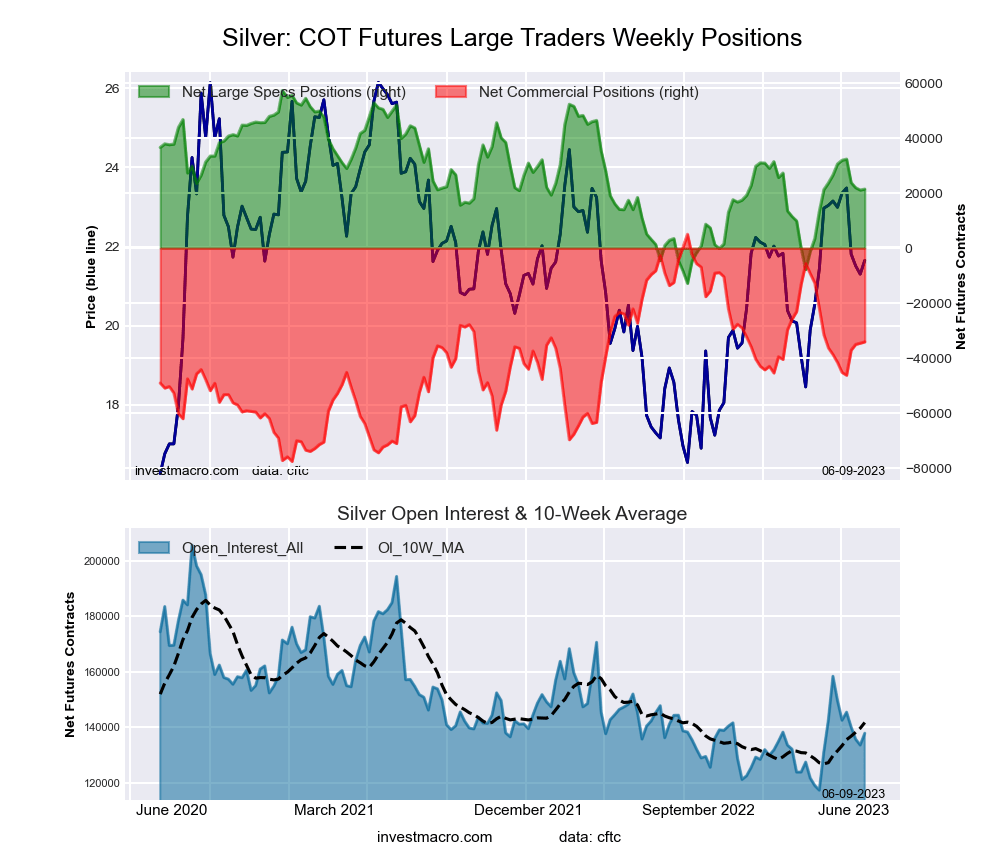
| Silver | 137,871 | 23 | 21,475 | 49 | -34,065 | 53 | 12,590 | 36 |
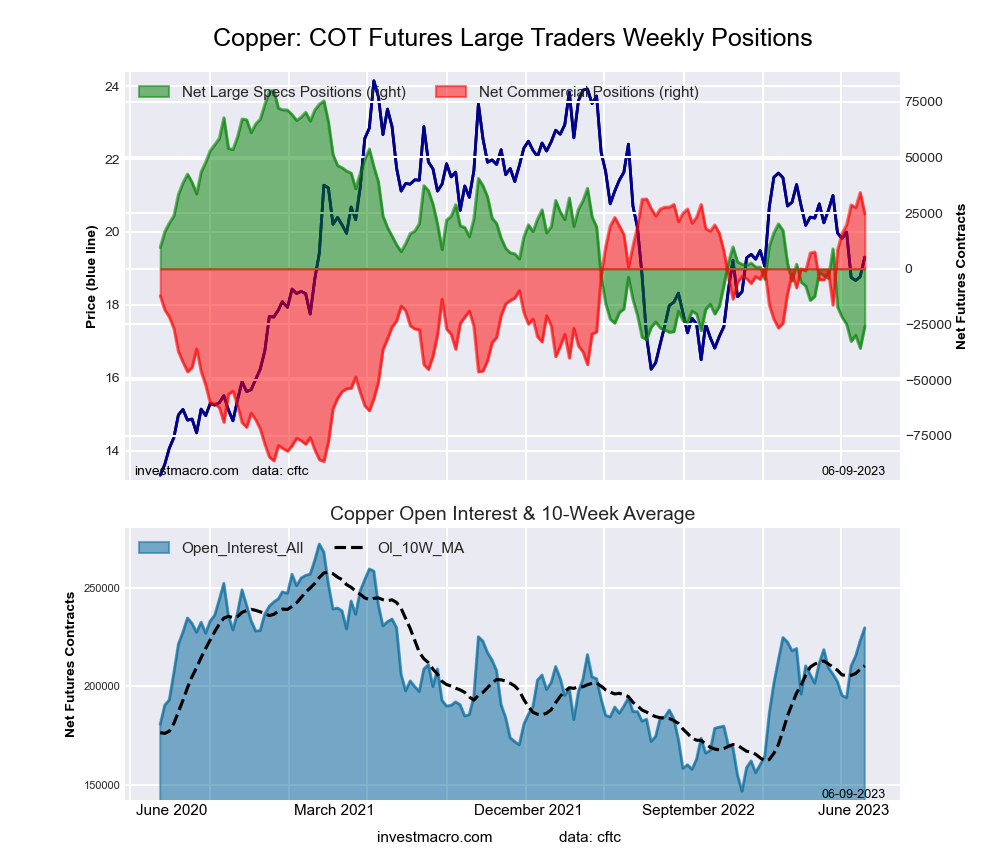
| Copper | 229,756 | 66 | -25,956 | 8 | 24,610 | 92 | 1,346 | 27 |
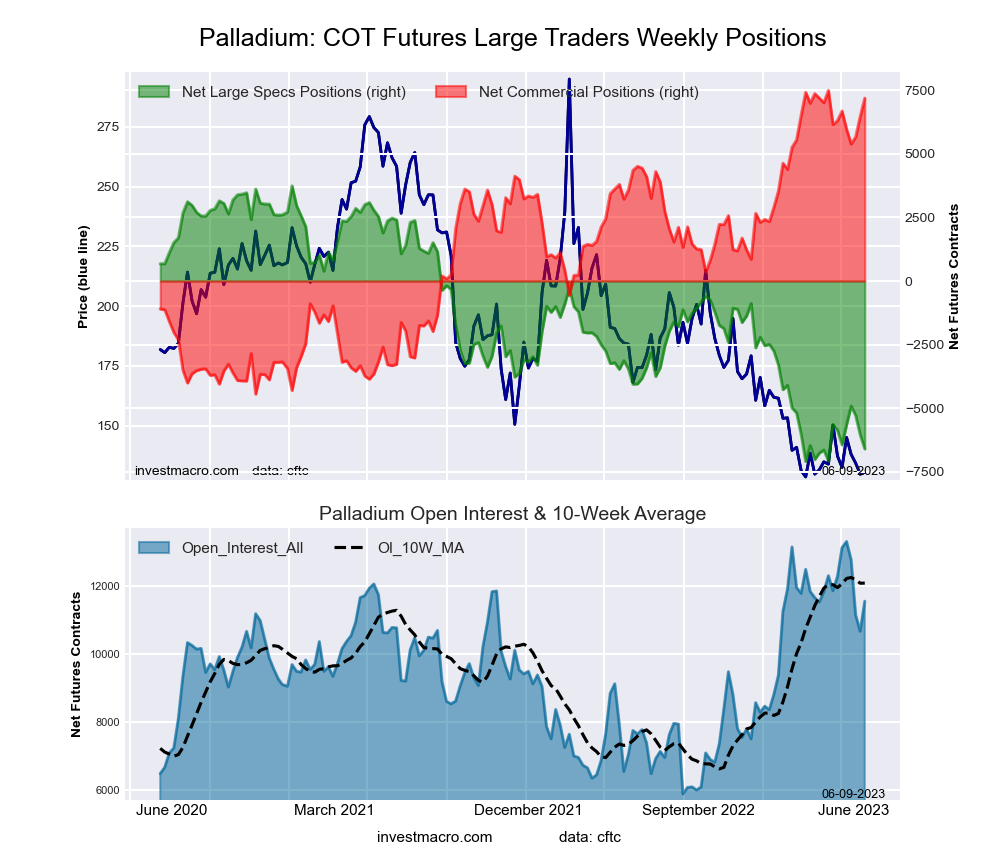
| Palladium | 11,541 | 76 | -6,602 | 5 | 7,192 | 97 | -590 | 6 |
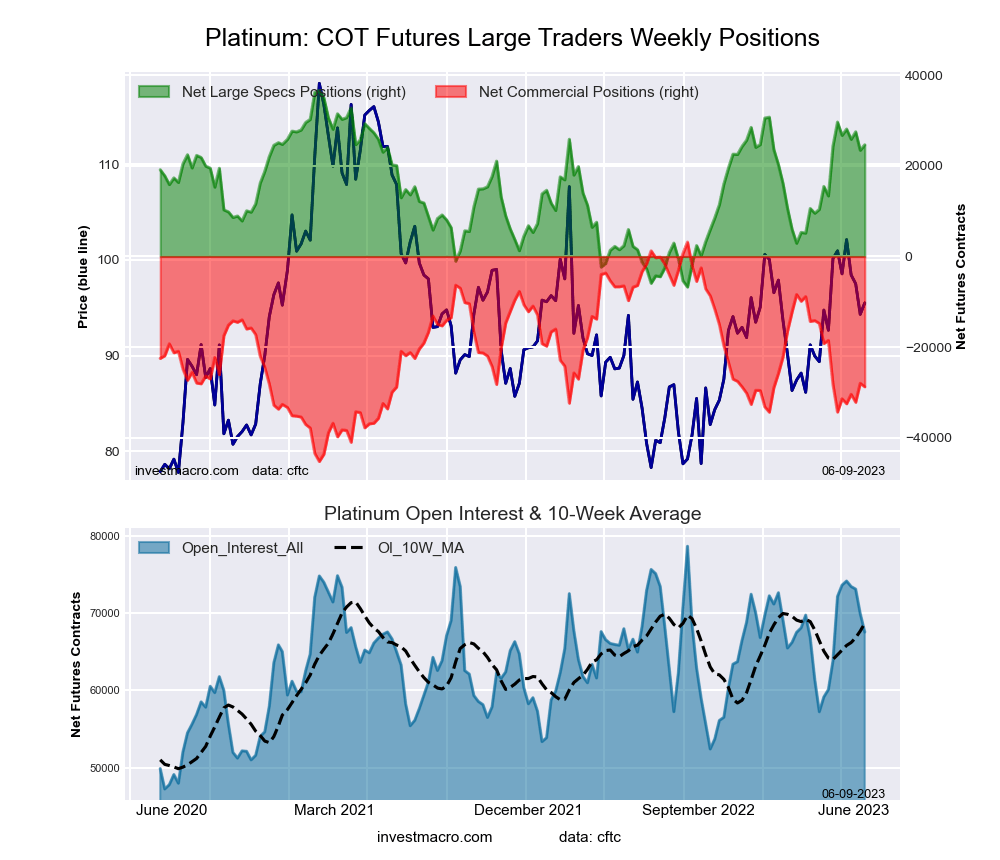
| Platinum | 67,537 | 65 | 24,613 | 72 | -28,747 | 34 | 4,134 | 24 |
| Natural Gas | 1,389,864 | 85 | -126,852 | 21 | 92,364 | 76 | 34,488 | 62 |
| Brent | 135,100 | 8 | -42,455 | 23 | 41,681 | 84 | 774 | 20 |
| Heating Oil | 307,550 | 39 | 21,277 | 66 | -28,835 | 61 | 7,558 | 25 |
| Soybeans | 669,123 | 21 | 39,155 | 5 | -16,089 | 91 | -23,066 | 36 |
| Corn | 1,322,137 | 17 | -14,771 | 27 | 66,120 | 82 | -51,349 | 26 |
| Coffee | 204,447 | 16 | 28,331 | 56 | -28,769 | 47 | 438 | 18 |
| Sugar | 1,021,535 | 75 | 233,868 | 74 | -278,395 | 25 | 44,527 | 61 |
| Wheat | 405,201 | 69 | -90,684 | 2 | 85,364 | 97 | 5,320 | 91 |
Strength Scores led by Cocoa & Live Cattle
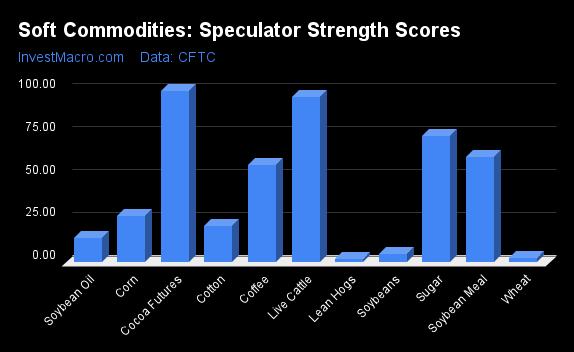
COT Strength Scores (a normalized measure of Speculator positions over a 3-Year range, from 0 to 100 where above 80 is Extreme-Bullish and below 20 is Extreme-Bearish) showed that Cocoa (100 percent) and Live Cattle (97 percent) lead the softs markets this week. Sugar (74 percent), Soybean Meal (62 percent) and Coffee (56 percent) come in as the next highest in the weekly strength scores.
On the downside, Lean Hogs (2 percent), Wheat (2 percent), Soybeans (5 percent) and the Soybean Oil (14 percent) come in at the lowest strength levels currently and are in Extreme-Bearish territory (below 20 percent).
Strength Statistics:
Corn (26.9 percent) vs Corn previous week (26.2 percent)
Sugar (73.6 percent) vs Sugar previous week (79.4 percent)
Coffee (56.5 percent) vs Coffee previous week (51.6 percent)
Soybeans (4.5 percent) vs Soybeans previous week (0.9 percent)
Soybean Oil (14.0 percent) vs Soybean Oil previous week (0.0 percent)
Soybean Meal (61.6 percent) vs Soybean Meal previous week (57.0 percent)
Live Cattle (96.5 percent) vs Live Cattle previous week (91.8 percent)
Lean Hogs (2.1 percent) vs Lean Hogs previous week (0.0 percent)
Cotton (21.1 percent) vs Cotton previous week (19.7 percent)
Cocoa (100.0 percent) vs Cocoa previous week (92.5 percent)
Wheat (2.4 percent) vs Wheat previous week (0.0 percent)
Cotton & Cocoa top the 6-Week Strength Trends
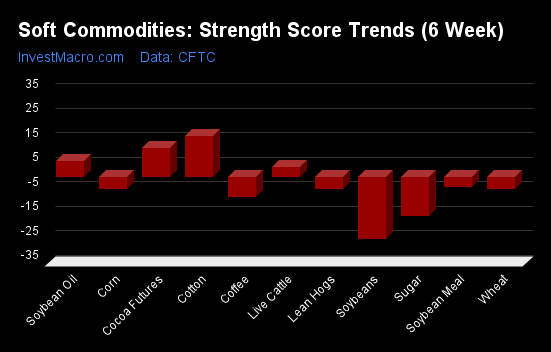
COT Strength Score Trends (or move index, calculates the 6-week changes in strength scores) showed that Cotton (16 percent) and Cocoa (12 percent) lead the past six weeks trends for soft commodities.
Soybeans (-26 percent) leads the downside trend scores currently with Sugar (-16 percent), Coffee (-8 percent) and Lean Hogs (-5 percent) following next with lower trend scores.
Strength Trend Statistics:
Corn (-5.1 percent) vs Corn previous week (-16.4 percent)
Sugar (-16.2 percent) vs Sugar previous week (-6.7 percent)
Coffee (-8.5 percent) vs Coffee previous week (-13.7 percent)
Soybeans (-25.5 percent) vs Soybeans previous week (-58.0 percent)
Soybean Oil (6.4 percent) vs Soybean Oil previous week (-12.6 percent)
Soybean Meal (-4.1 percent) vs Soybean Meal previous week (-18.6 percent)
Live Cattle (4.0 percent) vs Live Cattle previous week (-0.8 percent)
Lean Hogs (-5.3 percent) vs Lean Hogs previous week (-7.4 percent)
Cotton (16.5 percent) vs Cotton previous week (7.6 percent)
Cocoa (11.8 percent) vs Cocoa previous week (7.0 percent)
Wheat (-5.3 percent) vs Wheat previous week (-16.7 percent)
Individual Soft Commodities Markets:
CORN Futures:
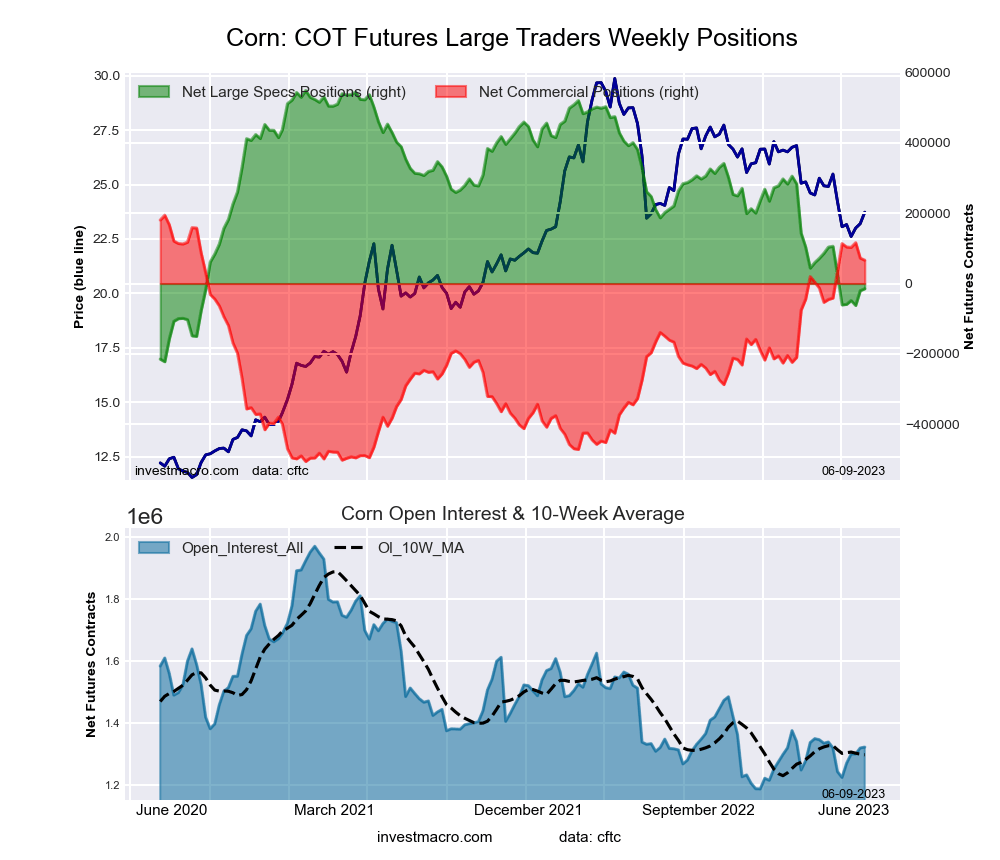 The CORN large speculator standing this week recorded a net position of -14,771 contracts in the data reported through Tuesday. This was a weekly lift of 5,636 contracts from the previous week which had a total of -20,407 net contracts.
This week’s current strength score (the trader positioning range over the past three years, measured from 0 to 100) shows the speculators are currently Bearish with a score of 26.9 percent. The commercials are Bullish-Extreme with a score of 81.7 percent and the small traders (not shown in chart) are Bearish with a score of 25.7 percent.
| CORN Futures Statistics | SPECULATORS | COMMERCIALS | SMALL TRADERS |
| – Percent of Open Interest Longs: | 20.3 | 50.8 | 8.9 |
| – Percent of Open Interest Shorts: | 21.4 | 45.8 | 12.8 |
| – Net Position: | -14,771 | 66,120 | -51,349 |
| – Gross Longs: | 268,763 | 672,074 | 117,595 |
| – Gross Shorts: | 283,534 | 605,954 | 168,944 |
| – Long to Short Ratio: | 0.9 to 1 | 1.1 to 1 | 0.7 to 1 |
| NET POSITION TREND: | | | |
| – Strength Index Score (3 Year Range Pct): | 26.9 | 81.7 | 25.7 |
| – Strength Index Reading (3 Year Range): | Bearish | Bullish-Extreme | Bearish |
| NET POSITION MOVEMENT INDEX: | | | |
| – 6-Week Change in Strength Index: | -5.1 | 4.5 | 6.9 |
SUGAR Futures:
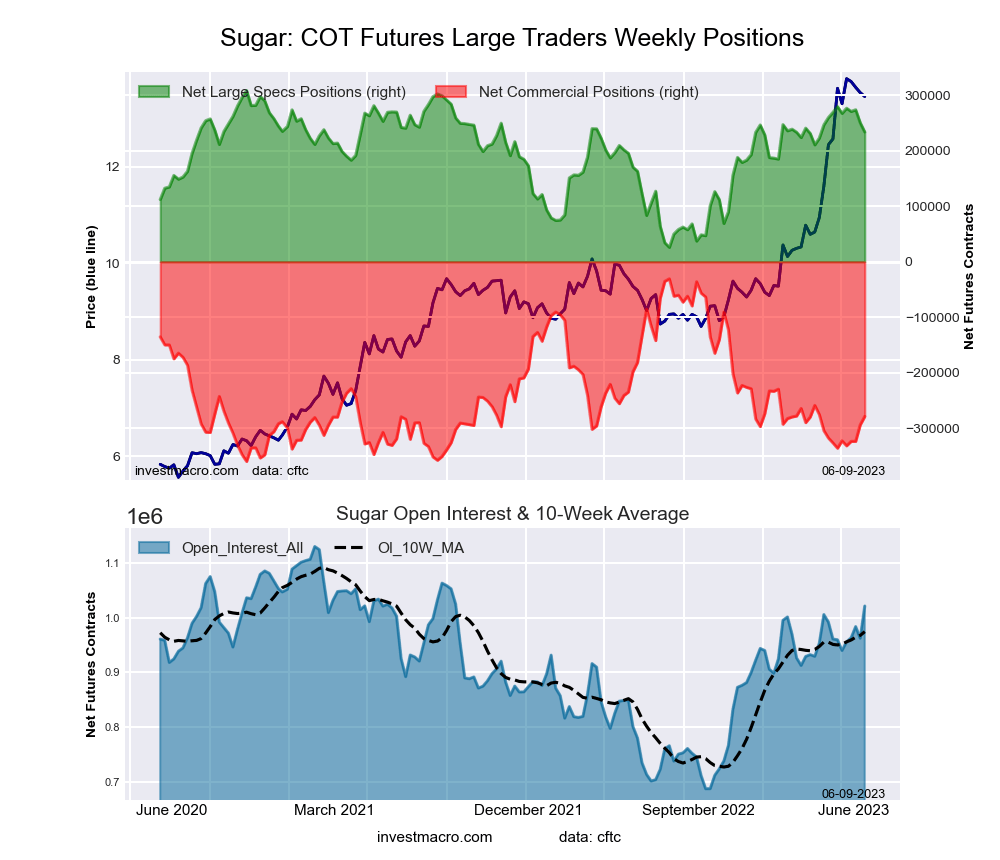 The SUGAR large speculator standing this week recorded a net position of 233,868 contracts in the data reported through Tuesday. This was a weekly lowering of -16,519 contracts from the previous week which had a total of 250,387 net contracts.
This week’s current strength score (the trader positioning range over the past three years, measured from 0 to 100) shows the speculators are currently Bullish with a score of 73.6 percent. The commercials are Bearish with a score of 24.7 percent and the small traders (not shown in chart) are Bullish with a score of 60.5 percent.
| SUGAR Futures Statistics | SPECULATORS | COMMERCIALS | SMALL TRADERS |
| – Percent of Open Interest Longs: | 31.0 | 42.7 | 9.1 |
| – Percent of Open Interest Shorts: | 8.1 | 70.0 | 4.7 |
| – Net Position: | 233,868 | -278,395 | 44,527 |
| – Gross Longs: | 316,809 | 436,281 | 92,941 |
| – Gross Shorts: | 82,941 | 714,676 | 48,414 |
| – Long to Short Ratio: | 3.8 to 1 | 0.6 to 1 | 1.9 to 1 |
| NET POSITION TREND: | | | |
| – Strength Index Score (3 Year Range Pct): | 73.6 | 24.7 | 60.5 |
| – Strength Index Reading (3 Year Range): | Bullish | Bearish | Bullish |
| NET POSITION MOVEMENT INDEX: | | | |
| – 6-Week Change in Strength Index: | -16.2 | 17.4 | -15.2 |
COFFEE Futures:
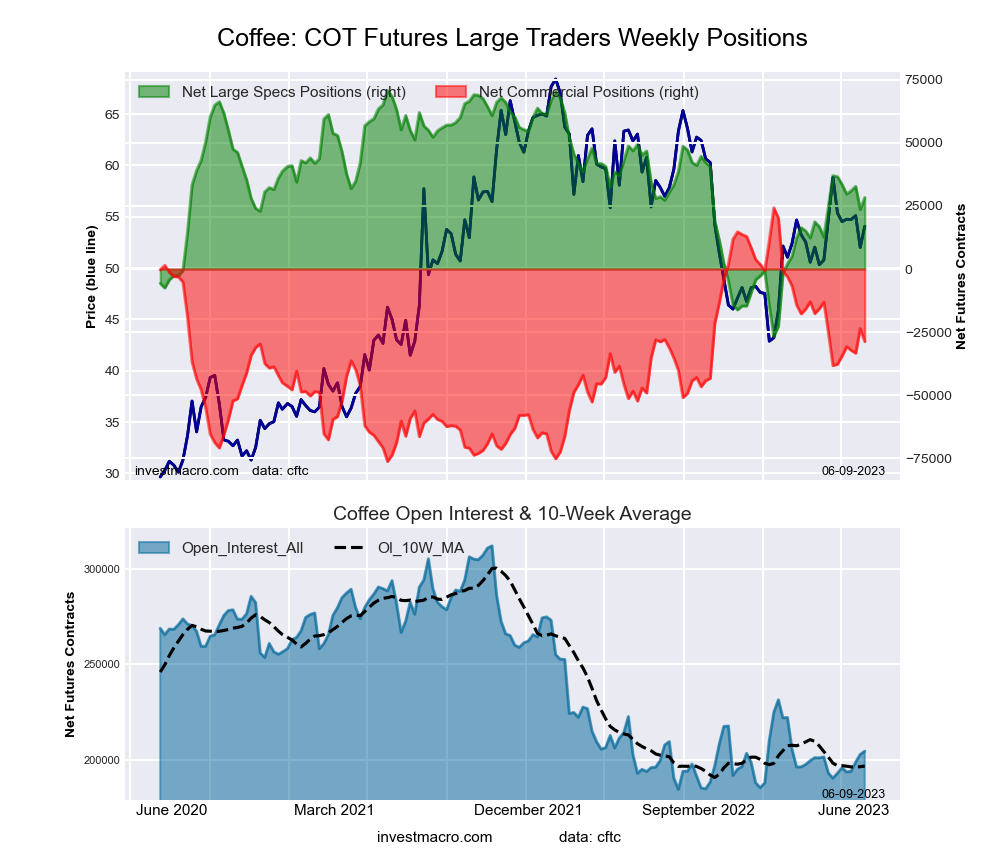 The COFFEE large speculator standing this week recorded a net position of 28,331 contracts in the data reported through Tuesday. This was a weekly increase of 4,711 contracts from the previous week which had a total of 23,620 net contracts.
This week’s current strength score (the trader positioning range over the past three years, measured from 0 to 100) shows the speculators are currently Bullish with a score of 56.5 percent. The commercials are Bearish with a score of 47.3 percent and the small traders (not shown in chart) are Bearish-Extreme with a score of 17.9 percent.
| COFFEE Futures Statistics | SPECULATORS | COMMERCIALS | SMALL TRADERS |
| – Percent of Open Interest Longs: | 24.1 | 44.4 | 3.6 |
| – Percent of Open Interest Shorts: | 10.2 | 58.4 | 3.4 |
| – Net Position: | 28,331 | -28,769 | 438 |
| – Gross Longs: | 49,241 | 90,686 | 7,356 |
| – Gross Shorts: | 20,910 | 119,455 | 6,918 |
| – Long to Short Ratio: | 2.4 to 1 | 0.8 to 1 | 1.1 to 1 |
| NET POSITION TREND: | | | |
| – Strength Index Score (3 Year Range Pct): | 56.5 | 47.3 | 17.9 |
| – Strength Index Reading (3 Year Range): | Bullish | Bearish | Bearish-Extreme |
| NET POSITION MOVEMENT INDEX: | | | |
| – 6-Week Change in Strength Index: | -8.5 | 8.9 | -8.2 |
SOYBEANS Futures:
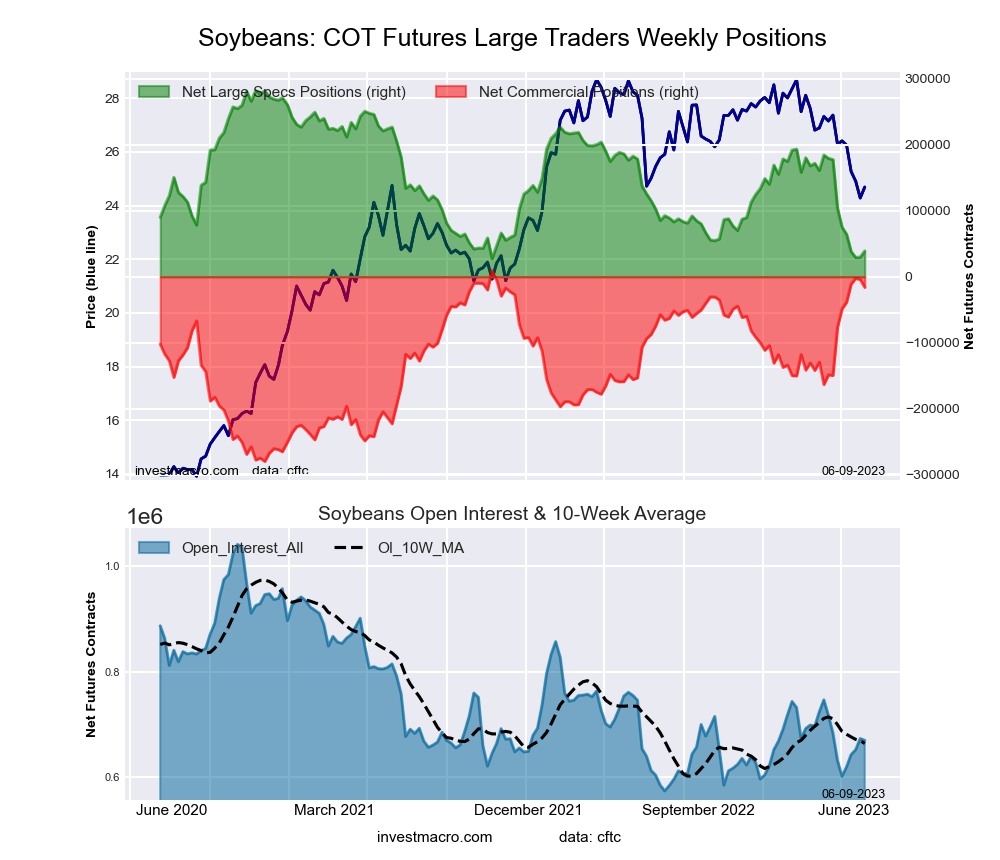 The SOYBEANS large speculator standing this week recorded a net position of 39,155 contracts in the data reported through Tuesday. This was a weekly boost of 9,341 contracts from the previous week which had a total of 29,814 net contracts.
This week’s current strength score (the trader positioning range over the past three years, measured from 0 to 100) shows the speculators are currently Bearish-Extreme with a score of 4.5 percent. The commercials are Bullish-Extreme with a score of 91.3 percent and the small traders (not shown in chart) are Bearish with a score of 36.4 percent.
| SOYBEANS Futures Statistics | SPECULATORS | COMMERCIALS | SMALL TRADERS |
| – Percent of Open Interest Longs: | 20.4 | 52.6 | 6.9 |
| – Percent of Open Interest Shorts: | 14.6 | 55.0 | 10.4 |
| – Net Position: | 39,155 | -16,089 | -23,066 |
| – Gross Longs: | 136,718 | 351,669 | 46,263 |
| – Gross Shorts: | 97,563 | 367,758 | 69,329 |
| – Long to Short Ratio: | 1.4 to 1 | 1.0 to 1 | 0.7 to 1 |
| NET POSITION TREND: | | | |
| – Strength Index Score (3 Year Range Pct): | 4.5 | 91.3 | 36.4 |
| – Strength Index Reading (3 Year Range): | Bearish-Extreme | Bullish-Extreme | Bearish |
| NET POSITION MOVEMENT INDEX: | | | |
| – 6-Week Change in Strength Index: | -25.5 | 20.9 | 8.2 |
SOYBEAN OIL Futures:
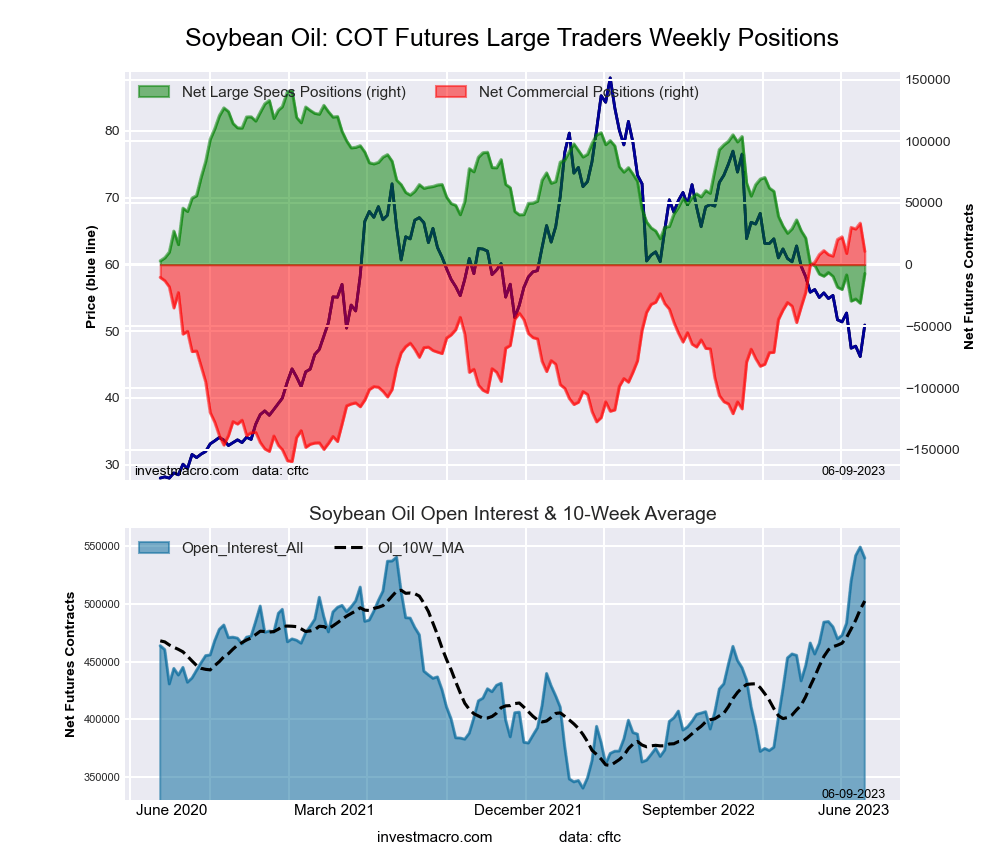 The SOYBEAN OIL large speculator standing this week recorded a net position of -7,194 contracts in the data reported through Tuesday. This was a weekly lift of 24,054 contracts from the previous week which had a total of -31,248 net contracts.
This week’s current strength score (the trader positioning range over the past three years, measured from 0 to 100) shows the speculators are currently Bearish-Extreme with a score of 14.0 percent. The commercials are Bullish-Extreme with a score of 88.2 percent and the small traders (not shown in chart) are Bearish-Extreme with a score of 0.0 percent.
| SOYBEAN OIL Futures Statistics | SPECULATORS | COMMERCIALS | SMALL TRADERS |
| – Percent of Open Interest Longs: | 15.6 | 58.0 | 5.6 |
| – Percent of Open Interest Shorts: | 16.9 | 56.0 | 6.2 |
| – Net Position: | -7,194 | 10,834 | -3,640 |
| – Gross Longs: | 84,021 | 312,922 | 30,043 |
| – Gross Shorts: | 91,215 | 302,088 | 33,683 |
| – Long to Short Ratio: | 0.9 to 1 | 1.0 to 1 | 0.9 to 1 |
| NET POSITION TREND: | | | |
| – Strength Index Score (3 Year Range Pct): | 14.0 | 88.2 | 0.0 |
| – Strength Index Reading (3 Year Range): | Bearish-Extreme | Bullish-Extreme | Bearish-Extreme |
| NET POSITION MOVEMENT INDEX: | | | |
| – 6-Week Change in Strength Index: | 6.4 | -5.0 | -5.5 |
SOYBEAN MEAL Futures:
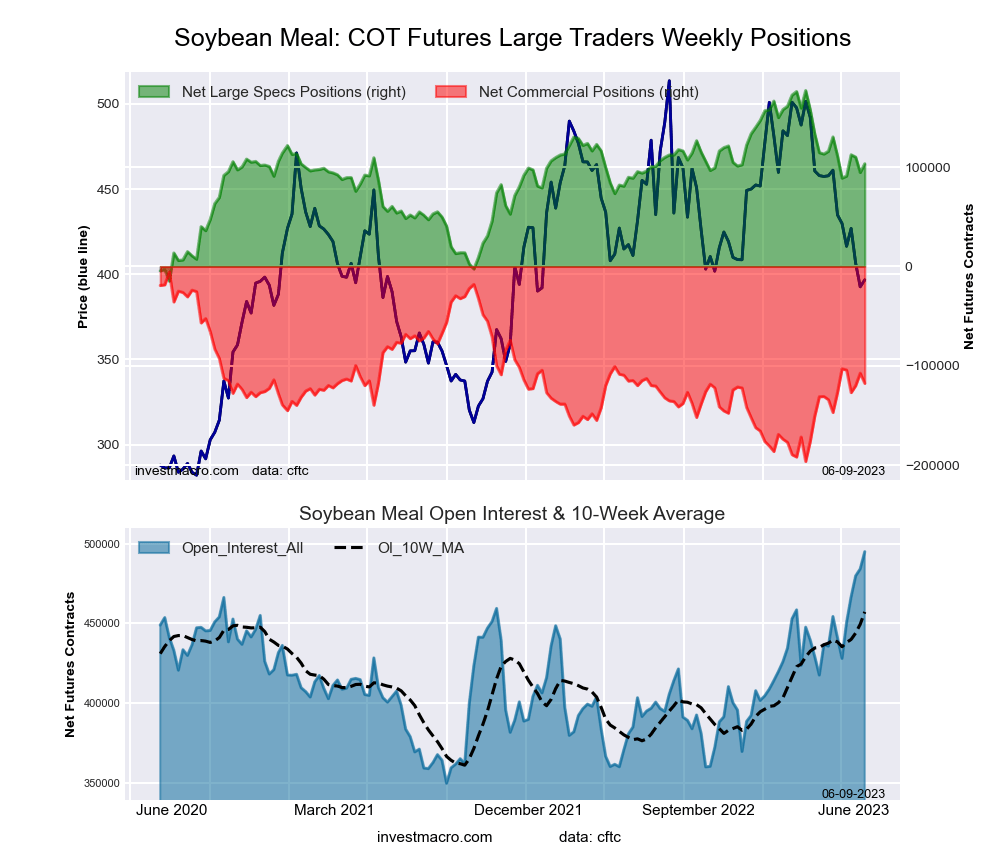 The SOYBEAN MEAL large speculator standing this week recorded a net position of 103,317 contracts in the data reported through Tuesday. This was a weekly boost of 8,784 contracts from the previous week which had a total of 94,533 net contracts.
This week’s current strength score (the trader positioning range over the past three years, measured from 0 to 100) shows the speculators are currently Bullish with a score of 61.6 percent. The commercials are Bearish with a score of 41.2 percent and the small traders (not shown in chart) are Bearish-Extreme with a score of 19.8 percent.
| SOYBEAN MEAL Futures Statistics | SPECULATORS | COMMERCIALS | SMALL TRADERS |
| – Percent of Open Interest Longs: | 26.5 | 37.5 | 9.7 |
| – Percent of Open Interest Shorts: | 5.6 | 61.3 | 6.8 |
| – Net Position: | 103,317 | -117,624 | 14,307 |
| – Gross Longs: | 131,273 | 185,802 | 47,980 |
| – Gross Shorts: | 27,956 | 303,426 | 33,673 |
| – Long to Short Ratio: | 4.7 to 1 | 0.6 to 1 | 1.4 to 1 |
| NET POSITION TREND: | | | |
| – Strength Index Score (3 Year Range Pct): | 61.6 | 41.2 | 19.8 |
| – Strength Index Reading (3 Year Range): | Bullish | Bearish | Bearish-Extreme |
| NET POSITION MOVEMENT INDEX: | | | |
| – 6-Week Change in Strength Index: | -4.1 | 4.8 | -5.6 |
LIVE CATTLE Futures:
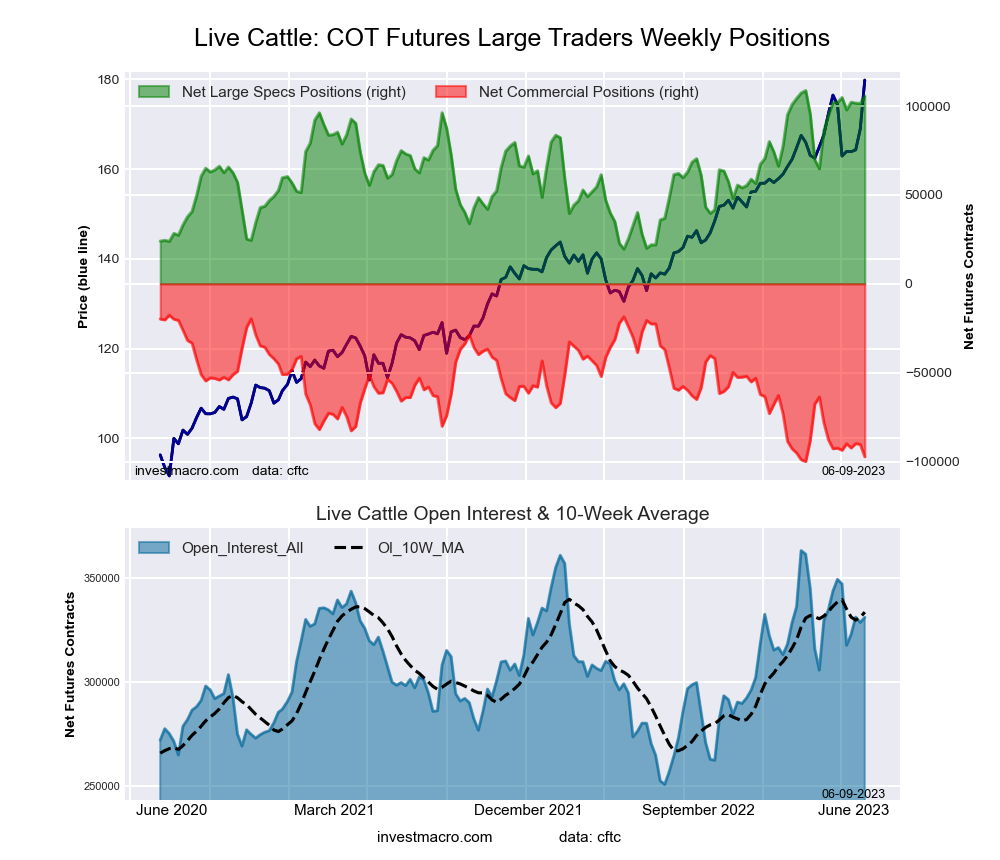 The LIVE CATTLE large speculator standing this week recorded a net position of 105,621 contracts in the data reported through Tuesday. This was a weekly advance of 4,243 contracts from the previous week which had a total of 101,378 net contracts.
This week’s current strength score (the trader positioning range over the past three years, measured from 0 to 100) shows the speculators are currently Bullish-Extreme with a score of 96.5 percent. The commercials are Bearish-Extreme with a score of 3.2 percent and the small traders (not shown in chart) are Bearish with a score of 43.2 percent.
| LIVE CATTLE Futures Statistics | SPECULATORS | COMMERCIALS | SMALL TRADERS |
| – Percent of Open Interest Longs: | 45.5 | 26.9 | 9.4 |
| – Percent of Open Interest Shorts: | 13.6 | 56.3 | 11.9 |
| – Net Position: | 105,621 | -97,322 | -8,299 |
| – Gross Longs: | 150,516 | 89,224 | 31,127 |
| – Gross Shorts: | 44,895 | 186,546 | 39,426 |
| – Long to Short Ratio: | 3.4 to 1 | 0.5 to 1 | 0.8 to 1 |
| NET POSITION TREND: | | | |
| – Strength Index Score (3 Year Range Pct): | 96.5 | 3.2 | 43.2 |
| – Strength Index Reading (3 Year Range): | Bullish-Extreme | Bearish-Extreme | Bearish |
| NET POSITION MOVEMENT INDEX: | | | |
| – 6-Week Change in Strength Index: | 4.0 | -5.9 | 7.1 |
LEAN HOGS Futures:
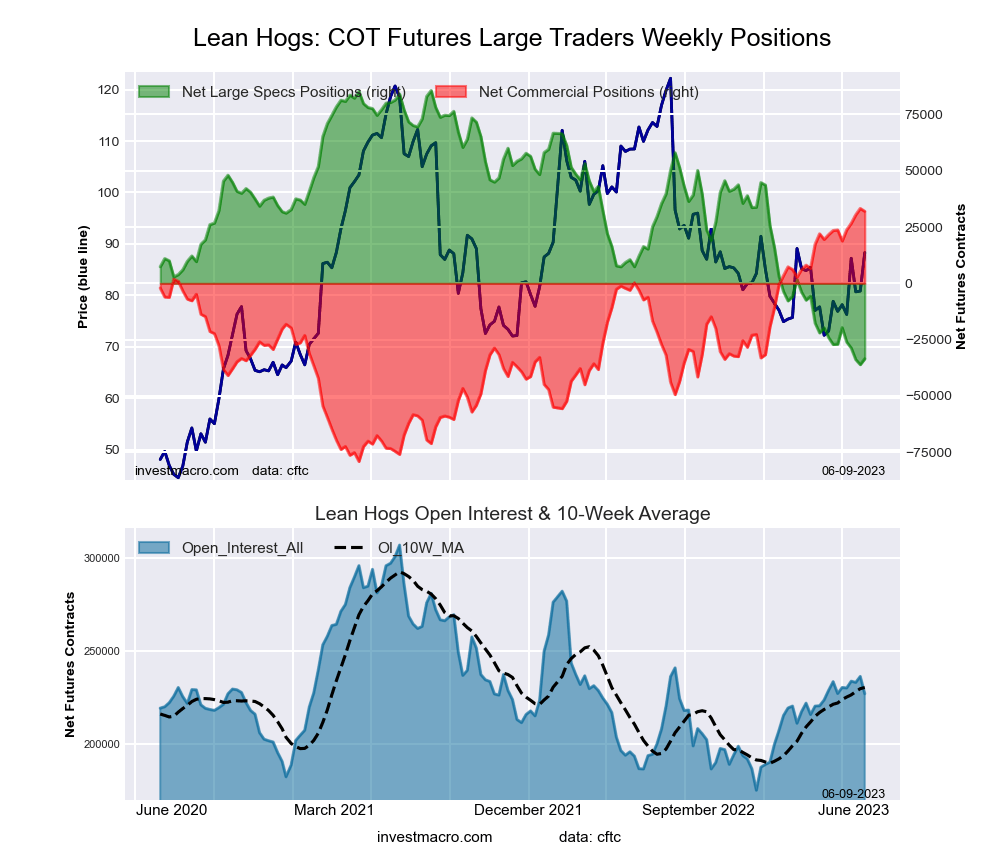 The LEAN HOGS large speculator standing this week recorded a net position of -33,503 contracts in the data reported through Tuesday. This was a weekly advance of 2,611 contracts from the previous week which had a total of -36,114 net contracts.
This week’s current strength score (the trader positioning range over the past three years, measured from 0 to 100) shows the speculators are currently Bearish-Extreme with a score of 2.1 percent. The commercials are Bullish-Extreme with a score of 98.9 percent and the small traders (not shown in chart) are Bullish-Extreme with a score of 90.3 percent.
| LEAN HOGS Futures Statistics | SPECULATORS | COMMERCIALS | SMALL TRADERS |
| – Percent of Open Interest Longs: | 24.6 | 39.1 | 9.5 |
| – Percent of Open Interest Shorts: | 39.4 | 25.1 | 8.8 |
| – Net Position: | -33,503 | 31,957 | 1,546 |
| – Gross Longs: | 55,832 | 88,831 | 21,583 |
| – Gross Shorts: | 89,335 | 56,874 | 20,037 |
| – Long to Short Ratio: | 0.6 to 1 | 1.6 to 1 | 1.1 to 1 |
| NET POSITION TREND: | | | |
| – Strength Index Score (3 Year Range Pct): | 2.1 | 98.9 | 90.3 |
| – Strength Index Reading (3 Year Range): | Bearish-Extreme | Bullish-Extreme | Bullish-Extreme |
| NET POSITION MOVEMENT INDEX: | | | |
| – 6-Week Change in Strength Index: | -5.3 | 7.4 | -8.0 |
COTTON Futures:
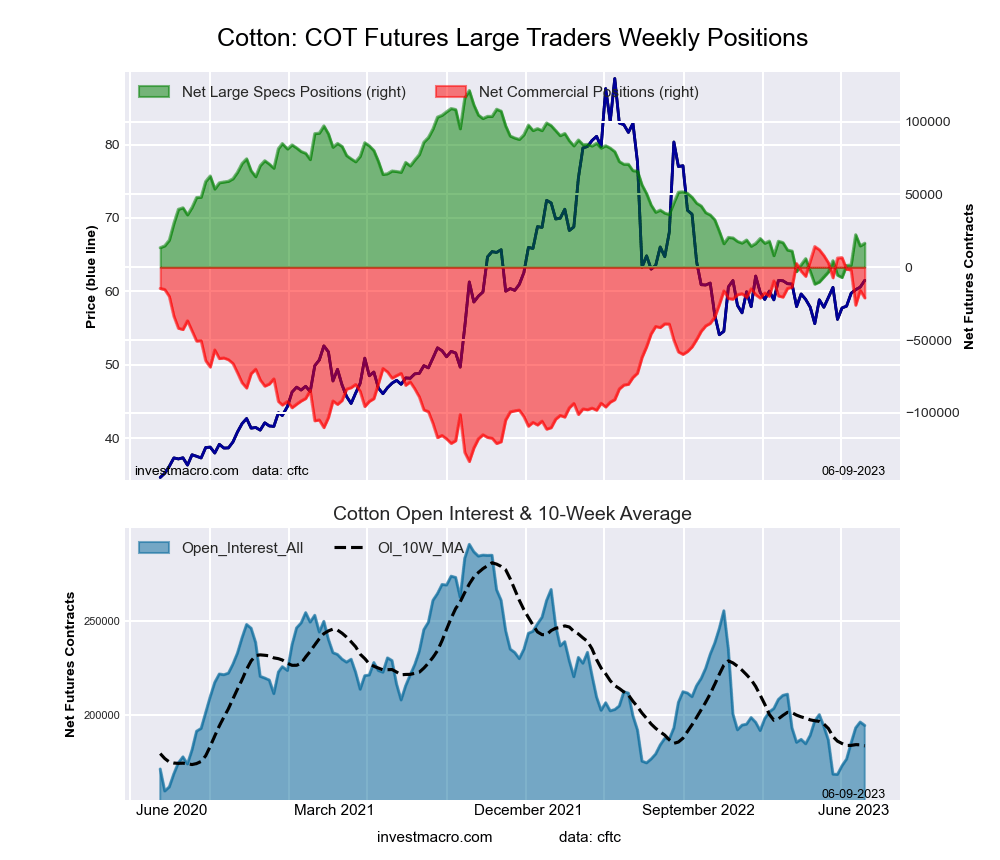 The COTTON large speculator standing this week recorded a net position of 16,469 contracts in the data reported through Tuesday. This was a weekly gain of 1,857 contracts from the previous week which had a total of 14,612 net contracts.
This week’s current strength score (the trader positioning range over the past three years, measured from 0 to 100) shows the speculators are currently Bearish with a score of 21.1 percent. The commercials are Bullish with a score of 76.1 percent and the small traders (not shown in chart) are Bearish with a score of 43.6 percent.
| COTTON Futures Statistics | SPECULATORS | COMMERCIALS | SMALL TRADERS |
| – Percent of Open Interest Longs: | 31.0 | 48.5 | 7.1 |
| – Percent of Open Interest Shorts: | 22.5 | 59.3 | 4.8 |
| – Net Position: | 16,469 | -21,021 | 4,552 |
| – Gross Longs: | 60,225 | 94,138 | 13,865 |
| – Gross Shorts: | 43,756 | 115,159 | 9,313 |
| – Long to Short Ratio: | 1.4 to 1 | 0.8 to 1 | 1.5 to 1 |
| NET POSITION TREND: | | | |
| – Strength Index Score (3 Year Range Pct): | 21.1 | 76.1 | 43.6 |
| – Strength Index Reading (3 Year Range): | Bearish | Bullish | Bearish |
| NET POSITION MOVEMENT INDEX: | | | |
| – 6-Week Change in Strength Index: | 16.5 | -18.5 | 33.1 |
COCOA Futures:
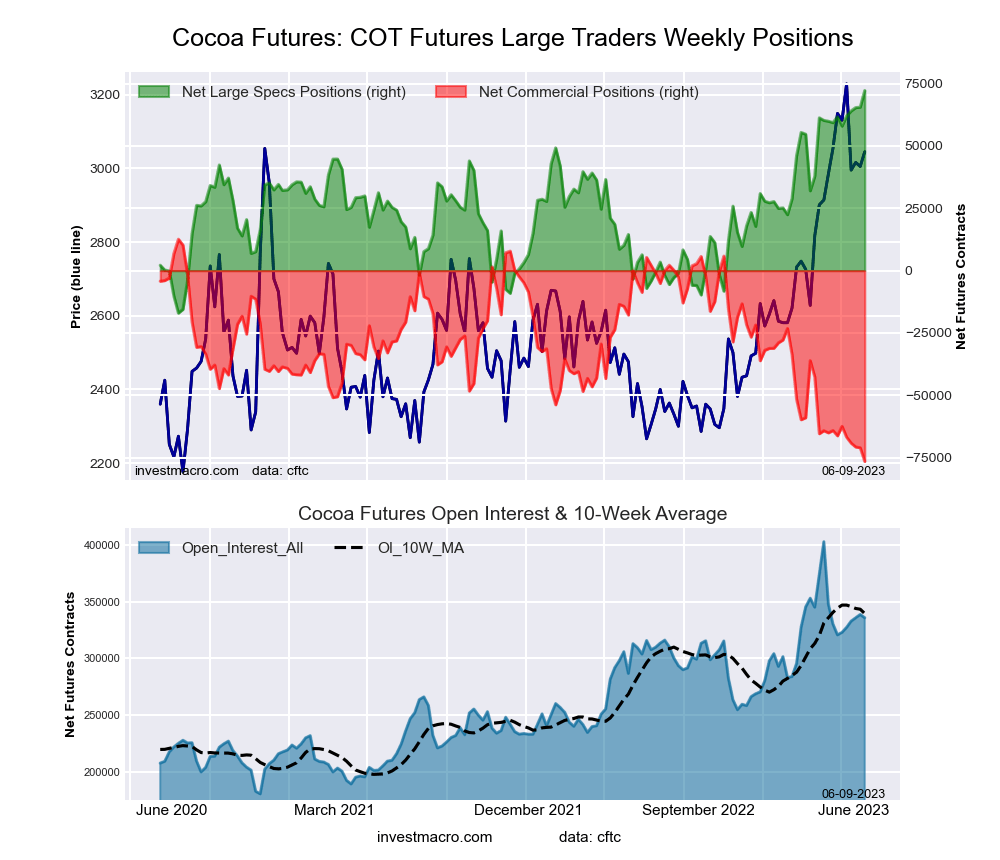 The COCOA large speculator standing this week recorded a net position of 72,234 contracts in the data reported through Tuesday. This was a weekly rise of 6,661 contracts from the previous week which had a total of 65,573 net contracts.
This week’s current strength score (the trader positioning range over the past three years, measured from 0 to 100) shows the speculators are currently Bullish-Extreme with a score of 100.0 percent. The commercials are Bearish-Extreme with a score of 0.0 percent and the small traders (not shown in chart) are Bearish with a score of 39.7 percent.
| COCOA Futures Statistics | SPECULATORS | COMMERCIALS | SMALL TRADERS |
| – Percent of Open Interest Longs: | 44.0 | 27.7 | 4.7 |
| – Percent of Open Interest Shorts: | 22.5 | 50.5 | 3.5 |
| – Net Position: | 72,234 | -76,549 | 4,315 |
| – Gross Longs: | 147,856 | 92,990 | 15,922 |
| – Gross Shorts: | 75,622 | 169,539 | 11,607 |
| – Long to Short Ratio: | 2.0 to 1 | 0.5 to 1 | 1.4 to 1 |
| NET POSITION TREND: | | | |
| – Strength Index Score (3 Year Range Pct): | 100.0 | 0.0 | 39.7 |
| – Strength Index Reading (3 Year Range): | Bullish-Extreme | Bearish-Extreme | Bearish |
| NET POSITION MOVEMENT INDEX: | | | |
| – 6-Week Change in Strength Index: | 11.8 | -11.6 | -2.2 |
WHEAT Futures:
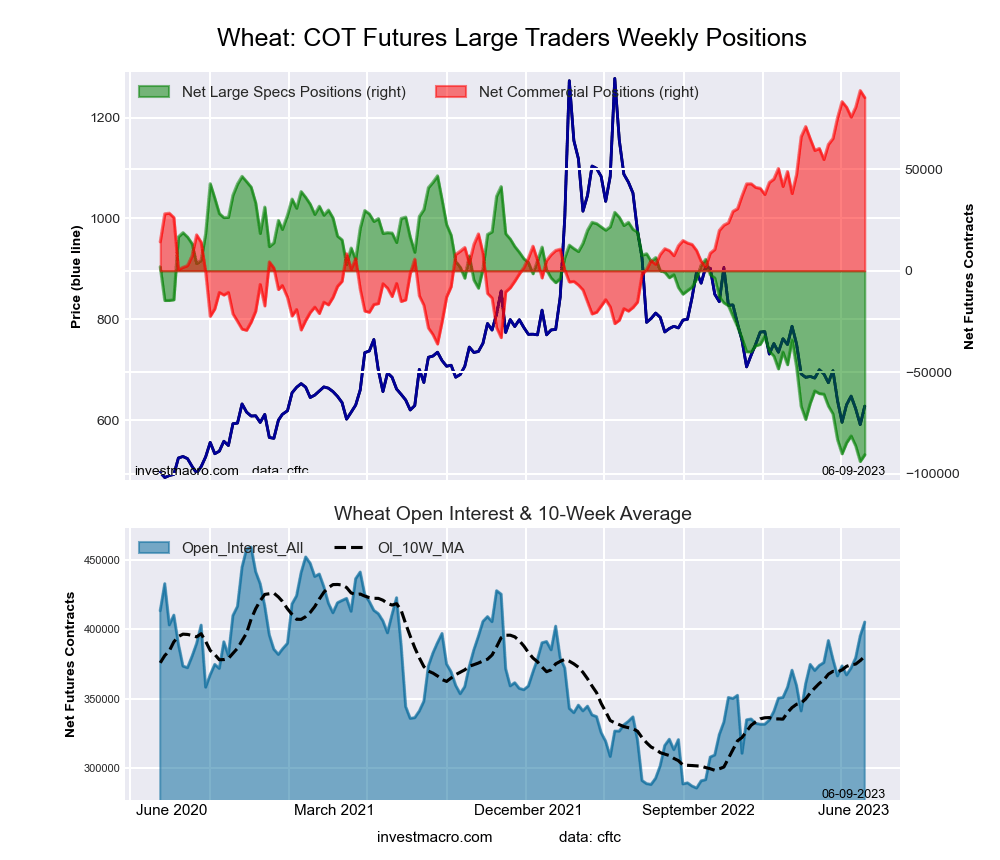 The WHEAT large speculator standing this week recorded a net position of -90,684 contracts in the data reported through Tuesday. This was a weekly rise of 3,312 contracts from the previous week which had a total of -93,996 net contracts.
This week’s current strength score (the trader positioning range over the past three years, measured from 0 to 100) shows the speculators are currently Bearish-Extreme with a score of 2.4 percent. The commercials are Bullish-Extreme with a score of 97.2 percent and the small traders (not shown in chart) are Bullish-Extreme with a score of 91.4 percent.
| WHEAT Futures Statistics | SPECULATORS | COMMERCIALS | SMALL TRADERS |
| – Percent of Open Interest Longs: | 26.4 | 39.1 | 10.1 |
| – Percent of Open Interest Shorts: | 48.7 | 18.0 | 8.8 |
| – Net Position: | -90,684 | 85,364 | 5,320 |
| – Gross Longs: | 106,834 | 158,400 | 40,861 |
| – Gross Shorts: | 197,518 | 73,036 | 35,541 |
| – Long to Short Ratio: | 0.5 to 1 | 2.2 to 1 | 1.1 to 1 |
| NET POSITION TREND: | | | |
| – Strength Index Score (3 Year Range Pct): | 2.4 | 97.2 | 91.4 |
| – Strength Index Reading (3 Year Range): | Bearish-Extreme | Bullish-Extreme | Bullish-Extreme |
| NET POSITION MOVEMENT INDEX: | | | |
| – 6-Week Change in Strength Index: | -5.3 | 8.0 | -8.6 |
Article By InvestMacro – Receive our weekly COT Newsletter
*COT Report: The COT data, released weekly to the public each Friday, is updated through the most recent Tuesday (data is 3 days old) and shows a quick view of how large speculators or non-commercials (for-profit traders) were positioned in the futures markets.
The CFTC categorizes trader positions according to commercial hedgers (traders who use futures contracts for hedging as part of the business), non-commercials (large traders who speculate to realize trading profits) and nonreportable traders (usually small traders/speculators) as well as their open interest (contracts open in the market at time of reporting). See CFTC criteria here.


