By ForexTime
- S&P 500 and Nasdaq 100 have seen double-digit gains respectively so far in 2023
- AI-mania and hopes for Fed rate cuts in 2024 have boosted US tech stocks
- Fed rate decision today could trigger big moves across the share market
In case you missed it, the US stock market has been soaring.
Consider the recent gains for these two benchmark equity indexes, used to measure how groups of US stocks are performing:
The S&P 500 has climbed by 13.8% so far this year.
The S&P 500 is an index which measures the overall share price performance of 500 leading US companies across various industries.
The Nasdaq 100 has surged by 36.2% year-to-date.
The Nasdaq 100 is an index that tracks the performance of 100 of the largest US non-financial stocks listed on the Nasdaq exchange.
Why have US stocks climbed?
1) AI-mania
“Artificial intelligence” is all the rage across stock markets now.
Despite the term “AI” having been coined since the 1950s, this latest craze was triggered by OpenAI’s November 2022 release of ChatGPT.
- Bloomberg Intelligence predicts that Generative AI could generate US$ 1.3 trillion (that’s $1,300,000,000,000) in revenue for the tech industry in 10 years.
- Bank of America’s recent survey shows that 40% of the polled 247 fund managers, who manage over US$700 billion in assets, believe that “widespread adoption of AI” will increase company profits within the next two years.
Nvidia is the best-performing stock on both the S&P 500 and the Nasdaq 100 so far in 2023!
Such feverish expectations have sent the likes of Nvidia soaring by 180% so far this year.
This company is now valued at over US$1 trillion (market cap), joining other Big Tech titans such as Apple, Microsoft, Alphabet (Google’s parent company), and Amazon in the Trillion-dollar club. Even Apple’s share price posted a new record high this past Monday, June 12th.
Hence, as the share prices of these huge companies soar, it boosts stock indexes such as the S&P 500 and the Nasdaq 100 (which is made up heavily of these tech stocks) along the way.
2) Federal Reserve may soon be done with interest rate hikes
First, note that markets are “forward looking” in nature. That means that today’s share price reflects tomorrow’s hopes.
Second, US stock markets generally fear the thought of US interest rates moving higher. Recall that US tech stocks in particular suffered a brutal 2022 as the Fed aggressively raised interest rates to cool down the highest inflation since the 80s.
Today, markets sense that the Federal Reserve a.k.a. the Fed (the US central bank) is almost done with its rate hikes, with a 71% chance given for one more 25-basis point hike in July.
On top of that, markets now think there’s a one-in-three chance that the Fed could CUT interest rates in early 2024.
Even FOMC members themselves (Fed officials on a special committee who vote on where to move interest rates) had projected back in March 2023 that there could be up to 75-basis points in rate cuts in 2024.
Hence, the share market (and tech stocks in particular) are rejoicing at the prospects of US interest rates being lowered (or at least not moving much higher from here) and are enjoying a brisk recovery after 2022’s massive selloff.
Can the likes of the S&P 500 and the Nasdaq 100 climb even higher?
It’s possible. At least Wall Street analysts believe so.
Over the next 12 months:
- The Nasdaq 100 is forecasted to reach 15,726, which is about 5.5% higher from current levels.
- The S&P 500 is forecasted to reach 4,784, which is about 5% higher from current levels.
However, these crucial factors need to remain in place through year-end and into 2024:
The AI-mania must continue attracting suitors who keep buying up US tech stocks
The Fed doesn’t keep raising interest rates much higher from here
Which brings us to the critical event for today (Wednesday, June 14th):
The Fed is due to announce its policy decision at 6:00PM GMT today.
Then 30 minutes later, Fed Chair Jerome Powell is set to answer live questions from journalists.
What to expect from today’s Fed decision?
The Fed is widely expected to hit the pause button today on its rate hike campaign that began in March 2022.
After this week, the US central bank is expected to trigger one final rate hike of 25-basis points perhaps in July.
An unexpected rate hike today would shock markets!
Ultimately, markets will be laser-focused on the Fed’s signals about future policy moves as contained within the FOMC policy statement, dot plot, and Chair Powell’s press conference.
For reference, here’s the Fed’s previous “dot plot” from March 2023, featuring FOMC members’ forecasts for US interest rates:

Here’s how the Fed could rock US stock markets today:
1) If the Fed suggests that rate hikes are almost over, that could see the S&P 500 and the Nasdaq 100 hop even higher.
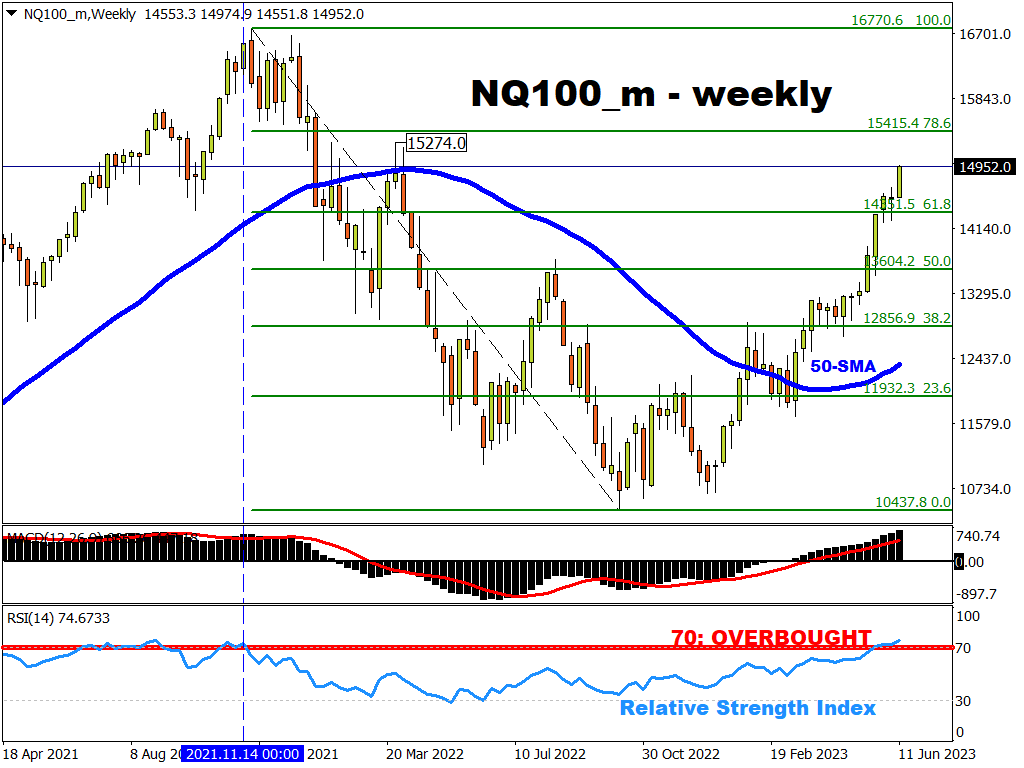
- The NQ100_m (which reflects the underlying Nasdaq 100 index) may then be pushed well above the psychologically-important 15,000 mark, and closer to the March 2022 peak of 15,274.
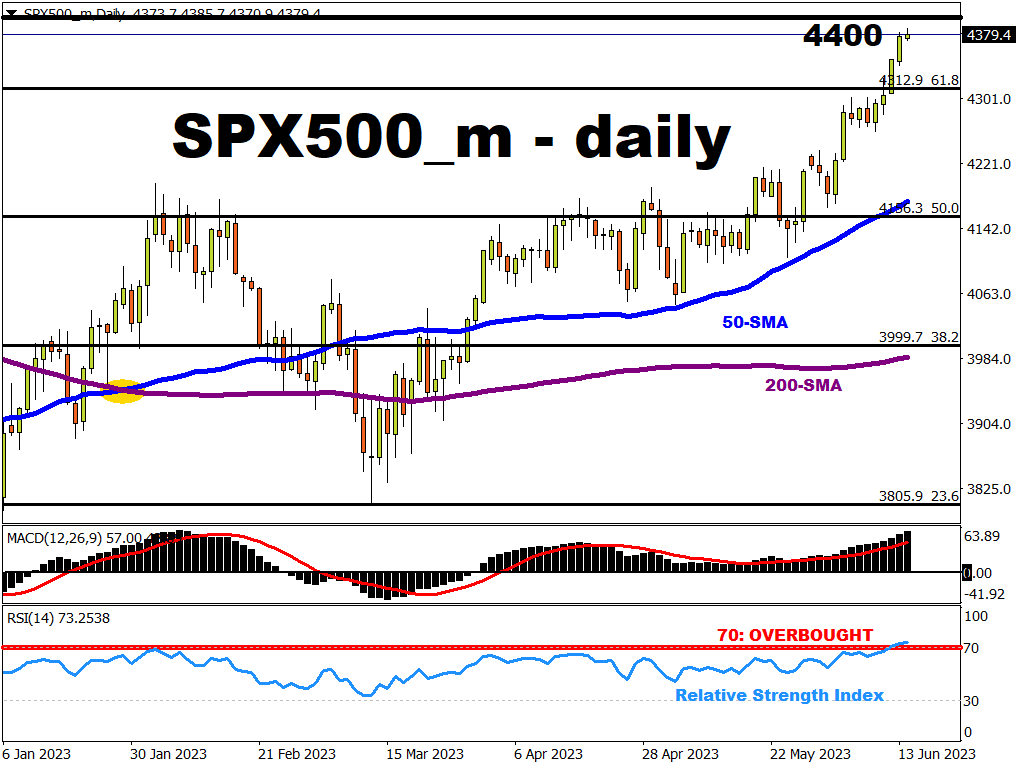
- The SPX500_m (which reflects the underlying S&P 500 index) may then be pushed past the psychologically-important 4,400 mark.
2) If the Fed suggests that interest rates have to move even higher than 5.5% (from 5% currently), that could force the stock market to pull back lower.
- The NQ100_m may then test support at the previous cycle high on the daily charts around 14,674.
- The SPX500_m may then unwind recent gains to test the 4,312.9 line, which is the 61.8% Fibonacci level from its 2022 peak-to-trough drop.
Beware of potential technical pullback
Note from the two charts above, both the SPX500_m (daily chart) and the NQ100_m (weekly chart) are both well into “overbought” territory.
The 14-day/week relative strength index (RSI) on the respective charts have broken above the 70 threshold.
This typically sends a signal that both the prices of these indices may see a temporary drop, at least to clear some froth after its latest surge.
Yet, from a fundamental perspective, all eyes still remain on the Fed’s incoming policy signals later today.
Open your MT4/5 charts and notice how the NQ100_m and the SPX500_m are little changed on the daily charts so far today.
After all, traders and investors worldwide are on tenterhooks ahead of such a pivotal event that could sway trillions of dollars across global financial markets.
What the Fed does/doesn’t say or do in just a few hours from now is set to have a massive influence on how much higher US share markets can keep climbing over the near-term.
 Article by ForexTime
ForexTime Ltd (FXTM) is an award winning international online forex broker regulated by CySEC 185/12 www.forextime.com