By InvestMacro
Here are the latest charts and statistics for the Commitment of Traders (COT) reports data published by the Commodities Futures Trading Commission (CFTC).
The latest COT data is updated through Tuesday November 28th and shows a quick view of how large traders (for-profit speculators and commercial hedgers) were positioned in the futures markets.
Weekly Speculator Changes led by 2-Year Bonds & 5-Year Bonds
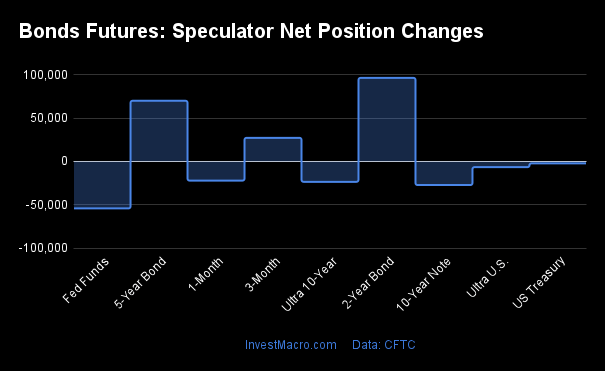
The COT bond market speculator bets were lower this week as three out of the eight bond markets we cover had higher positioning while the other five markets saw lower speculator contracts.
Leading the gains for the bond markets was the 2-Year Bonds (96,571 contracts) with the 5-Year Bonds (70,133 contracts) and the SOFR 3-Months (27,337 contracts) also having positive weeks.
The bond markets with declines for the week were the Fed Funds (-54,208 contracts), the 10-Year Bonds (-27,196 contracts), the Ultra 10-Year Bonds (-23,489 contracts), the Ultra Treasury Bonds (-6,522 contracts) and the US Treasury Bonds (-2,193 contracts).
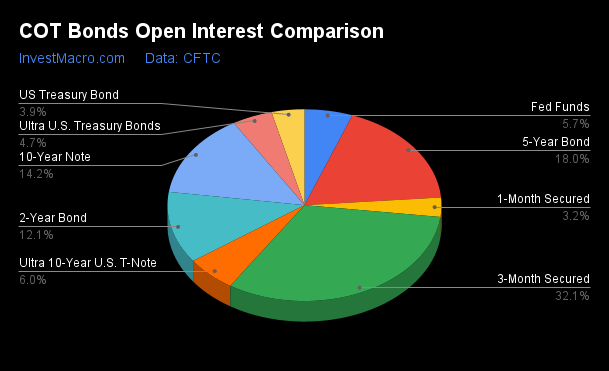
| Nov-28-2023 | OI | OI-Index | Spec-Net | Spec-Index | Com-Net | COM-Index | Smalls-Net | Smalls-Index |
|---|
| SOFR-3-Months | 10,837,439 | 100 | 527,237 | 100 | -525,306 | 0 | -1,931 | 87 |
| FedFunds | 1,917,677 | 82 | -203,490 | 25 | 220,167 | 77 | -16,677 | 58 |
| 2-Year | 4,080,415 | 95 | -1,288,831 | 11 | 1,141,440 | 87 | 147,391 | 100 |
| Long T-Bond | 1,308,135 | 62 | -102,176 | 48 | 51,573 | 30 | 50,603 | 85 |
| 10-Year | 4,775,113 | 90 | -685,354 | 16 | 632,924 | 82 | 52,430 | 85 |
| 5-Year | 6,081,130 | 97 | -1,398,500 | 4 | 1,250,881 | 94 | 147,619 | 99 |
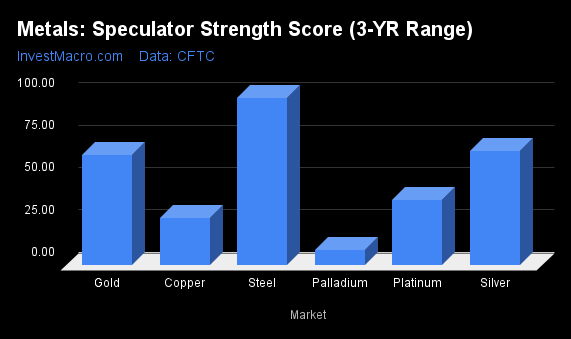
Strength Scores led by SOFR 3-Months & Ultra Treasury Bonds
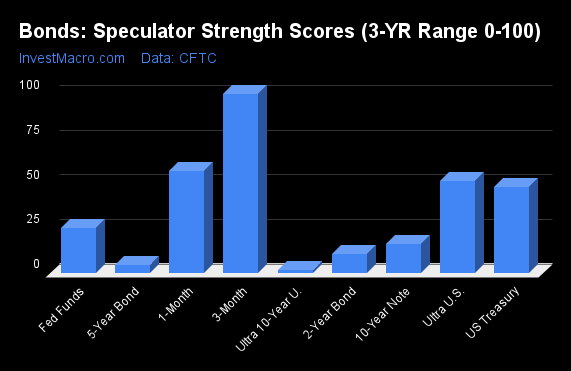
COT Strength Scores (a normalized measure of Speculator positions over a 3-Year range, from 0 to 100 where above 80 is Extreme-Bullish and below 20 is Extreme-Bearish) showed that the SOFR 3-Months (100 percent) leads the bond markets this week. The Ultra Treasury Bonds (51 percent) and the US Treasury Bonds (48 percent) come in as the next highest in the weekly strength scores.
On the downside, the Ultra 10-Year Bonds (1 percent), the 5-Year Bonds (4 percent), the 2-Year Bonds (11 percent) and the 10-Year Bonds (16 percent) come in at the lowest strength levels currently and are in Extreme-Bearish territory (below 20 percent).
Strength Statistics:
Fed Funds (25.1 percent) vs Fed Funds previous week (36.7 percent)
2-Year Bond (10.7 percent) vs 2-Year Bond previous week (4.4 percent)
5-Year Bond (4.5 percent) vs 5-Year Bond previous week (0.0 percent)
10-Year Bond (16.0 percent) vs 10-Year Bond previous week (18.6 percent)
Ultra 10-Year Bond (1.4 percent) vs Ultra 10-Year Bond previous week (5.8 percent)
US Treasury Bond (47.9 percent) vs US Treasury Bond previous week (48.7 percent)
Ultra US Treasury Bond (51.4 percent) vs Ultra US Treasury Bond previous week (54.0 percent)
SOFR 3-Months (100.0 percent) vs SOFR 3-Months previous week (98.4 percent)
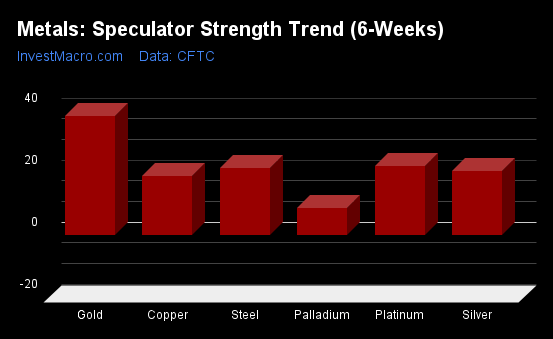
US Treasury Bonds & Fed Funds top the 6-Week Strength Trends
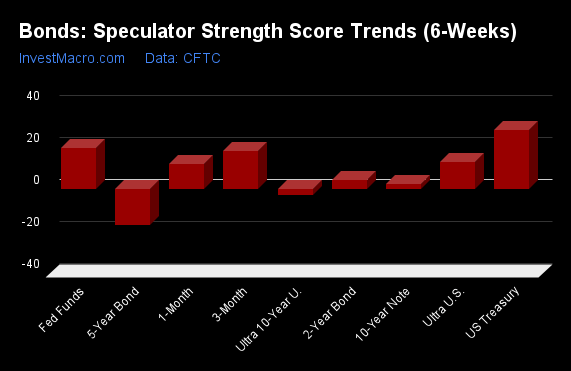
COT Strength Score Trends (or move index, calculates the 6-week changes in strength scores) showed that the US Treasury Bonds (28 percent) and the Fed Funds (20 percent) lead the past six weeks trends for bonds. The SOFR 3-Months (18 percent) and the are the next highest positive movers in the latest trends data.
The 5-Year Bonds (-17 percent) and the Ultra 10-Year Bonds (-3 percent) leads the downside trend scores currently.
Strength Trend Statistics:
Fed Funds (19.7 percent) vs Fed Funds previous week (19.7 percent)
2-Year Bond (4.3 percent) vs 2-Year Bond previous week (-4.7 percent)
5-Year Bond (-17.1 percent) vs 5-Year Bond previous week (-23.4 percent)
10-Year Bond (2.5 percent) vs 10-Year Bond previous week (5.3 percent)
Ultra 10-Year Bond (-3.1 percent) vs Ultra 10-Year Bond previous week (3.6 percent)
US Treasury Bond (28.0 percent) vs US Treasury Bond previous week (37.1 percent)
Ultra US Treasury Bond (13.0 percent) vs Ultra US Treasury Bond previous week (17.6 percent)
SOFR 3-Months (18.1 percent) vs SOFR 3-Months previous week (13.1 percent)
Secured Overnight Financing Rate (3-Month) Futures:
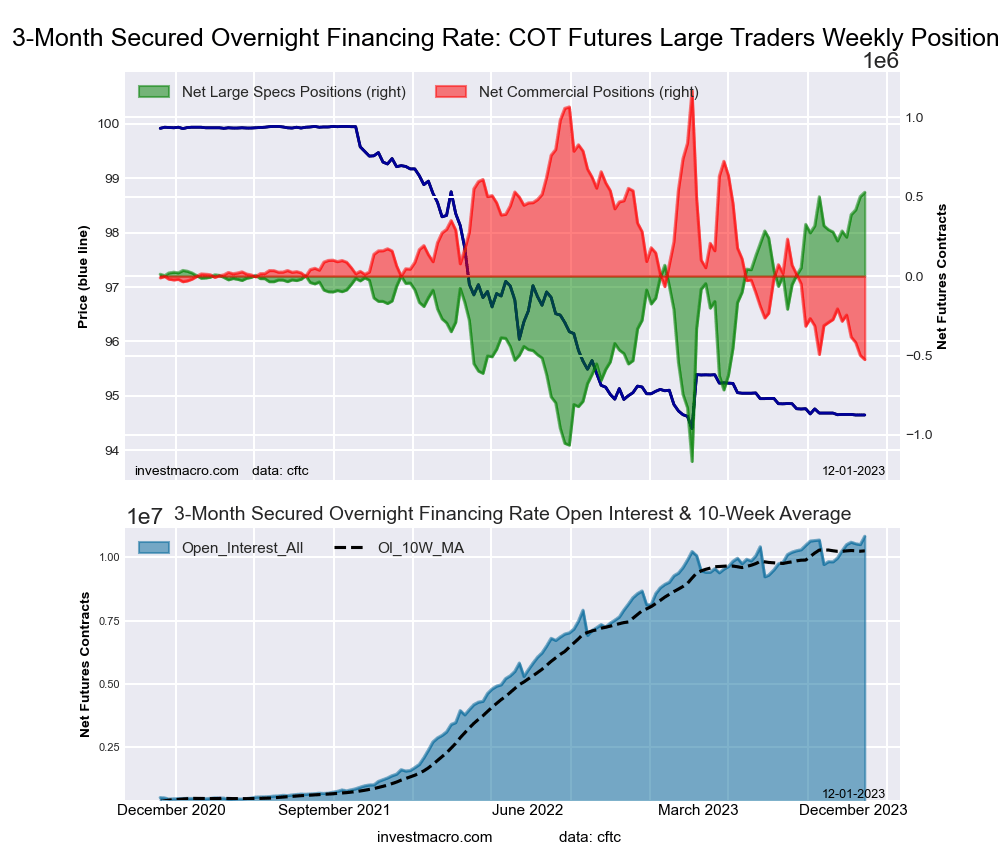 The Secured Overnight Financing Rate (3-Month) large speculator standing this week came in at a net position of 527,237 contracts in the data reported through Tuesday. This was a weekly lift of 27,337 contracts from the previous week which had a total of 499,900 net contracts.
This week’s current strength score (the trader positioning range over the past three years, measured from 0 to 100) shows the speculators are currently Bullish-Extreme with a score of 100.0 percent. The commercials are Bearish-Extreme with a score of 0.0 percent and the small traders (not shown in chart) are Bullish-Extreme with a score of 86.8 percent.
Price Trend-Following Model: Weak Uptrend
Our weekly trend-following model classifies the current market price position as: Weak Uptrend. The current action for the model is considered to be: Hold – Maintain Long Position.
| SOFR 3-Months Statistics | SPECULATORS | COMMERCIALS | SMALL TRADERS |
| – Percent of Open Interest Longs: | 20.5 | 53.9 | 0.3 |
| – Percent of Open Interest Shorts: | 15.6 | 58.8 | 0.3 |
| – Net Position: | 527,237 | -525,306 | -1,931 |
| – Gross Longs: | 2,221,115 | 5,844,327 | 31,767 |
| – Gross Shorts: | 1,693,878 | 6,369,633 | 33,698 |
| – Long to Short Ratio: | 1.3 to 1 | 0.9 to 1 | 0.9 to 1 |
| NET POSITION TREND: | | | |
| – Strength Index Score (3 Year Range Pct): | 100.0 | 0.0 | 86.8 |
| – Strength Index Reading (3 Year Range): | Bullish-Extreme | Bearish-Extreme | Bullish-Extreme |
| NET POSITION MOVEMENT INDEX: | | | |
| – 6-Week Change in Strength Index: | 18.1 | -18.8 | 7.1 |
30-Day Federal Funds Futures:
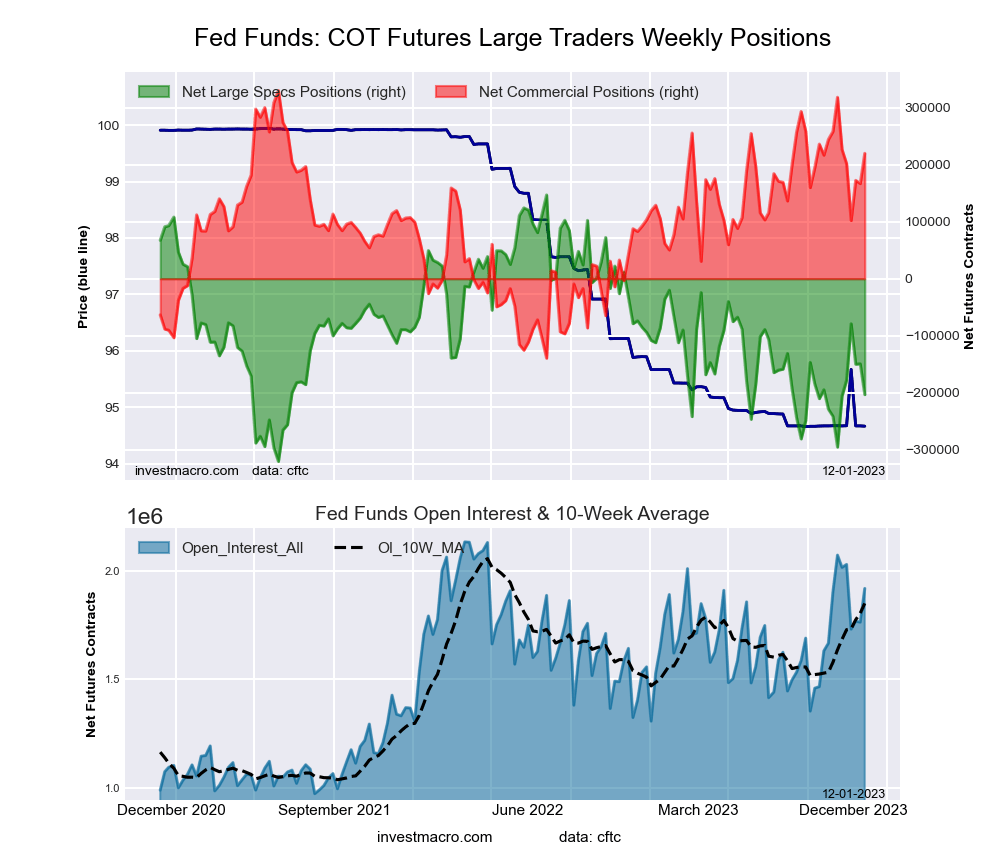 The 30-Day Federal Funds large speculator standing this week came in at a net position of -203,490 contracts in the data reported through Tuesday. This was a weekly decrease of -54,208 contracts from the previous week which had a total of -149,282 net contracts.
This week’s current strength score (the trader positioning range over the past three years, measured from 0 to 100) shows the speculators are currently Bearish with a score of 25.1 percent. The commercials are Bullish with a score of 76.5 percent and the small traders (not shown in chart) are Bullish with a score of 58.3 percent.
Price Trend-Following Model: Downtrend
Our weekly trend-following model classifies the current market price position as: Downtrend. The current action for the model is considered to be: Hold – Maintain Short Position.
| 30-Day Federal Funds Statistics | SPECULATORS | COMMERCIALS | SMALL TRADERS |
| – Percent of Open Interest Longs: | 7.6 | 76.6 | 1.6 |
| – Percent of Open Interest Shorts: | 18.3 | 65.1 | 2.4 |
| – Net Position: | -203,490 | 220,167 | -16,677 |
| – Gross Longs: | 146,621 | 1,468,991 | 30,251 |
| – Gross Shorts: | 350,111 | 1,248,824 | 46,928 |
| – Long to Short Ratio: | 0.4 to 1 | 1.2 to 1 | 0.6 to 1 |
| NET POSITION TREND: | | | |
| – Strength Index Score (3 Year Range Pct): | 25.1 | 76.5 | 58.3 |
| – Strength Index Reading (3 Year Range): | Bearish | Bullish | Bullish |
| NET POSITION MOVEMENT INDEX: | | | |
| – 6-Week Change in Strength Index: | 19.7 | -20.9 | 12.3 |
2-Year Treasury Note Futures:
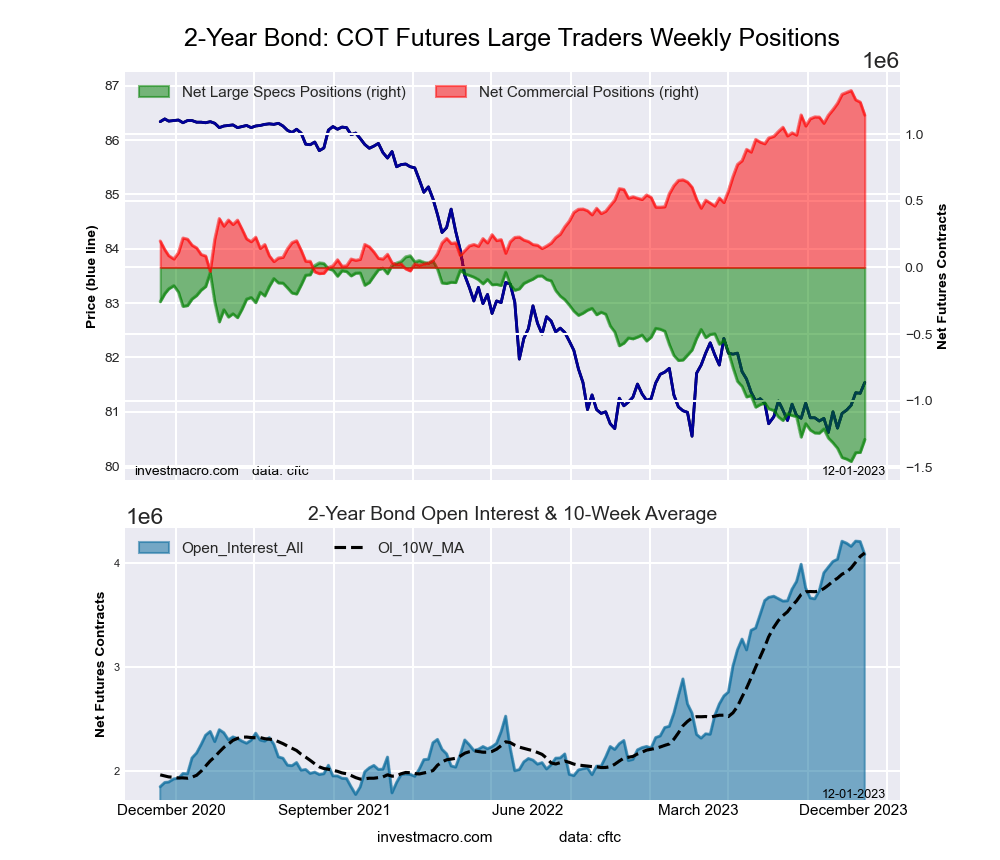 The 2-Year Treasury Note large speculator standing this week came in at a net position of -1,288,831 contracts in the data reported through Tuesday. This was a weekly gain of 96,571 contracts from the previous week which had a total of -1,385,402 net contracts.
This week’s current strength score (the trader positioning range over the past three years, measured from 0 to 100) shows the speculators are currently Bearish-Extreme with a score of 10.7 percent. The commercials are Bullish-Extreme with a score of 86.5 percent and the small traders (not shown in chart) are Bullish-Extreme with a score of 100.0 percent.
Price Trend-Following Model: Strong Uptrend
Our weekly trend-following model classifies the current market price position as: Strong Uptrend. The current action for the model is considered to be: Hold – Maintain Long Position.
| 2-Year Treasury Note Statistics | SPECULATORS | COMMERCIALS | SMALL TRADERS |
| – Percent of Open Interest Longs: | 10.6 | 80.9 | 6.9 |
| – Percent of Open Interest Shorts: | 42.2 | 53.0 | 3.2 |
| – Net Position: | -1,288,831 | 1,141,440 | 147,391 |
| – Gross Longs: | 432,134 | 3,303,026 | 279,784 |
| – Gross Shorts: | 1,720,965 | 2,161,586 | 132,393 |
| – Long to Short Ratio: | 0.3 to 1 | 1.5 to 1 | 2.1 to 1 |
| NET POSITION TREND: | | | |
| – Strength Index Score (3 Year Range Pct): | 10.7 | 86.5 | 100.0 |
| – Strength Index Reading (3 Year Range): | Bearish-Extreme | Bullish-Extreme | Bullish-Extreme |
| NET POSITION MOVEMENT INDEX: | | | |
| – 6-Week Change in Strength Index: | 4.3 | -6.5 | 8.7 |
5-Year Treasury Note Futures:
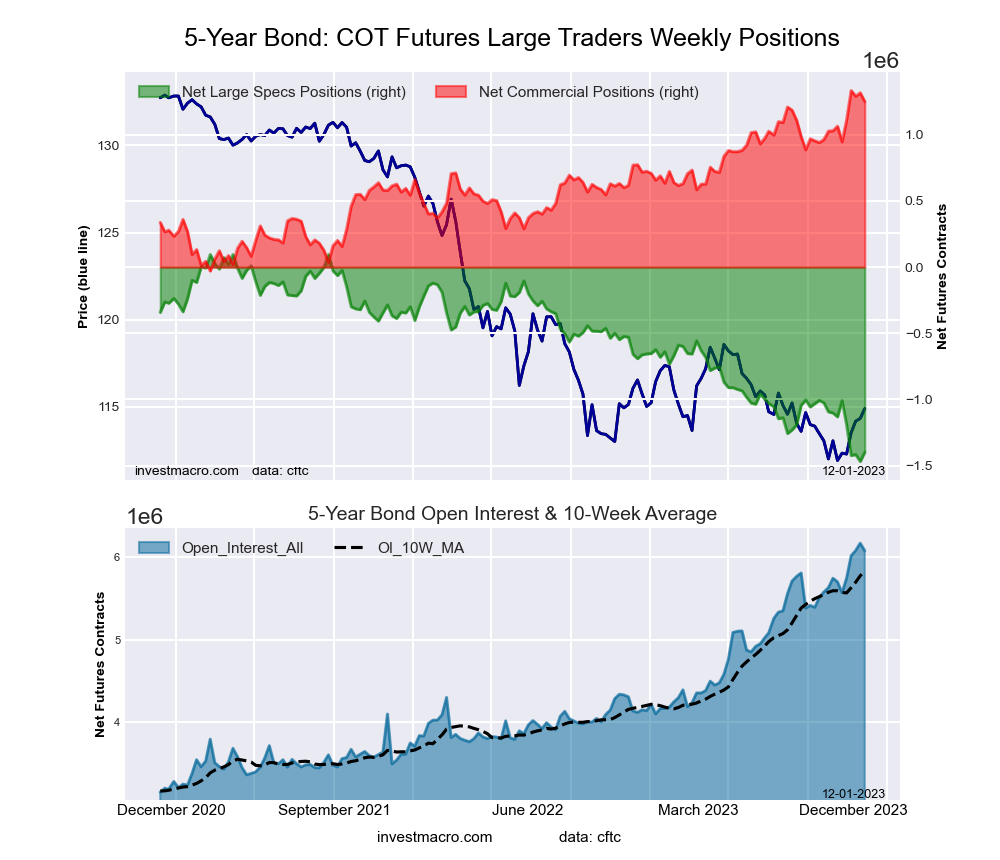 The 5-Year Treasury Note large speculator standing this week came in at a net position of -1,398,500 contracts in the data reported through Tuesday. This was a weekly lift of 70,133 contracts from the previous week which had a total of -1,468,633 net contracts.
This week’s current strength score (the trader positioning range over the past three years, measured from 0 to 100) shows the speculators are currently Bearish-Extreme with a score of 4.5 percent. The commercials are Bullish-Extreme with a score of 93.9 percent and the small traders (not shown in chart) are Bullish-Extreme with a score of 99.2 percent.
Price Trend-Following Model: Weak Downtrend (Possible Trend Change)
Our weekly trend-following model classifies the current market price position as: Weak Downtrend. The current action for the model is considered to be: Hold – Maintain Short Position.
| 5-Year Treasury Note Statistics | SPECULATORS | COMMERCIALS | SMALL TRADERS |
| – Percent of Open Interest Longs: | 7.5 | 82.1 | 7.3 |
| – Percent of Open Interest Shorts: | 30.5 | 61.6 | 4.9 |
| – Net Position: | -1,398,500 | 1,250,881 | 147,619 |
| – Gross Longs: | 458,979 | 4,994,986 | 446,125 |
| – Gross Shorts: | 1,857,479 | 3,744,105 | 298,506 |
| – Long to Short Ratio: | 0.2 to 1 | 1.3 to 1 | 1.5 to 1 |
| NET POSITION TREND: | | | |
| – Strength Index Score (3 Year Range Pct): | 4.5 | 93.9 | 99.2 |
| – Strength Index Reading (3 Year Range): | Bearish-Extreme | Bullish-Extreme | Bullish-Extreme |
| NET POSITION MOVEMENT INDEX: | | | |
| – 6-Week Change in Strength Index: | -17.1 | 13.7 | 18.2 |
10-Year Treasury Note Futures:
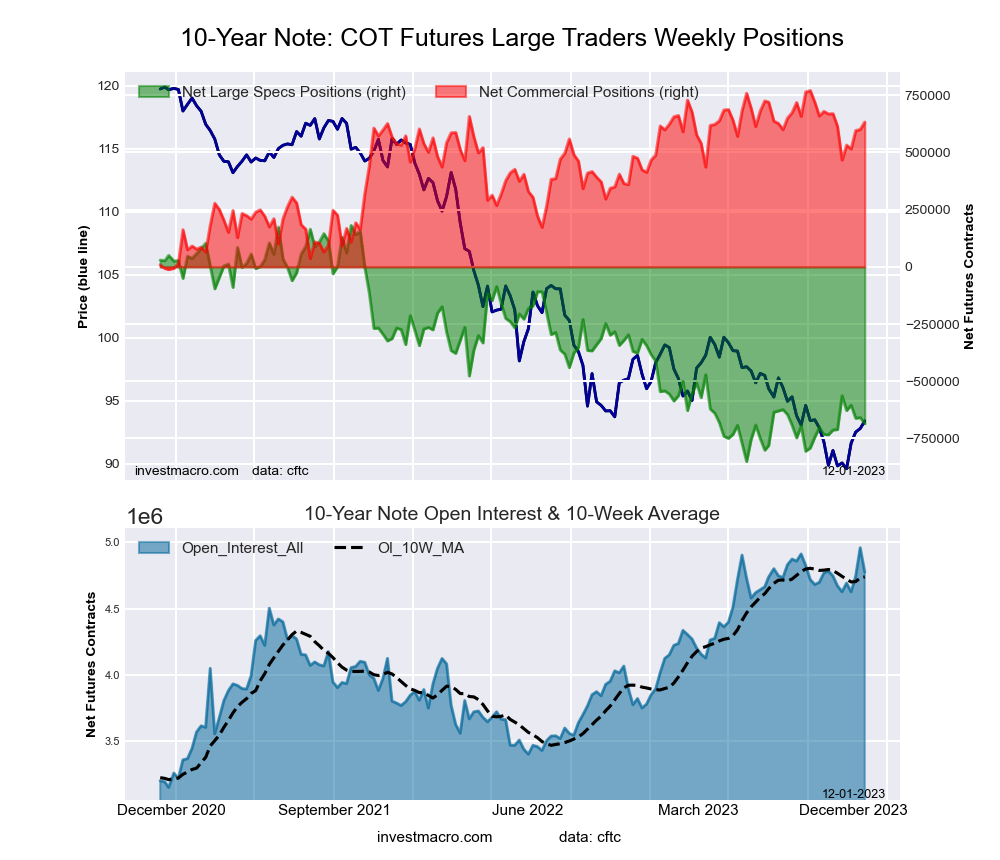 The 10-Year Treasury Note large speculator standing this week came in at a net position of -685,354 contracts in the data reported through Tuesday. This was a weekly decline of -27,196 contracts from the previous week which had a total of -658,158 net contracts.
This week’s current strength score (the trader positioning range over the past three years, measured from 0 to 100) shows the speculators are currently Bearish-Extreme with a score of 16.0 percent. The commercials are Bullish-Extreme with a score of 82.4 percent and the small traders (not shown in chart) are Bullish-Extreme with a score of 84.9 percent.
Price Trend-Following Model: Weak Downtrend (Possible Trend Change)
Our weekly trend-following model classifies the current market price position as: Weak Downtrend. The current action for the model is considered to be: Hold – Maintain Short Position.
| 10-Year Treasury Note Statistics | SPECULATORS | COMMERCIALS | SMALL TRADERS |
| – Percent of Open Interest Longs: | 10.7 | 77.5 | 9.0 |
| – Percent of Open Interest Shorts: | 25.1 | 64.2 | 7.9 |
| – Net Position: | -685,354 | 632,924 | 52,430 |
| – Gross Longs: | 510,993 | 3,700,892 | 431,609 |
| – Gross Shorts: | 1,196,347 | 3,067,968 | 379,179 |
| – Long to Short Ratio: | 0.4 to 1 | 1.2 to 1 | 1.1 to 1 |
| NET POSITION TREND: | | | |
| – Strength Index Score (3 Year Range Pct): | 16.0 | 82.4 | 84.9 |
| – Strength Index Reading (3 Year Range): | Bearish-Extreme | Bullish-Extreme | Bullish-Extreme |
| NET POSITION MOVEMENT INDEX: | | | |
| – 6-Week Change in Strength Index: | 2.5 | 2.4 | -9.6 |
Ultra 10-Year Notes Futures:
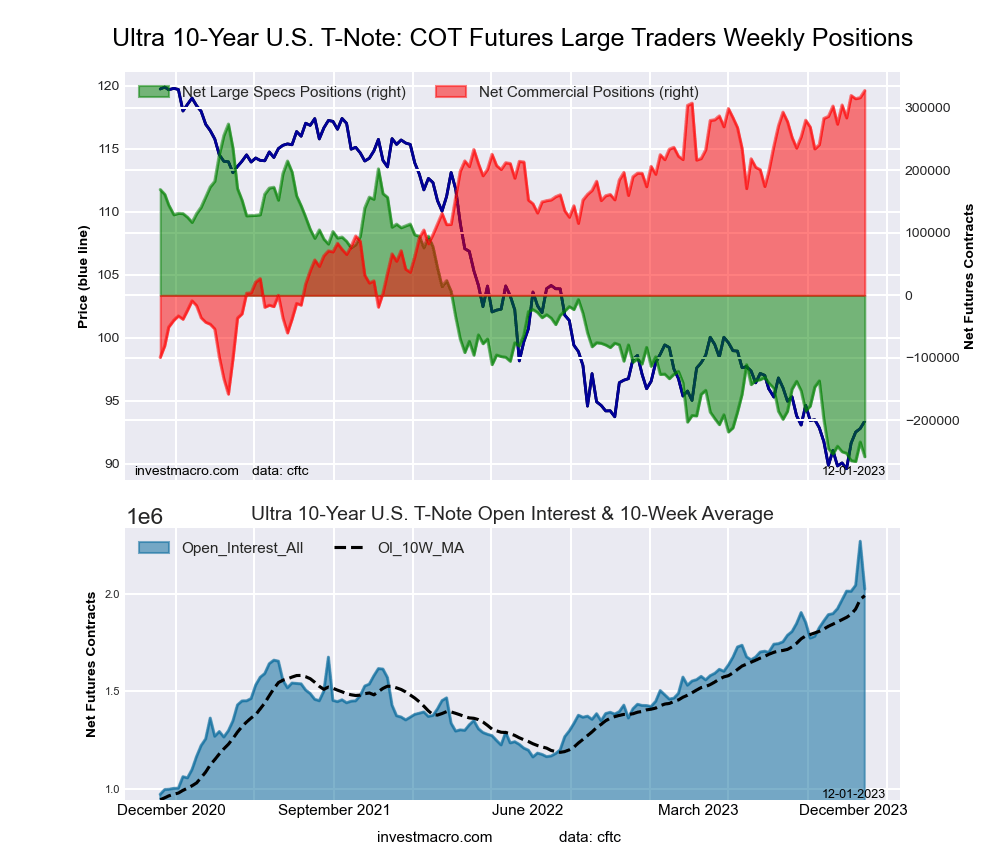 The Ultra 10-Year Notes large speculator standing this week came in at a net position of -257,895 contracts in the data reported through Tuesday. This was a weekly decline of -23,489 contracts from the previous week which had a total of -234,406 net contracts.
This week’s current strength score (the trader positioning range over the past three years, measured from 0 to 100) shows the speculators are currently Bearish-Extreme with a score of 1.4 percent. The commercials are Bullish-Extreme with a score of 100.0 percent and the small traders (not shown in chart) are Bullish with a score of 72.9 percent.
Price Trend-Following Model: Weak Uptrend (Possible Trend Change)
Our weekly trend-following model classifies the current market price position as: Weak Uptrend. The current action for the model is considered to be: Hold – Maintain Long Position.
| Ultra 10-Year Notes Statistics | SPECULATORS | COMMERCIALS | SMALL TRADERS |
| – Percent of Open Interest Longs: | 9.9 | 78.4 | 10.2 |
| – Percent of Open Interest Shorts: | 22.6 | 62.3 | 13.6 |
| – Net Position: | -257,895 | 327,143 | -69,248 |
| – Gross Longs: | 200,148 | 1,587,632 | 206,483 |
| – Gross Shorts: | 458,043 | 1,260,489 | 275,731 |
| – Long to Short Ratio: | 0.4 to 1 | 1.3 to 1 | 0.7 to 1 |
| NET POSITION TREND: | | | |
| – Strength Index Score (3 Year Range Pct): | 1.4 | 100.0 | 72.9 |
| – Strength Index Reading (3 Year Range): | Bearish-Extreme | Bullish-Extreme | Bullish |
| NET POSITION MOVEMENT INDEX: | | | |
| – 6-Week Change in Strength Index: | -3.1 | 11.1 | -22.0 |
US Treasury Bonds Futures:
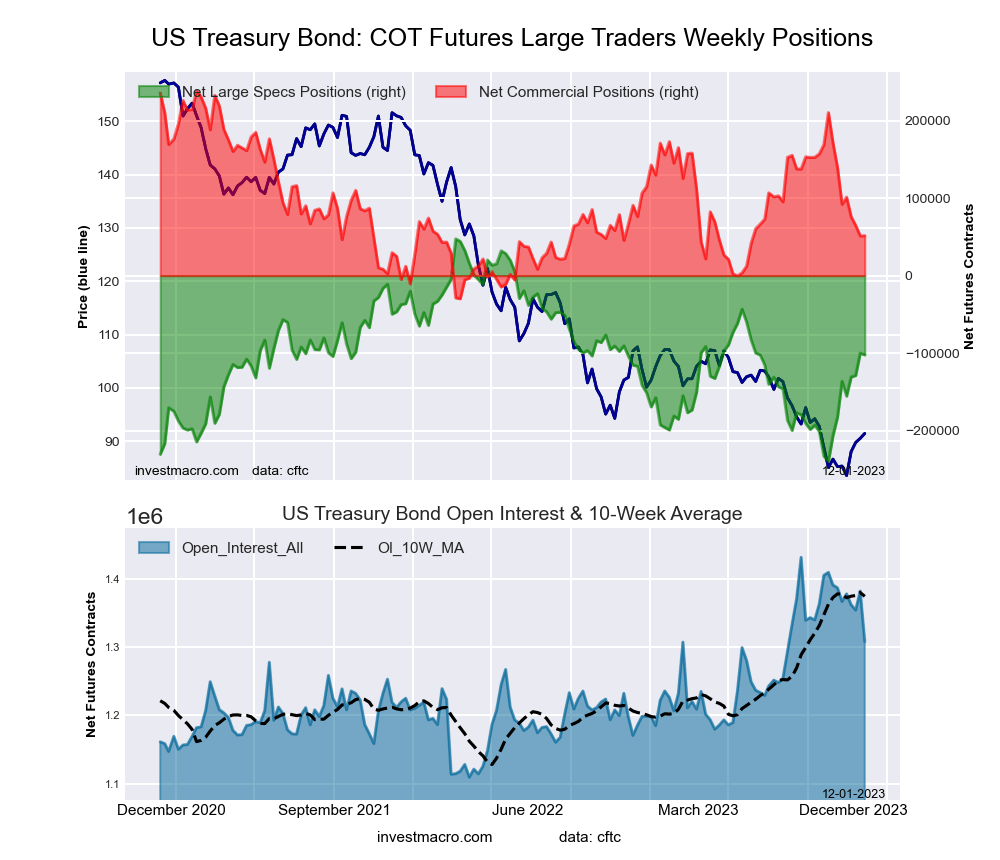 The US Treasury Bonds large speculator standing this week came in at a net position of -102,176 contracts in the data reported through Tuesday. This was a weekly reduction of -2,193 contracts from the previous week which had a total of -99,983 net contracts.
This week’s current strength score (the trader positioning range over the past three years, measured from 0 to 100) shows the speculators are currently Bearish with a score of 47.9 percent. The commercials are Bearish with a score of 30.3 percent and the small traders (not shown in chart) are Bullish-Extreme with a score of 85.3 percent.
Price Trend-Following Model: Downtrend
Our weekly trend-following model classifies the current market price position as: Downtrend. The current action for the model is considered to be: Hold – Maintain Short Position.
| US Treasury Bonds Statistics | SPECULATORS | COMMERCIALS | SMALL TRADERS |
| – Percent of Open Interest Longs: | 8.2 | 75.0 | 16.1 |
| – Percent of Open Interest Shorts: | 16.1 | 71.0 | 12.2 |
| – Net Position: | -102,176 | 51,573 | 50,603 |
| – Gross Longs: | 107,866 | 980,494 | 210,065 |
| – Gross Shorts: | 210,042 | 928,921 | 159,462 |
| – Long to Short Ratio: | 0.5 to 1 | 1.1 to 1 | 1.3 to 1 |
| NET POSITION TREND: | | | |
| – Strength Index Score (3 Year Range Pct): | 47.9 | 30.3 | 85.3 |
| – Strength Index Reading (3 Year Range): | Bearish | Bearish | Bullish-Extreme |
| NET POSITION MOVEMENT INDEX: | | | |
| – 6-Week Change in Strength Index: | 28.0 | -32.7 | 5.5 |
Ultra US Treasury Bonds Futures:
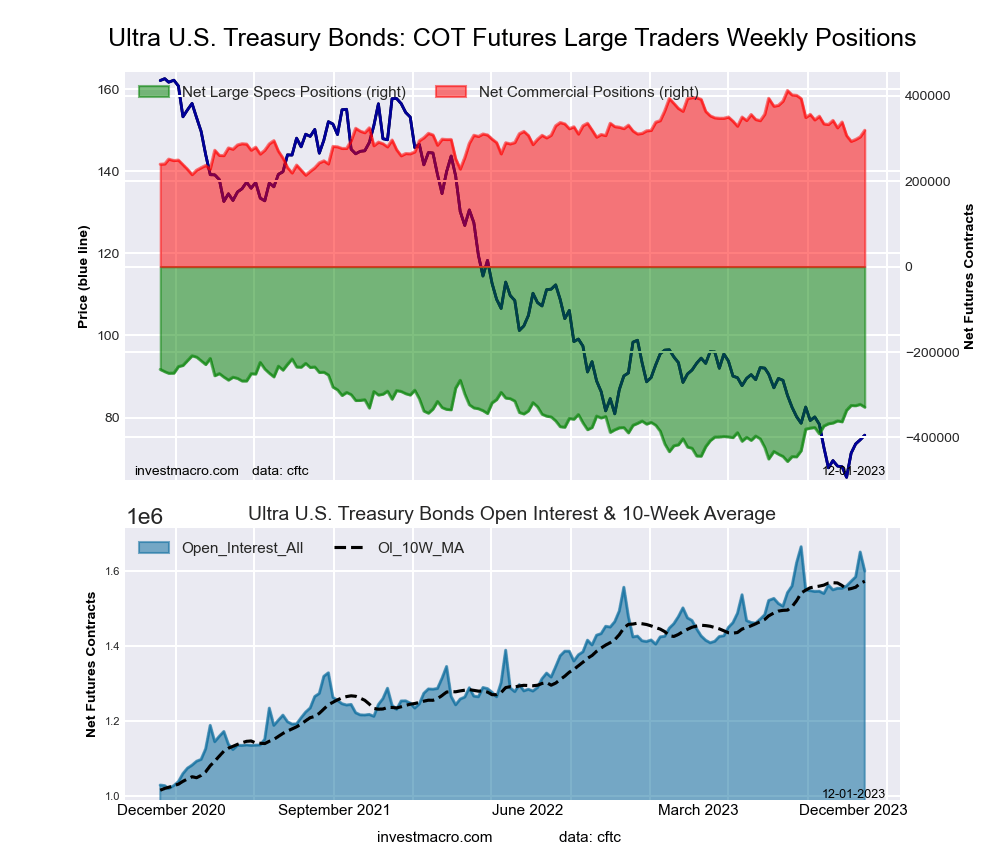 The Ultra US Treasury Bonds large speculator standing this week came in at a net position of -329,265 contracts in the data reported through Tuesday. This was a weekly lowering of -6,522 contracts from the previous week which had a total of -322,743 net contracts.
This week’s current strength score (the trader positioning range over the past three years, measured from 0 to 100) shows the speculators are currently Bullish with a score of 51.4 percent. The commercials are Bullish with a score of 53.0 percent and the small traders (not shown in chart) are Bearish with a score of 46.4 percent.
Price Trend-Following Model: Downtrend
Our weekly trend-following model classifies the current market price position as: Downtrend. The current action for the model is considered to be: Hold – Maintain Short Position.
| Ultra US Treasury Bonds Statistics | SPECULATORS | COMMERCIALS | SMALL TRADERS |
| – Percent of Open Interest Longs: | 6.0 | 81.5 | 11.0 |
| – Percent of Open Interest Shorts: | 26.5 | 61.5 | 10.4 |
| – Net Position: | -329,265 | 319,441 | 9,824 |
| – Gross Longs: | 95,430 | 1,304,297 | 176,634 |
| – Gross Shorts: | 424,695 | 984,856 | 166,810 |
| – Long to Short Ratio: | 0.2 to 1 | 1.3 to 1 | 1.1 to 1 |
| NET POSITION TREND: | | | |
| – Strength Index Score (3 Year Range Pct): | 51.4 | 53.0 | 46.4 |
| – Strength Index Reading (3 Year Range): | Bullish | Bullish | Bearish |
| NET POSITION MOVEMENT INDEX: | | | |
| – 6-Week Change in Strength Index: | 13.0 | -2.9 | -25.0 |
Article By InvestMacro – Receive our weekly COT Newsletter
*COT Report: The COT data, released weekly to the public each Friday, is updated through the most recent Tuesday (data is 3 days old) and shows a quick view of how large speculators or non-commercials (for-profit traders) were positioned in the futures markets.
The CFTC categorizes trader positions according to commercial hedgers (traders who use futures contracts for hedging as part of the business), non-commercials (large traders who speculate to realize trading profits) and nonreportable traders (usually small traders/speculators) as well as their open interest (contracts open in the market at time of reporting). See CFTC criteria here.


