At the end of the day yesterday, the Dow Jones Index (US30) gained 0.15%, and the S&P 500 Index (US500) gained 0.25%. The NASDAQ Technology Index (US100) closed positive 0.17%. Volatility on the indices was extremely low due to the bank holiday weekend in the US.
The Canadian dollar traded near 1.37 per US dollar, rebounding from a five-week low of 1.376 recorded on June 7, amid a weaker US dollar and increased foreign exchange inflows. The Canadian currency is also under pressure from rising debt levels and recent comments from Bank of Canada Governor Tiff Macklem about the possibility of further rate cuts, which could put further pressure on the loonie.
Equity markets in Europe were mostly down yesterday. The German DAX (DE40) decreased by 0.35%, the French CAC 40 (FR40) closed down 0.77%, the Spanish IBEX 35 (ES35) lost 0.10%, the British FTSE 100 (UK100) closed positive 0.17%.
In the Eurozone, market participants actively follow France’s political situation. Legislative elections are scheduled for June 30 and July 7, and the far-right Rassemblement National, which proposes measures such as cutting sales taxes and lowering the retirement age, is leading in the polls. As a result, France’s risk premium and bond yields rose sharply as investors began to worry about possible increases in government spending that could worsen France’s financial health. Meanwhile, Le Pen told Le Figaro that she is “respectful” of institutions and, if she wins, will not try to oust Macron in an attempt to appeal to moderates and investors.
Oil prices held near seven-week highs as geopolitical issues in the Middle East heightened supply concerns. Investors are cautiously awaiting today’s US oil inventories report from the Energy Information Administration, which has been postponed a day due to a national holiday.
Asian markets traded without a single dynamic yesterday. Japan’s Nikkei 225 (JP225) gained 0.23%, China’s FTSE China A50 (CHA50) declined 0.09%, Hong Kong’s Hang Seng (HK50) gained 2.87%, and Australia’s ASX 200 (AU200) was negative 0.11%.
The New Zealand dollar rose against the US dollar thanks to stronger-than-expected first-quarter GDP data. New Zealand’s economy grew by 0.2% in the first quarter compared to 0% in the previous quarter, beating expectations. On an annualized basis, GDP increased by 0.3% in the first quarter, compared to a contraction of 0.2% in the previous quarter. The strengthening GDP growth suggests that New Zealand is out of recession. In addition, the weakening US dollar has also helped the kiwi strengthen as the recent weak US retail sales report has increased the likelihood that the Federal Reserve (Fed) will cut interest rates in the coming months.
The offshore yuan fell to 7.28 per dollar, hitting its lowest level in more than seven months, following the central bank’s decision to set a much weaker official discount rate. The People’s Bank of China set the average rate at 7.1192 per dollar, the weakest since November 2023 and the biggest one-day move since April 16. Meanwhile, earlier on Thursday, the People’s Bank of China (PBoC) left key lending rates unchanged at the June fixing, matching market expectations. The 1-year prime rate (LPR) was left at 3.45% and the 5-year LPR at 3.95% after a record 25 basis points cut in February. Both rates are at historic lows, reflecting the fragile economic recovery and reinforcing calls for additional support measures from Beijing.
S&P 500 (US500) 5,496.80 +1.13 (+0.02%)
Dow Jones (US30) 38,818.90 -55.0 (-0.14%)
DAX (DE40) 18,067.91 −64.06 (−0.35%)
FTSE 100 (UK100) 8,205.11 +13.82 (+0.17%)
USD Index 105.24 −0.02 (−0.02%)
Important events today:
– New Zealand QDP (q/q) at 01:45 (GMT+3);
– China PBoC Loan Prime Rate (m/m) at 04:15 (GMT+3);
– German Producer Price Index (m/m) at 09:00 (GMT+3);
– Switzerland Trade Balance (m/m) at 09:00 (GMT+3);
– Switzerland SNB Interest Rate Decision at 10:30 (GMT+3);
– Switzerland SNB Monetary Policy Assessment at 10:30 (GMT+3);
– Switzerland SNB Press Conference at 11:00 (GMT+3);
– Norway NB Interest Rate Decision at 11:00 (GMT+3);
– UK BoE Interest Rate Decision at 14:00 (GMT+3);
– UK BoE MPC Meeting Minutes at 14:30 (GMT+3);
– US Initial Jobless Claims (w/w) at 15:30 (GMT+3);
– US Philadelphia Fed Manufacturing Index (m/m) at 15:30 (GMT+3);
This article reflects a personal opinion and should not be interpreted as an investment advice, and/or offer, and/or a persistent request for carrying out financial transactions, and/or a guarantee, and/or a forecast of future events.
The NZD/USD pair declined to 0.6135 on Wednesday, despite the New Zealand dollar performing much better in the previous session. It rose in response to the fall of the US dollar, which was triggered by weaker-than-expected US retail sales data. These results increased bets on an imminent reduction in the cost of lending by the Federal Reserve System. This caused the USD to retreat, allowing other currencies to rise.
Today, Paul Conway, the chief economist of the Reserve Bank of New Zealand, announced that the process of returning inflation to the target is progressing well. The ongoing softening of the employment sector is releasing spare capacity in the economy, likely leading to a further reduction in inflationary pressure in the economic system.
At the same time, Conway noted that the inflation reduction process may not follow the predicted timeline. An extended period of maintaining a restrictive monetary policy is necessary to achieve a lasting result, a crucial step to ensure the goal is met. The market’s attention will now shift to the upcoming Q1 GDP statistics. The data may reflect a fairly modest increase, which could hurt the NZD.
Technical analysis of NZD/USD
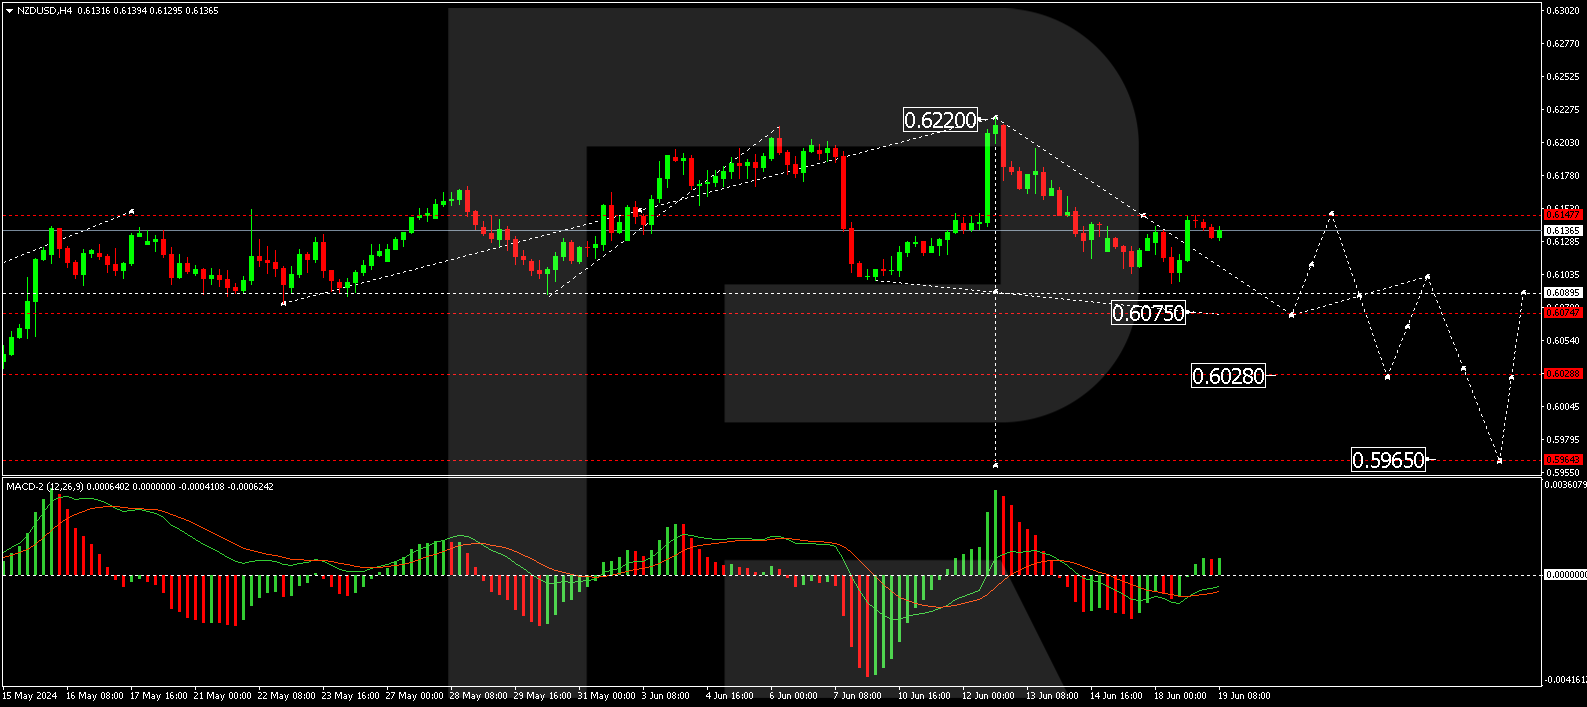
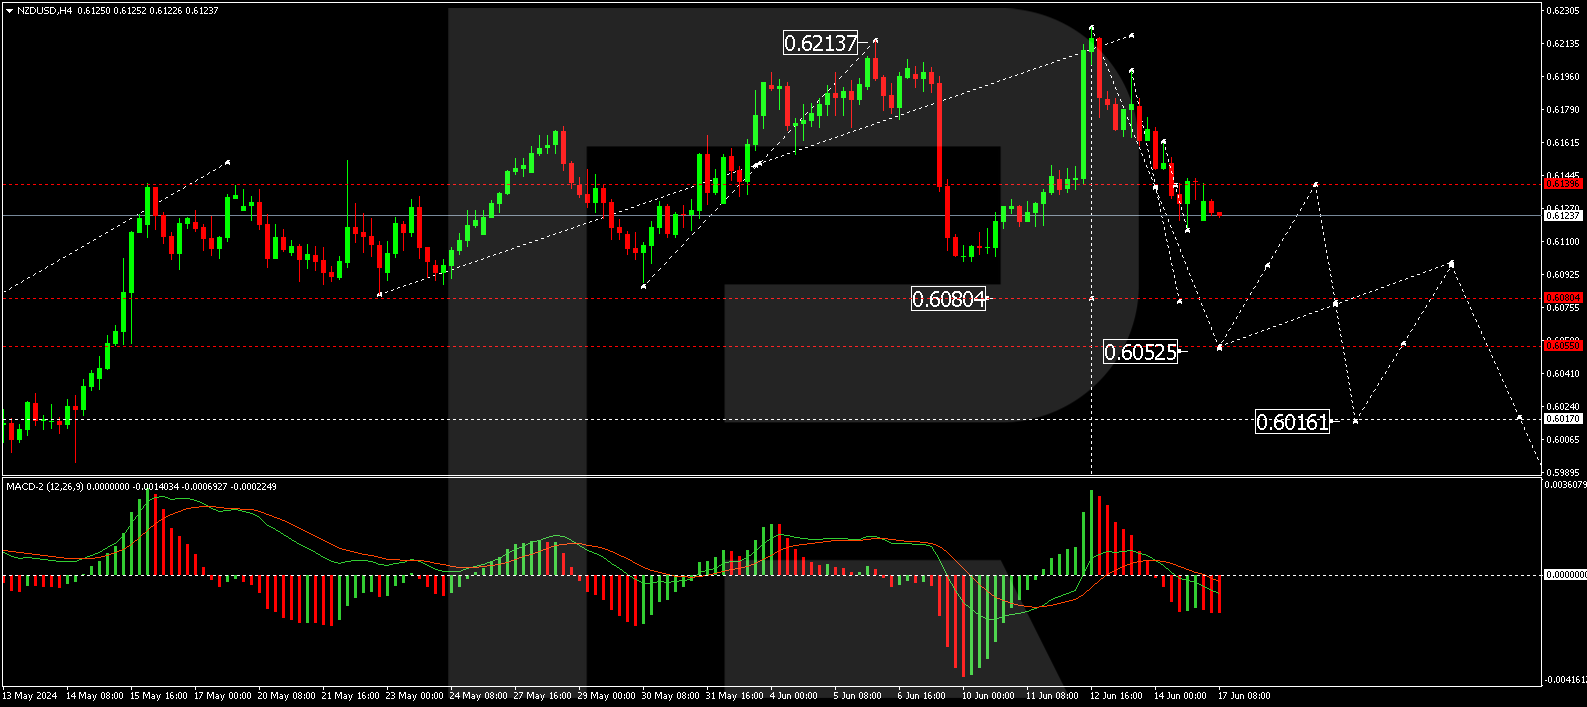
On the H4 NZD/USD chart, the market executed a wave of decline to the level of 0.6097 and a correction to the level of 0.6148. Today, we expect another downward trend to 0.6075, the first goal. After reaching this level, a correction to 0.6140 is possible (testing from below). Next, we will consider a new wave of decline to 0.6028, the local target. This scenario is technically confirmed by the MACD indicator, as its signal line is below the zero mark. An update of the lows is expected.
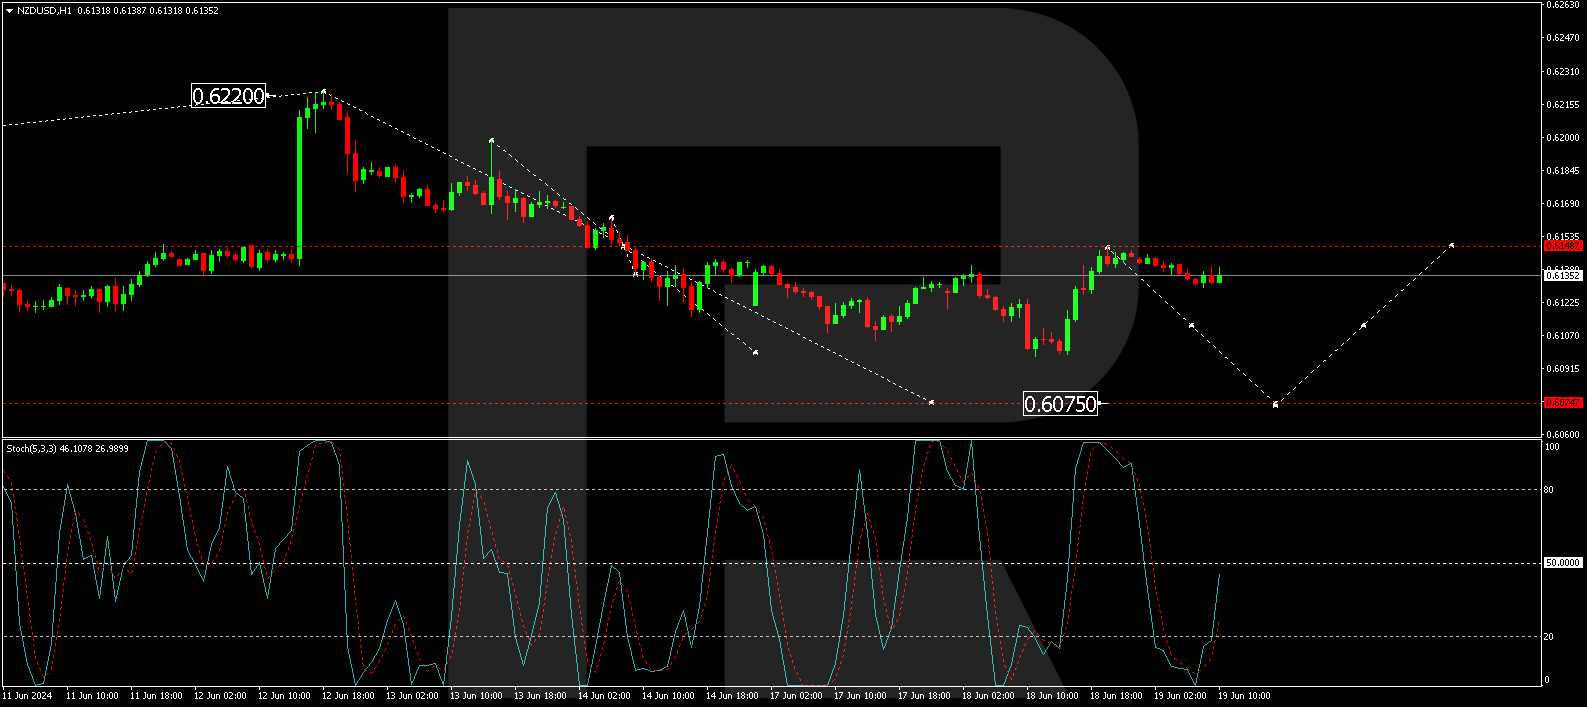
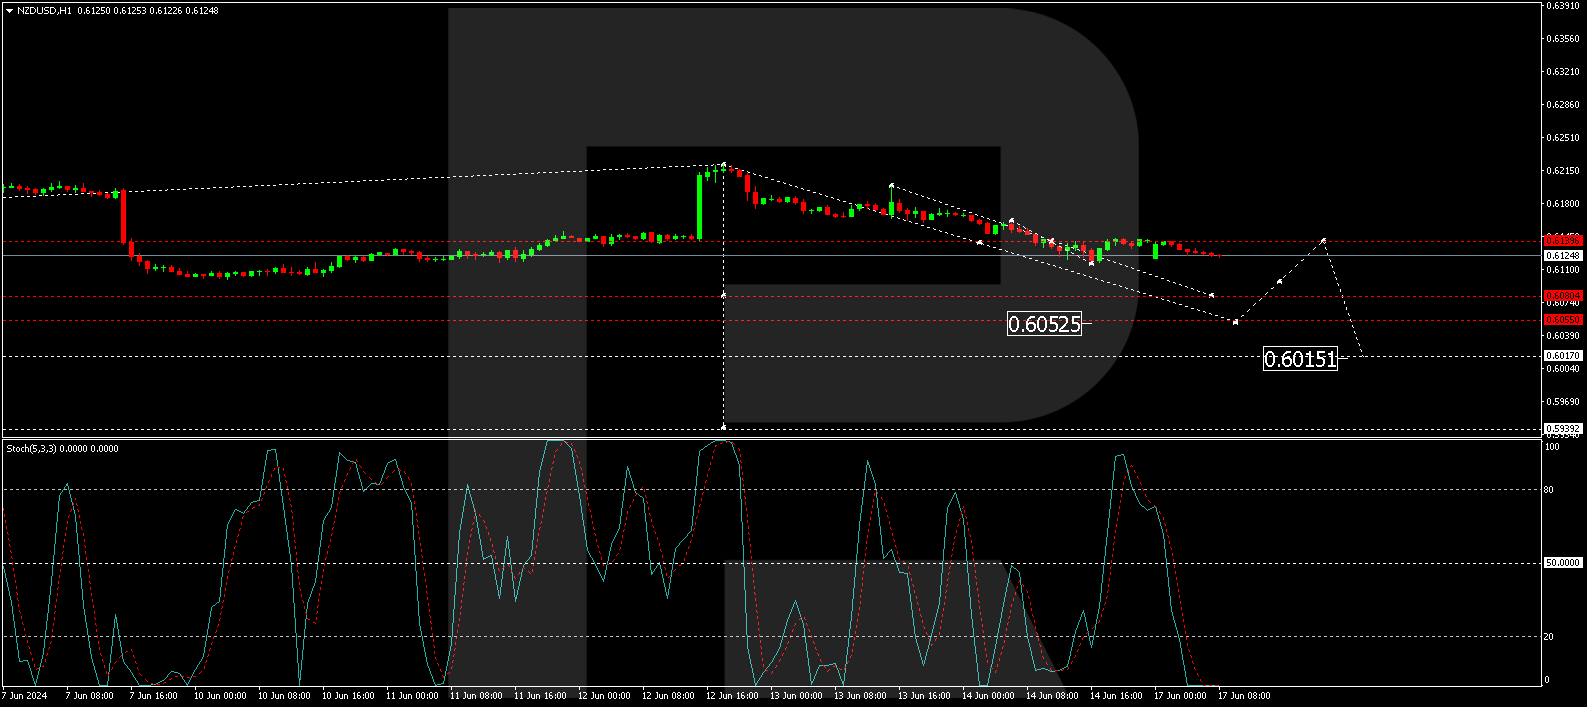
On the H1 NZD/USD chart, a correction has formed to 0.6148 (testing from below). Today, we expect a decrease to 0.6111. The breakdown of this level will open the potential for a downward trend to 0.6075. Technically, this scenario is also confirmed by the Stochastic oscillator. Its signal line is below the 50 mark, and another decline to the level of 20 is expected.
Disclaimer
Any forecasts contained herein are based on the author’s particular opinion. This analysis may not be treated as trading advice. RoboForex bears no responsibility for trading results based on trading recommendations and reviews contained herein.
Gold edges up 0.2% today; still stuck in sideways range since April
Bullion’s year-to-date gains now at 13.1%
Bloomberg model: Gold may be range-bound for another month
Fed rate cuts, PBOC buying needed to trigger next leg up
5 other FXTM commodities outperformed gold so far in 2024
Gold’s luster has been waning of late.
To be certain, the precious metal added to its 13% gains from 2023 with a further 13% so far in 2024.
Despite posting fresh record highs in recent months, gold’s gains have stalled since mid-April.
Notice how spot gold attempted to break above the $2430 line back in mid-April and mid-May.
Those intraday spikes however could not be sustained.
Although edging higher at the time of writing, gold has been trading back below its 50-day simple moving average (SMA) for the first time since February 2024.
Why has gold’s rally stalled?
1) Lowered bets for Fed rate cuts this year
Back in March 2024, markets were according up to a 92% chance that the Fed would lower its benchmark rates by a total of 75 basis points (three rate cuts of 25-basis points each) by year-end.
Recall that gold offers no interest (zero yield) to holders of this asset. Hence, lower interest rates tend to reduce the opportunity cost of holding gold.
In other words, lower rates boost the appeal of zero-yielding gold.
But with markets now predicting just two rate cuts (25-bps each) by the Fed this year, that has curbed gold’s upside, though providing support for the precious metal in the interim.
2) PBOC halted gold purchases
A big driver of gold’s surge has been the persistent buying from major central banks, especially the People’s Bank of China.
The PBoC bought about 10 million troy ounces worth of the precious metal since November 2022, as it sought to pad up and diversify its foreign reserves.
However, on 7th June 2024, it was revealed that the PBoC halted its 18-month buying spree in May 2024.
That news triggered a 3.5% drop in spot gold and dragged prices well below the 50-day SMA.
What could make gold’s rally resume?
Fed rate cuts
As mentioned earlier, markets need greater certainty that the Fed can indeed press ahead with its intended rate cuts.
Given its stated “data dependent” stance, the incoming US jobs/inflation data may prompt gold bulls to charge on once again.
Central bank buying
The PBoC and other central banks may yet be compelled to return to the market, either due to a further need to increase their foreign reserves, or if lower gold prices prove attractive enough.
A resumption of their buying spree should give fresh impetus for gold to move higher once more.
How is gold expected to perform over the days/weeks ahead?
According to Bloomberg’s model:
74% chance of $2286 – $2382 over the next one-week period
73% chance of $2246 – $2439 over the next one month.
Contrasting the above forecasted ranges to current prices …
Gold appears to retain a downside bias, with less chance of posting a new record high by mid-July.
Such an outlook would be keeping with the downtrend (lower highs and lower lows) since its current record high of $2450.03 on May 20th.
The Fed is also unlikely to give more concrete signals about its policy intentions before these central bankers are shown another couple months’ worth of jobs/inflation data.
The next FOMC policy meeting isn’t slated until July 31st.
Hence, gold bulls might have to bide their time in the interim, and perhaps endure bouts of profit-taking that results in dips for spot gold prices.
How has the rest of the FXTM commodities complex performed?
FXTM recently launched 10 new commodities, adding to the ranks that already feature Gold, Silver, Brent (oil), Crude (US crude oil), and NatGas (Natural Gas).
While gold’s 13% in year-to-date gains is certainly notable, it still lags behind the year-to-date gains seen in Silver, as well as 5 of those new commodities:
Cocoa: +136.8%
Robusta: +34.3%
Silver: +24%
Arabica: +20%
Copper: +16.8%
Certainly it has been a good year so far for commodity bulls, thanks to lacking supply and resilient demand across the global economy.
However, if the global economic outlook deteriorates, due to demand-destroying elevated interest rates, that could prompt these commodities to unwind these stellar year-to-date gains.
To the upside, should major central banks press ahead with their plans to lower interest rates, which is supportive of demand for these commodities, that could boost these commodity prices even higher.
Either way, traders who are primed and ready stand to reap sizeable trading opportunities along the way, either up or down.
At the end of yesterday, the Dow Jones Index (US30) gained 0.15%, while the S&P 500 Index (US500) rose 0.25% to an all-time high. The NASDAQ Technology Index (US100) closed positive 0.03%. Strengthening chipmakers helped boost the overall market on Tuesday, led by a 3% gain in Nvidia (NVDA) shares after Rosenblatt Securities raised its price target on the stock.
The US economic news on Tuesday was mixed for stocks. May retail sales rose less than expected and raised concerns about consumer spending. However, a stronger-than-expected manufacturing output report for May eased concerns about a slowdown in consumer spending. Fed comments on Tuesday were mostly on the hawkish side, as policymakers said they would prefer to wait to cut interest rates.
According to Fitch Ratings’ latest estimate, global economic growth will strengthen this year and slow in 2025. The rating agency raised its prognosis for global GDP growth in 2024 to 2.6%, from its previous prediction of 2.4%. The revised outlook reflects Fitch’s increased confidence in European economic recovery prospects, strengthening domestic demand in emerging markets (excluding China).
Equity markets in Europe were mostly up on Tuesday. Germany’s DAX (DE40) rose by 0.35%, France’s CAC 40 (FR40) closed 0.76% higher, Spain’s IBEX 35 (ES35) jumped 0.99%, and the UK’s FTSE 100 (UK100) closed positive 0.60%. The Eurozone’s annual inflation rate for May 2024 was 2.6%, up from 2.4% in April. A year earlier, the figure stood at 6.1%. The lowest annual rates were recorded in Latvia (0.0%), Finland (0.4%), and Italy (0.8%). The highest annual rates were recorded in Romania (5.8%), Belgium (4.9%) and Croatia (4.3%). Compared to April, annual inflation fell in eleven Member States, remained unchanged in two, and rose in fourteen.
WTI crude oil prices held near $81.5 a barrel on Wednesday, at their highest levels in seven weeks, as the escalating conflict in Eastern Europe and the Middle East renewed supply concerns. In Russia, a Ukrainian drone strike sparked a fire at an oil terminal at a major port, while a senior Israeli official warned of a looming “all-out war” with Lebanon’s Hezbollah. Oil prices were also supported by global demand growth estimates, with OPEC, the IEA, and the US EIA all predicting strong oil demand growth in the second half of this year.
Asian markets traded yesterday without any unified dynamics. Japan’s Nikkei 225 (JP225) gained 1.00%, China’s FTSE China A50 (CHA50) decreased by 0.09%, Hong Kong’s Hang Seng (HK50) was down 0.11%, while Australia’s ASX 200 (AU200) was positive 1.01%.
Hong Kong stocks rose in early trading on Wednesday, recovering from sluggish sessions in the previous two sessions as all sectors rose. The index approached its highest level in a fortnight as traders sought to take new positions following the Hong Kong government’s announcement that markets in the Asian financial center will remain open during typhoons and extreme weather conditions from September 23. Investors are also awaiting the People’s Bank of China’s lending rate decision on Thursday after the Central Bank decided earlier this week to leave the medium-term lending rate unchanged at 2.5%.
The Reserve Bank of Australia took a hawkish tone in a press conference after this week’s meeting, warning of upside risks to inflation. RBA Governor Michele Bullock also said the board discussed the need to raise the interest rate at its June meeting, while arguments for a rate cut were not considered. These comments came after the Central Bank left the money rate unchanged at 4.35% for the fifth consecutive meeting, as expected.
New Zealand’s inflation rate has slowed significantly recently. However, it remains above both pre-pandemic levels and the Monetary Policy Committee’s (MPC) target range of 1% to 3%. Compared to other countries, labor market shortages caused by the border closure have played an important role in driving up inflation in New Zealand. Recent research emphasizes that the emergence of spare capacity in the economy will lead to lower domestic inflation.
S&P 500 (US500) 5,487.03 +13.80 (+0.25%)
Dow Jones (US30) 38,834.86 +56.76 (+0.15%)
DAX (DE40) 18,131.97 +63.76 (+0.35%)
FTSE 100 (UK100) 8,191.29 +49.14 (+0.60%)
USD Index 105.25 −0.07 (−0.06%)
Important events today:
– Japan BoJ Monetary Policy Meeting Minutes (m/m) at 02:50 (GMT+3);
This article reflects a personal opinion and should not be interpreted as an investment advice, and/or offer, and/or a persistent request for carrying out financial transactions, and/or a guarantee, and/or a forecast of future events.
The commodity market was adjusted moderately on Tuesday morning after the price of Brent crude oil rose by 2% the day before. A barrel of the North Sea variety is at about 84 USD.
The main support factor currently is the improving prospects for global demand. Additionally, there are expectations that global oil producers will restrain supply.
The latest oil market reports from OPEC+, the International Energy Agency and the US Department of Energy suggest a steady increase in energy demand in the second half of 2024.
Yesterday’s surge in Brent’s price was also supported by an increase in the value of the entire range of risky assets. This is due to reduced inflationary pressures in the world’s largest economies. Such signals strengthen the bet on lowering the cost of lending in the coming months.
The proposal is underpinned by the collaborative efforts of key OPEC+ member countries, including Russia and Iraq, which have confirmed their intentions to adhere to the agreed production quotas. Saudi Arabia has also expressed its readiness to adjust production volumes to fully account for market conditions.
Technical analysis of Brent
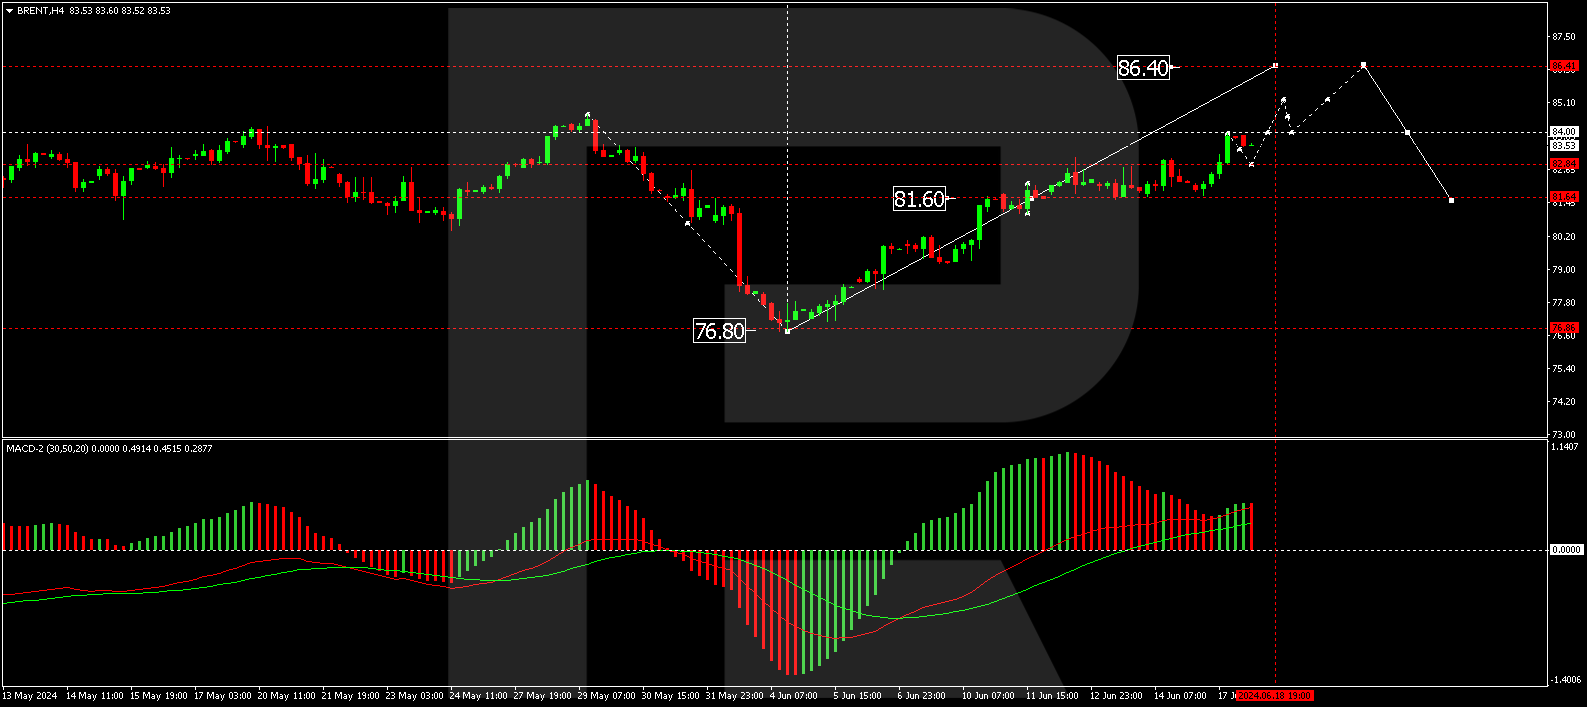
On the H4 Brent chart, the market has formed a consolidation range above the 81.60 level. Today, the price has moved up from this range, continuing to develop a wave of growth to the level of 86.40. After achieving this level, we anticipate a correction to 81.60. Next, we expect the trend to continue to the level of 89.00. This scenario is technically confirmed by the MACD indicator, with its signal line above the zero mark and directed strictly upwards.
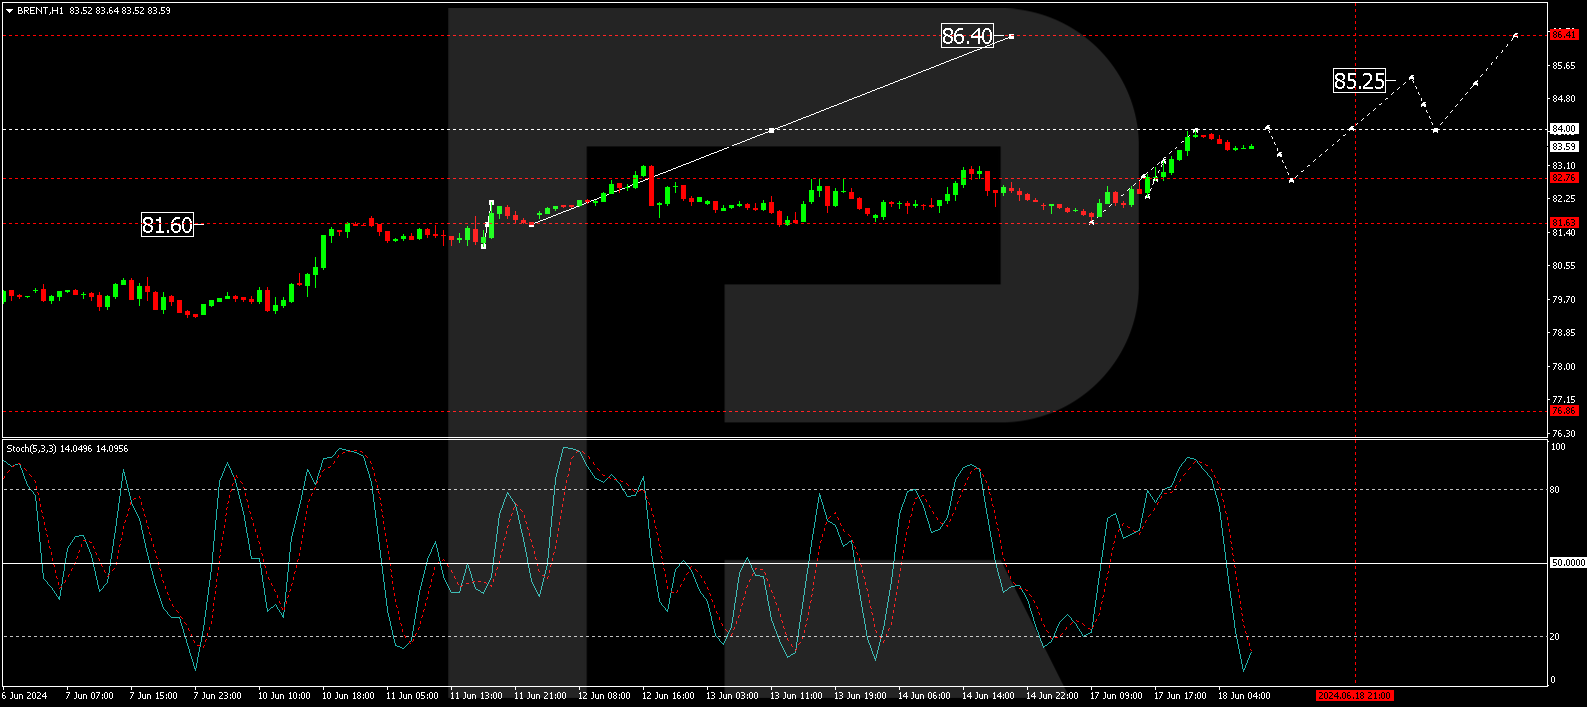
On the H1 Brent chart, the market received support at 81.56 and began the development of the second half of the growth wave. At the moment, the local target at the level of 83.98 is fulfilled. Today, a link of growth to 84.00 is possible. Next, we expect a correction link to the level of 82.76 (test from above), followed by an increase to the level of 86.40. Technically, this scenario is confirmed by the Stochastic oscillator. Its signal line is below the level of 20 and is preparing for the start of growth.
Disclaimer
Any forecasts contained herein are based on the author’s particular opinion. This analysis may not be treated as trading advice. RoboForex bears no responsibility for trading results based on trading recommendations and reviews contained herein.
At the end of yesterday, the Dow Jones Index (US30) added 0.49%, while the S&P 500 Index (US500) was up 0.77%. The NASDAQ Technology Index (US100) closed positive 0.95%. On Monday, the S&P 500 Index (US500) closed at a record high, ignoring rising Treasury yields, with technology stocks continuing to rise amid continued Fed speeches. Philadelphia Fed President Patrick Harker said on Monday that he expects only one rate cut if the economy performs as expected, as current rate levels are likely to keep inflation lower and prevent the risk of higher inflation. Markets rate the odds of a 25bp rate cut at 8% for the next FOMC meeting on 30–31 July and 59% for the 17–18 September meeting.
Also positive for US equities, Citigroup raised its outlook for US equities to “overweight” from “neutral.” It lowered its outlook for European equities to “neutral” from “overweight,” citing a “significantly greater pro-growth bias in the US compared to Europe.”
Moderna (MRNA) closed down over 1% on signs of insider selling after director Afeyan sold $2.21 million shares last Wednesday. Tesla (TSLA) closed higher by more than 5% after Bloomberg reported that the company received approval to test its advanced driver assistance system on streets in China.
Equity markets in Europe were mostly up on Monday. Germany’s DAX (DE40) rose by 0.37%, France’s CAC 40 (FR40) closed higher by 0.91%, Spain’s IBEX 35 (ES35) fell by 0.30% and the UK’s FTSE 100 (UK100) closed negative 0.06%. French political risks eased slightly with Marine Le Pen saying she would cooperate with French President Macron if she wins the upcoming French election.
WTI crude oil prices held above the $80 per barrel mark on Tuesday, having risen nearly 2% in the previous session, thanks to an improving global demand outlook and expectations that major oil producers will keep supply low. Recent market outlook reports from OPEC, the International Energy Agency, and the US Energy Information Administration pointed to strong growth in oil demand in the second half of this year. Oil prices also followed a broad rally in risk assets as easing inflationary pressures in major economies boosted hopes of interest rate cuts in the coming months.
Asian markets were predominantly falling yesterday. Japan’s Nikkei 225 (JP225) fell by 1.83%, China’s FTSE China A50 (CHA50) was down 0.17%, Hong Kong’s Hang Seng (HK50) lost 0.03%, and Australia’s ASX 200 (AU200) was negative 0.31%.
The Reserve Bank of Australia (RBA) kept the cash rate at 4.35% at its June meeting, leaving borrowing costs unchanged for the fifth time. At the same time, the Central Bank again warned that inflation is still above the mid-point of the target range of 2–3% due to the continued high cost of services. The board is still not ruling anything out and will rely on incoming data. At the same time, there have been signs of softening economic activity, as evidenced by slowing GDP growth, rising joblessness, and slower-than-expected wage growth.
Bank of Japan Governor Kazuo Ueda told the Japanese Parliament that he may raise interest rates again at the July meeting depending on upcoming economic data. He also noted that rising import costs caused by a weak yen could hurt household spending but added that rising wages could boost consumption. This could be the foundation for a trend reversal in the yen.
S&P 500 (US500) 5,473.23 +41.63 (+0.77%)
Dow Jones (US30) 38,778.10 +188.94 (+0.49%)
DAX (DE40) 18,068.21 +66.19 (+0.37%)
FTSE 100 (UK100) 8,142.15 −4.71 (−0.06%)
USD Index 105.34 −0.21 (−0.2%)
Important events today:
– Australia RBA Interest Rate Decision at 07:30 (GMT+3);
– Australia RBA Rate Statement at 07:30 (GMT+3);
– Australia RBA Press Conference at 08:30 (GMT+3);
– German ZEW Economic Sentiment (m/m) at 12:00 (GMT+3);
– Eurozone ZEW Economic Sentiment (m/m) at 12:00 (GMT+3);
– Eurozone Consumer Price Index (m/m) at 12:00 (GMT+3);
– US Retail Sales (m/m) at 15:30 (GMT+3);
– US Industrial Production (m/m) at 16:15 (GMT+3).
This article reflects a personal opinion and should not be interpreted as an investment advice, and/or offer, and/or a persistent request for carrying out financial transactions, and/or a guarantee, and/or a forecast of future events.
Technical Analyst Clive Maund shares why he believes American Salars Lithium Inc. (USLI:CSE) is a Strong Buy, including the recent news that it acquired a new project.
American Salars Lithium Inc. (USLI:CSE) is a lithium exploration company whose stock is viewed as a Strong Buy here for both fundamental and technical reasons.
First we will consider the fundamentals of the company before proceeding to review its latest stock chart.
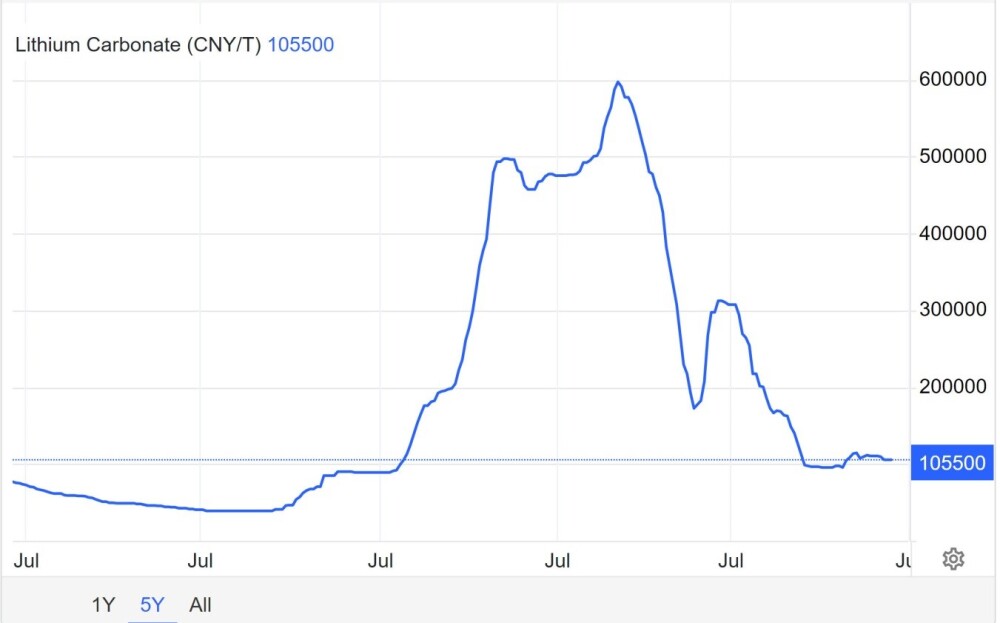
The first point to make is a general one concerning the outlook for lithium itself. As you may recall, after a massive speculative runup in 2020 and especially in 2021, the lithium price fell victim to a severe bear market that ran from mid-2022 through the end of 2023, as we can see on the following 5-year chart. By the end of last year, this bear market had exhausted itself, and a basing process began that has continued up to the present.
Chart courtesy of tradingeconomics.com
The chart implies that perhaps after some further basing action, lithium prices will start higher again in a new bull market.
Turning now to the particulars of the company itself, American Salars has a range of projects in Argentina, Canada, and the U.S. Its flagship project is the 3000 Hectare Candela II Salar project in Argentina, which features a National Instrument 43-101 inferred resource of 457,000 tonnes of lithium carbonate that is open for expansion.
Other projects include the Blackrock South lithium brine project in Nevada, located just 72 miles north of the Tesla Gigafactory. The company also has a highly prospective portfolio of projects in British Columbia and Quebec, Canada.
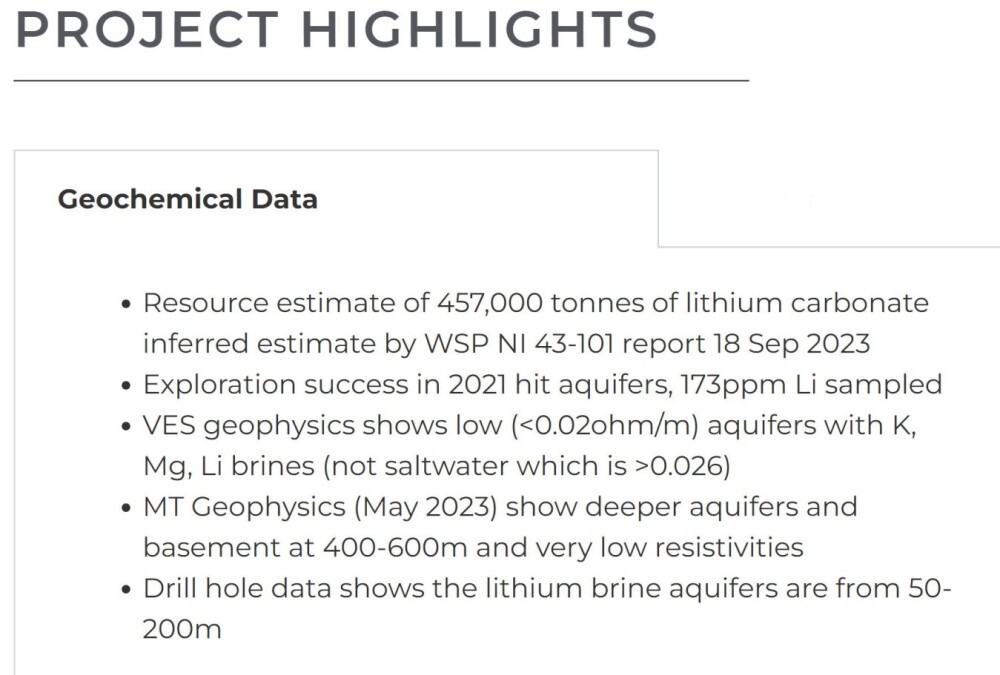
The Incahuasi Salar Project, which is easily accessible by road, is located in the province of Salta in northwestern Argentina, and it supports conditions for quality lithium mines at depth. The region has been substantially explored and it has been found that the lithium brines are close to the surface. The following picture from the company’s website gives some general information about the project.
The following excerpt, also from the company website, sets out some highlights of the project.
This photo shows drilling in progress at the Incahuasi Salar.
Turning now to the company’s other projects, which are all in the exploration stage, we will start by looking briefly at the prospective Black Rock South property in Nevada.
This picture shows the location of the project in NW Nevada and its proximity to the Tesla Gigafactory, an obvious large nearby market for the lithium extracted by the company.
At the Black Rock South property, the recent mineral exploration on the Galt claim group under option to Surge Battery Metals Inc. (NILIF:OTCMKTS;NILI:TSX-V) located 11 Miles to the South includes 51 playa sediment samples collected for chemical analysis at ALS Geochemistry in Vancouver, B.C.
Results of aqua regia leaching of the samples show 68 to 852 parts per million lithium (mean 365 ppm), 5.3 to 201 ppm cesium (mean 72 ppm) and 35 to 377 ppm rubidium (mean 180 ppm). Results from two seven-foot-deep auger holes show lithium, cesium, and rubidium concentrations in the range of 143.5 to 773 ppm Li, 56.8 to 102.5 ppm Cs and 155 to 272 Rb.
The entire San Emidio Desert basin is a highly prospective lithium exploration zone and is about 38 km long and up to 11 km wide at the widest point, with the central playa measuring about 8.5 km north-south and 4.5 km east-west.
A proposed four-hole drill program at the Galt project is pending permitting approval. It is designed to test a tight grouping of highly anomalous surface sediment sampling locations, which returned assay values with a high of 312 ppm lithium and a mean value of 215 ppm lithium.
The following photo gives an idea of the terrain at Black Rock South.
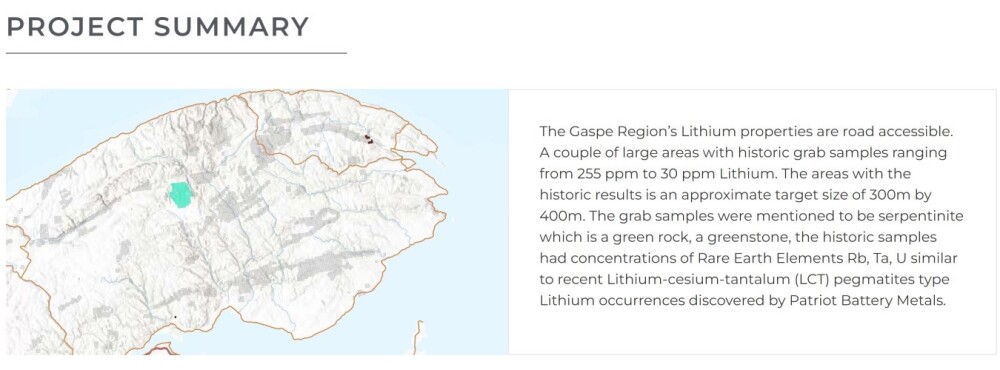
With respect to the company’s Quebec Project, this excerpt from the company website gives some details about it.
Lastly the company’s La Isla property in British Columbia is not lithium but gold with some copper and this excerpt from the company website gives some details about it. Note that this description continues on and the balance of it can be read on the relevant page on the website, the important closing sentence of which reads.
“Results to date from the Isla property demonstrate strong potential for gold and copper bearing mineralization that warrants further geological, geochemical, and geophysical exploration.”
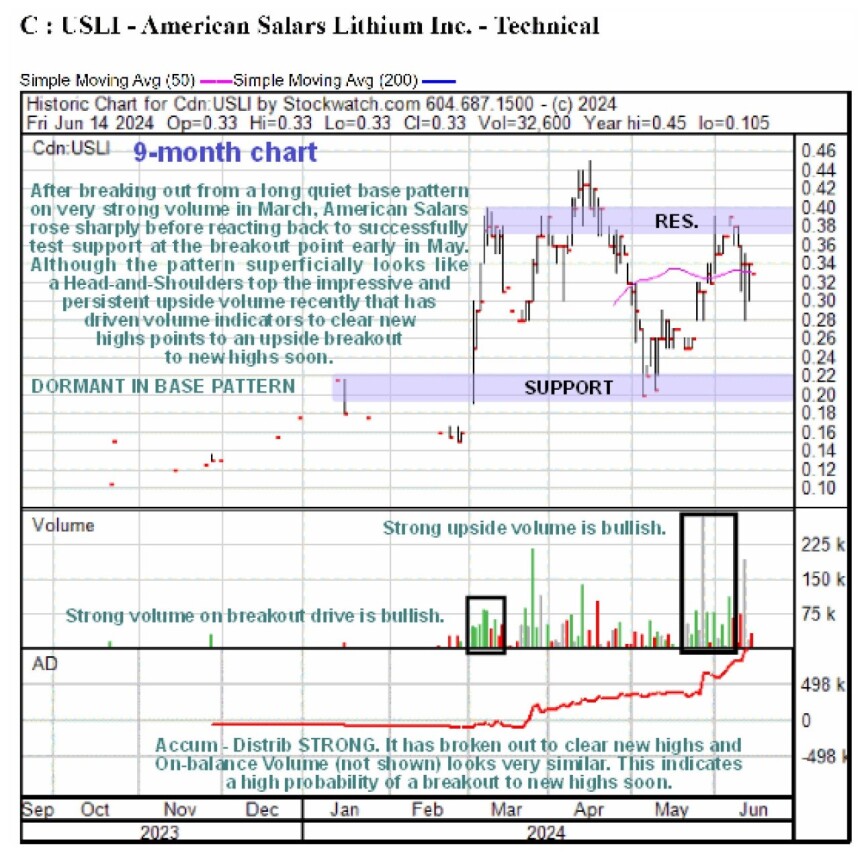
Now we will examine the latest stock chart for the company to see what it portends and we will use a 9-month chart which shows the entire history of the stock from its inception on this market.
As we can see, the stock was “dormant” from September through late February, marking out a low base with almost no trading. Hence the “fly specked” appearance of the chart up to that point, but in March, it suddenly came to life, blasting higher on strong volume to double in price in a matter of a few days. However, since that early March surge, it has meandered around in a rather erratic manner, dropping back hard during the second half of April and early May to successfully test the support shown at the breakout point.
Whilst some might interpret the erratic pattern from the early March surge to be some kind of top area, this is not thought to be the case at all. In the first place, the high volume breakout that we saw in early March has strong bullish implications and should mark the start of a major bull market.
Secondly, the recurrent heavy upside volume since early March is also bullish, especially as it has driven both volume indicators, the Accumulation line and the On-balance Volume line (not shown), to stage breakouts to clear new highs on the high volume advance late in May and early this month. This is a powerful indication that the stock is destined to break out above the resistance to clear new highs soon despite the dip of the past week or so, and with respect to this, we should recall that lithium itself is looking set to break out into a new bull market soon as we saw above.
Last, and certainly not least, there was big news out this morning (June 17) thatAMERICAN SALARS ACQUIRES POCITOS LITHIUM SALAR PROJECT WITH INFERRED LITHIUM CARBONATE MINERAL RESOURCE. This is clearly a major positive development for the company because this project has an NI 43-101 Mineral Resource Estimate (“MRE”) prepared in December 2023, consisting of an inferred 760,000-tonne lithium carbonate equivalent (“LCE”).
The conclusion is that American Salars is on course to break out to new highs soon, so anyone holding should stay long, and it is rated a Strong Buy here. Upon breaking out to new highs, a likely initial target for the upleg that follows is the CA$0.60 area.
American Salars Lithium Inc. (USLI:CSE) closed for trading at CA$0.33 on June 14, 2024.
Important Disclosures:
American Salars Lithium Inc. has a consulting relationship with an affiliate of Streetwise Reports, and pays a monthly consulting fee between US$8,000 and US$20,000. For this article, the Company has paid Street Smart, an affiliate of Streetwise Reports, US$1,500 in addition to the monthly consulting fee.
As of the date of this article, officers and/or employees of Streetwise Reports LLC (including members of their household) own securities of American Salars Lithium Inc.
Author Certification and Compensation: [Clive Maund of clivemaund.com] was retained and compensated as an independent contractor by Street Smart to write this article. Mr. Maund is a technical analyst who analyzes historical trading data and he received his UK Technical Analysts’ Diploma in 1989. The recommendations and opinions expressed in this content reflect the personal, independent, and objective views of the author regarding any and all of the companies discussed. No part of the compensation received by the author was, is, or will be directly or indirectly tied to the specific recommendations or views expressed.
Statements and opinions expressed are the opinions of the author and not of Streetwise Reports, Street Smart, or their officers. The author is wholly responsible for the accuracy of the statements. Streetwise Reports requires contributing authors to disclose any shareholdings in, or economic relationships with, companies that they write about. Any disclosures from the author can be found below. Streetwise Reports relies upon the authors to accurately provide this information and Streetwise Reports has no means of verifying its accuracy.
This article does not constitute investment advice and is not a solicitation for any investment. Streetwise Reports does not render general or specific investment advice and the information on Streetwise Reports should not be considered a recommendation to buy or sell any security. Each reader is encouraged to consult with his or her personal financial adviser and perform their own comprehensive investment research. By opening this page, each reader accepts and agrees to Streetwise Reports’ terms of use and full legal disclaimer. Streetwise Reports does not endorse or recommend the business, products, services, or securities of any company.
The above represents the opinion and analysis of Mr. Maund, based on data available to him, at the time of writing. Mr. Maund’s opinions are his own, and are not a recommendation or an offer to buy or sell securities. As trading and investing in any financial markets may involve serious risk of loss, Mr. Maund recommends that you consult with a qualified investment advisor, one licensed by appropriate regulatory agencies in your legal jurisdiction, and do your own due diligence and research when making any kind of a transaction with financial ramifications. Although a qualified and experienced stock market analyst, Clive Maund is not a Registered Securities Advisor. Therefore Mr. Maund’s opinions on the market and stocks cannot be construed as a recommendation or solicitation to buy and sell securities.
At Friday’s close, the Dow Jones (US30) Index was down 0.15% (for the week -0.50%), while the S&P 500 (US500) Index decreased by 0.04% (for the week +1.69%). The NASDAQ Technology Index (US100) closed positive 0.12% (for the week +3.54%). Hawkish comments from Fed Chair Cleveland Mester bolstered the US dollar and pressured stocks when she said she wanted to see a few more months of good inflation data before cutting interest rates.
The University of Michigan’s US consumer sentiment index for June unexpectedly fell by 2.5 to a 7-month low of 65.6, weaker than expectations for a rise to 72.0. The University of Michigan’s US 1-year inflation expectations indicator for June was unchanged from May at 3.3%, which was weaker than expectations of a decline to 3.2%. The 5-10 year inflation expectations indicator rose to a 7-month high of 3.1% in June, above expectations of no change at 3.0%.
Equity markets in Europe mostly fell on Friday. The German DAX (DE40) fell by 1.44% (for the week -2.96%), the French CAC 40 (FR40) closed down 2.66% (for the week -3.96%), the Spanish IBEX 35 (ES35) decreased by 0.67% (for the week -3.37%), and the UK FTSE 100 (UK100) closed negative 0.21% (for the week -1.19%) on Friday. European markets are increasingly anxious about European politics after French President Macron announced snap legislative elections following his party’s defeat in last Sunday’s European Parliament elections.
Centeno, a spokesman for the ECB’s governing council, said the ECB should be cautious in bringing interest rates to levels that neither stimulate nor restrain the economy, suggesting the ECB would not be in a hurry before cutting rates again. His colleague, ECB Governing Council spokesman Vasle, said there is a good chance that cutting interest rates will be much slower than the process of raising rates. Swaps discount the odds of a 25 bps ECB rate cut by 16% for the 18 July meeting and 63% for the 12 September meeting.
Oil prices rose nearly 4% last week due to improved global demand forecasts, and OPEC’s current production policy continues to support the market. Despite the announcement that it may begin phasing out voluntary cuts in October, the group continues to stress that it will force non-compliant members to cut production in the coming months.
Asian markets were predominantly up last week. Japan’s Nikkei 225 (JP225) gained 0.32% for the week, China’s FTSE China A50 (CHA50) closed around its opening level for the week, Hong Kong’s Hang Seng (HK50) fell by 3.34% for the week and Australia’s ASX 200 (AU200) was negative 1.25%. Hong Kong’s Hang Seng Index (HK50) hit a six-week low on Monday. Hong Kong stocks have come under pressure in recent weeks as the prospect of lower US interest rates and further Western economic sanctions on Chinese companies have undermined investor confidence.
The offshore yuan stabilized at 7.26 per dollar as traders processed a variety of economic indicators from China. The country’s retail sales rose to a three-month high of 3.7% year-on-year in May, accelerating from a fifteen-month low of 2.3% in the previous month and exceeding the forecast growth of 3%, signaling a rebound in consumer spending. However, the broader economic picture remained mixed, with industrial production and fixed asset investment coming in below market forecasts in May and the urban unemployment rate remaining unchanged at 5%. On the monetary policy front, the People’s Bank of China (PBoC) decided to leave the medium-term lending rate unchanged at 2.5% for 10 consecutive months, which was widely expected.
S&P 500 (US500) 5,431.60 −2.14 (−0.04%)
Dow Jones (US30) 38,589.16 −57.94 (−0.15%)
DAX (DE40) 18,002.02 −263.66 (−1.44%)
FTSE 100 (UK100) 8,146.86 −16.81 (−0.21%)
USD Index 105.51 −0.04 (−0.04%)
Important events today:
– China Industrial Production (m/m) at 05:00 (GMT+3);
– China Retail Sales (m/m) at 05:00 (GMT+3);
– China Unemployment Rate (m/m) at 05:00 (GMT+3);
– US NY Empire State Manufacturing Index at 15:30 (GMT+3);
This article reflects a personal opinion and should not be interpreted as an investment advice, and/or offer, and/or a persistent request for carrying out financial transactions, and/or a guarantee, and/or a forecast of future events.
Like other major currencies, the New Zealand dollar is under pressure from the strong US dollar. This development comes after the Federal Reserve’s updated forecasts last week. Stock market expectations point to only one interest rate cut this year, most likely in December.
Earlier, some American monetary policymakers confirmed these expectations, calling them reasonable.
The New Zealand services sector experienced a significant downturn in May, dropping the indicator to its lowest value since 2007. This reflects the country’s economic state, which is already in recession. The business activity index also decreased to 43.0 points from 46.6 points previously. Everything below the 50.0-point mark indicates a deterioration in the market situation.
Such data increases the likelihood that the Reserve Bank of New Zealand will decide to cut rates eventually. The main forecast is November. However, the RBNZ’s position, which has been voiced repeatedly, is that in 2024, the rates are unlikely to be revised down. The Central Bank believes that any reduction is not likely before mid-2025.
NZD/USD Technical Analysis
On the H4 NZD/USD chart, the market executed a correction wave to the level of 0.6220. At the moment, the market is forming another wave following the downward trend. The first target is at 0.6055. After reaching this level, a correction link to 0.6140 is possible (test from below). Next, we will consider a new wave of decline to 0.6016, the local target. Technically, this scenario is confirmed by the MACD indicator. Its signal line is located below the zero mark and is directed strictly downwards.
On the H1 NZD/USD chart, a downward impulse has been executed towards 0.6140. At the moment, a consolidation range has formed around this level. Today, we expect an exit from this range down to 0.6080. After reaching this level, a correction link to 0.6140 is possible (test from below), followed by a further decrease to 0.6055. The first target is trending down. Technically, this scenario is also confirmed by the Stochastic oscillator. Its signal line is located below the 20 mark and is directed strictly downwards.
Disclaimer
Any forecasts contained herein are based on the author’s particular opinion. This analysis may not be treated as trading advice. RoboForex bears no responsibility for trading results based on trading recommendations and reviews contained herein.
The Japanese yen exchange rate paired with the US dollar looks unimpressive by the end of this week. The USD/JPY pair rose to almost 158.00 immediately after the end of the June meeting of the Bank of Japan, which left the interest rate unchanged. Everything went according to expectations.
In March, the BoJ raised the rate for the first time in seven years, moving it from negative territory to zero.
In its comments, the regulator noted that it will continue to buy Japanese government bonds at the same pace as agreed in March until its July meeting. Thus, market expectations were ignored, which worked against the JPY. Investors hoped that the BoJ would at least carefully consider gradually reducing its balance sheet through government bonds as part of a smooth monetary policy transition from quantitative easing to tightening.
Previously, Bank of Japan Governor Kazuo Ueda confirmed the regulator’s intention to gradually reduce its substantial balance sheet in the future. However, the timing of this action remains uncertain.
USD/JPY Technical Analysis
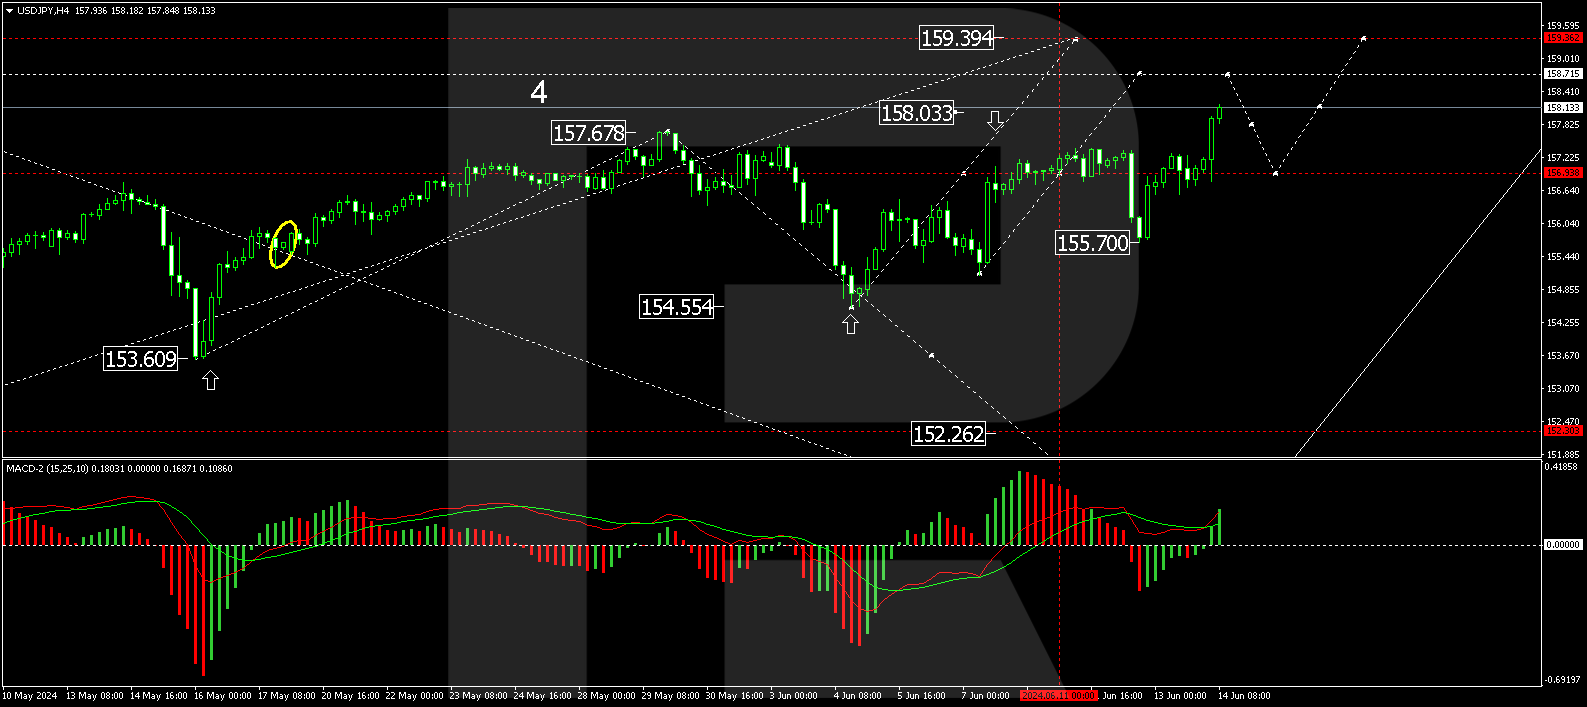
On the H4 USD/JPY chart, the market has breached 157.47 upwards and is continuing to develop a growth wave towards 158.74. After reaching this level, a correction down to the level of 157.47 is a possibility (test from above). We will then assess the probability of continuing the growth wave to 159.36. Technically, this scenario is supported by the MACD indicator, with its signal line above the zero level and pointing upwards.
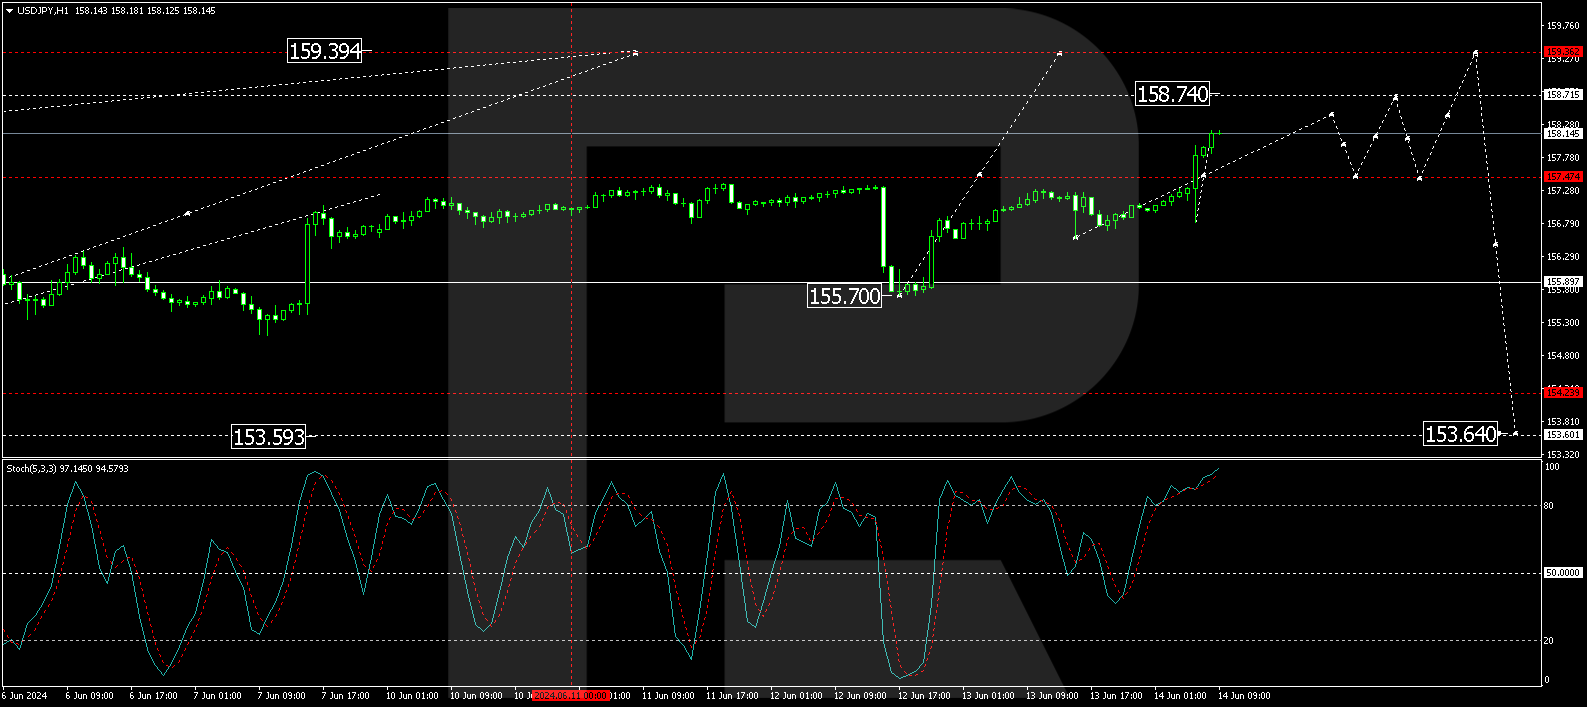
On the H1 USD/JPY chart, the market continues to develop a wave of growth to the level of 158.40. Further, a correction wave to 157.47 is possible, followed by growth to 158.74, the local target. Technically, this scenario is confirmed by the Stochastic oscillator, with its signal line above level 80 and preparing to decline to level 20.
Disclaimer
Any forecasts contained herein are based on the author’s particular opinion. This analysis may not be treated as trading advice. RoboForex bears no responsibility for trading results based on trading recommendations and reviews contained herein.