
By RoboForex Analytical Department
Like other major currencies, the New Zealand dollar is under pressure from the strong US dollar. This development comes after the Federal Reserve’s updated forecasts last week. Stock market expectations point to only one interest rate cut this year, most likely in December.
Earlier, some American monetary policymakers confirmed these expectations, calling them reasonable.
The New Zealand services sector experienced a significant downturn in May, dropping the indicator to its lowest value since 2007. This reflects the country’s economic state, which is already in recession. The business activity index also decreased to 43.0 points from 46.6 points previously. Everything below the 50.0-point mark indicates a deterioration in the market situation.
Such data increases the likelihood that the Reserve Bank of New Zealand will decide to cut rates eventually. The main forecast is November. However, the RBNZ’s position, which has been voiced repeatedly, is that in 2024, the rates are unlikely to be revised down. The Central Bank believes that any reduction is not likely before mid-2025.
NZD/USD Technical Analysis
Free Reports:
 Get our Weekly Commitment of Traders Reports - See where the biggest traders (Hedge Funds and Commercial Hedgers) are positioned in the futures markets on a weekly basis.
 Sign Up for Our Stock Market Newsletter – Get updated on News, Charts & Rankings of Public Companies when you join our Stocks Newsletter
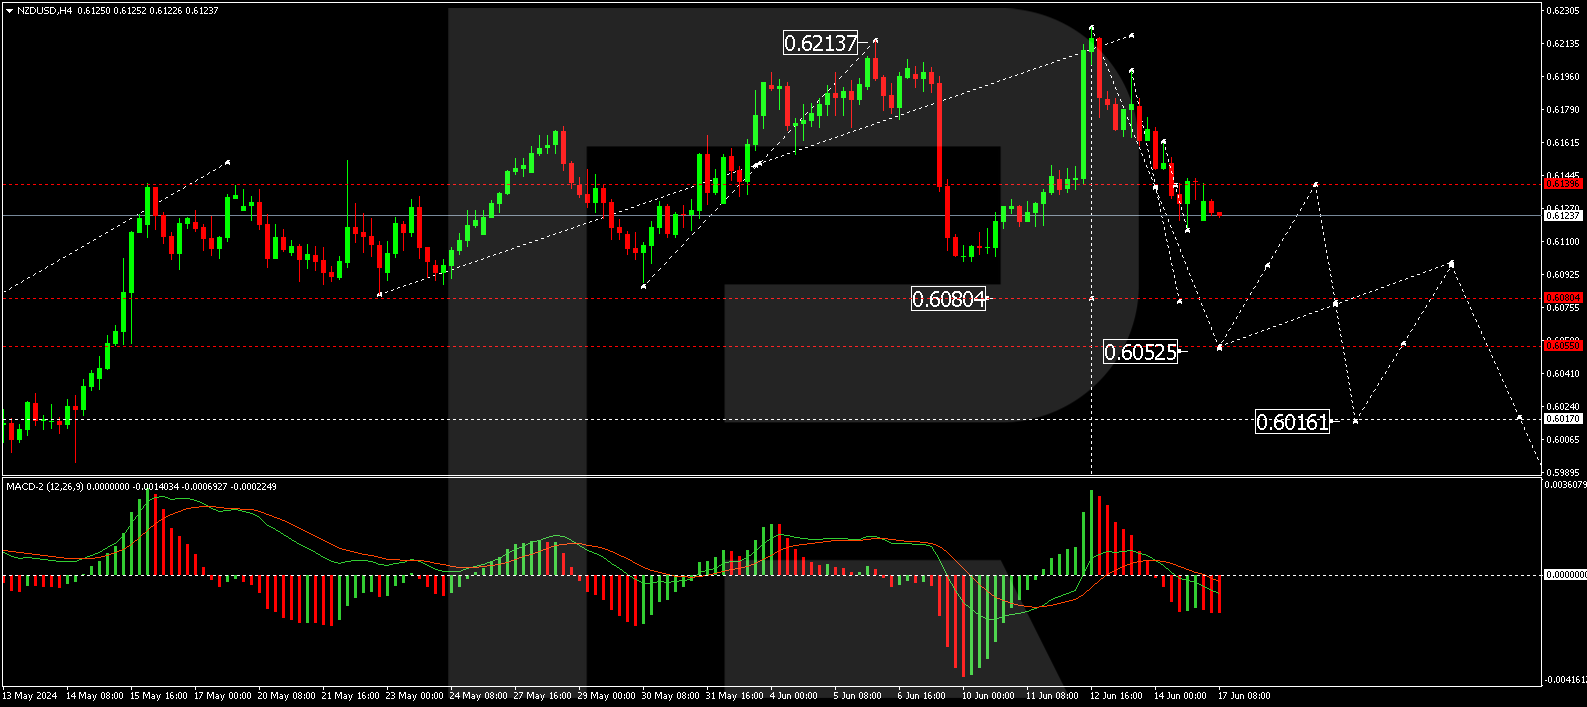
On the H4 NZD/USD chart, the market executed a correction wave to the level of 0.6220. At the moment, the market is forming another wave following the downward trend. The first target is at 0.6055. After reaching this level, a correction link to 0.6140 is possible (test from below). Next, we will consider a new wave of decline to 0.6016, the local target. Technically, this scenario is confirmed by the MACD indicator. Its signal line is located below the zero mark and is directed strictly downwards.
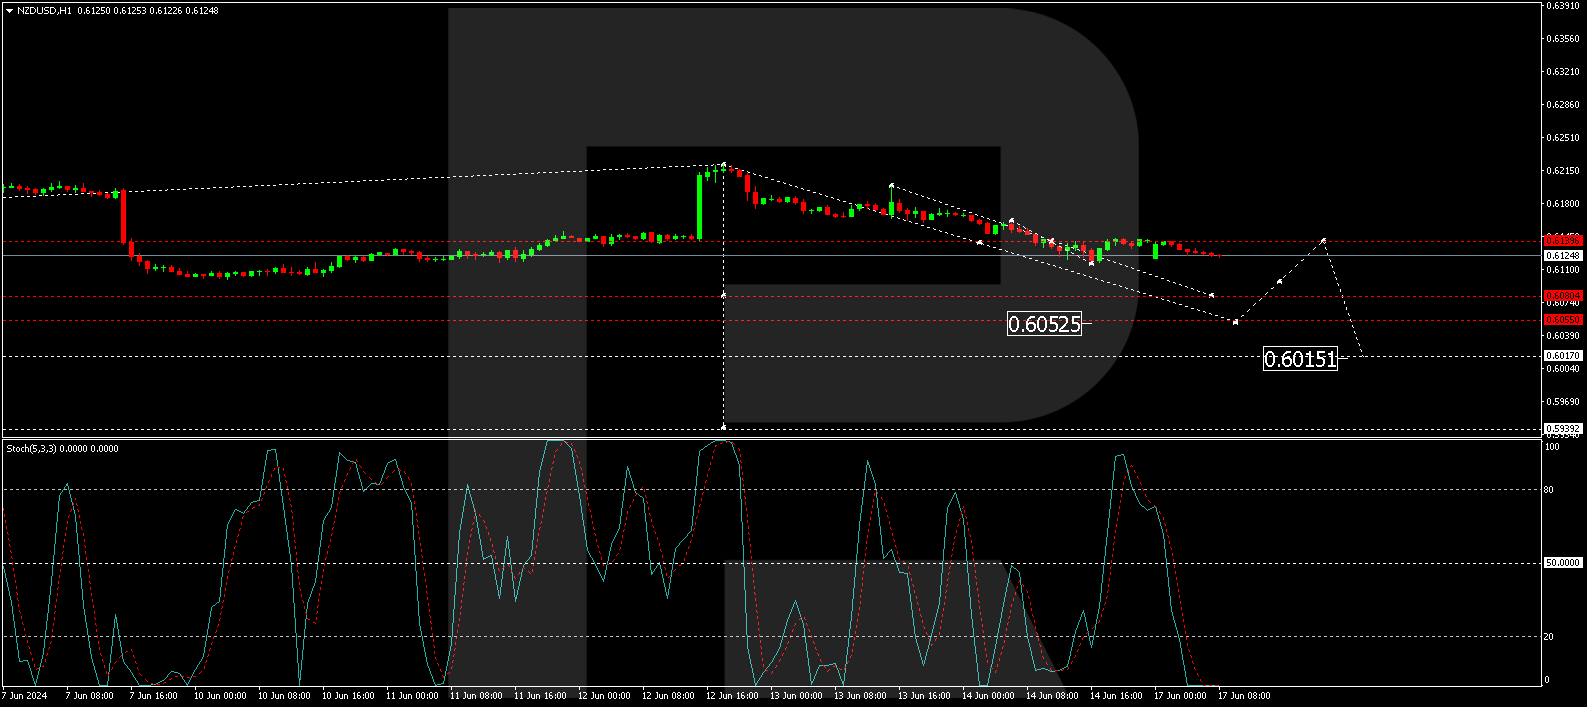
On the H1 NZD/USD chart, a downward impulse has been executed towards 0.6140. At the moment, a consolidation range has formed around this level. Today, we expect an exit from this range down to 0.6080. After reaching this level, a correction link to 0.6140 is possible (test from below), followed by a further decrease to 0.6055. The first target is trending down. Technically, this scenario is also confirmed by the Stochastic oscillator. Its signal line is located below the 20 mark and is directed strictly downwards.
Disclaimer
Any forecasts contained herein are based on the author’s particular opinion. This analysis may not be treated as trading advice. RoboForex bears no responsibility for trading results based on trading recommendations and reviews contained herein.

- The US and European stock indices are rising again amid renewed investor interest in the AI industry. Jul 10, 2026
- USD/JPY Falls as Yen Recovers Weekly Losses Jul 10, 2026
- Crude oil prices surged sharply by 7% in reaction to the rapid escalation of the conflict in the Middle East Jul 9, 2026
- Middle East Tensions Weigh on Gold Jul 9, 2026
- Pound Awaits Tighter Policy from Bank of England Jul 8, 2026
- The United States carried out airstrikes on Iran after Iran’s attacked tankers in the Strait of Hormuz. The RBNZ raised the interest rate to 2.5% Jul 8, 2026
- RoboForex Brings Full-Scale Trading to Telegram Jul 7, 2026
- Your Bourse Integrates TradingView Charts and Trading Platform Library with Trade Server Jul 7, 2026
- Yen Still Under Pressure: Markets Await Action from Authorities Jul 7, 2026
- Germany’s DAX Index has updated its all‑time high. OPEC+ countries have agreed to increase production Jul 7, 2026