
By RoboForex Analytical Department
The NZD/USD pair declined to 0.6135 on Wednesday, despite the New Zealand dollar performing much better in the previous session. It rose in response to the fall of the US dollar, which was triggered by weaker-than-expected US retail sales data. These results increased bets on an imminent reduction in the cost of lending by the Federal Reserve System. This caused the USD to retreat, allowing other currencies to rise.
Today, Paul Conway, the chief economist of the Reserve Bank of New Zealand, announced that the process of returning inflation to the target is progressing well. The ongoing softening of the employment sector is releasing spare capacity in the economy, likely leading to a further reduction in inflationary pressure in the economic system.
At the same time, Conway noted that the inflation reduction process may not follow the predicted timeline. An extended period of maintaining a restrictive monetary policy is necessary to achieve a lasting result, a crucial step to ensure the goal is met. The market’s attention will now shift to the upcoming Q1 GDP statistics. The data may reflect a fairly modest increase, which could hurt the NZD.
Technical analysis of NZD/USD
Free Reports:
 Sign Up for Our Stock Market Newsletter – Get updated on News, Charts & Rankings of Public Companies when you join our Stocks Newsletter
 Get our Weekly Commitment of Traders Reports - See where the biggest traders (Hedge Funds and Commercial Hedgers) are positioned in the futures markets on a weekly basis.
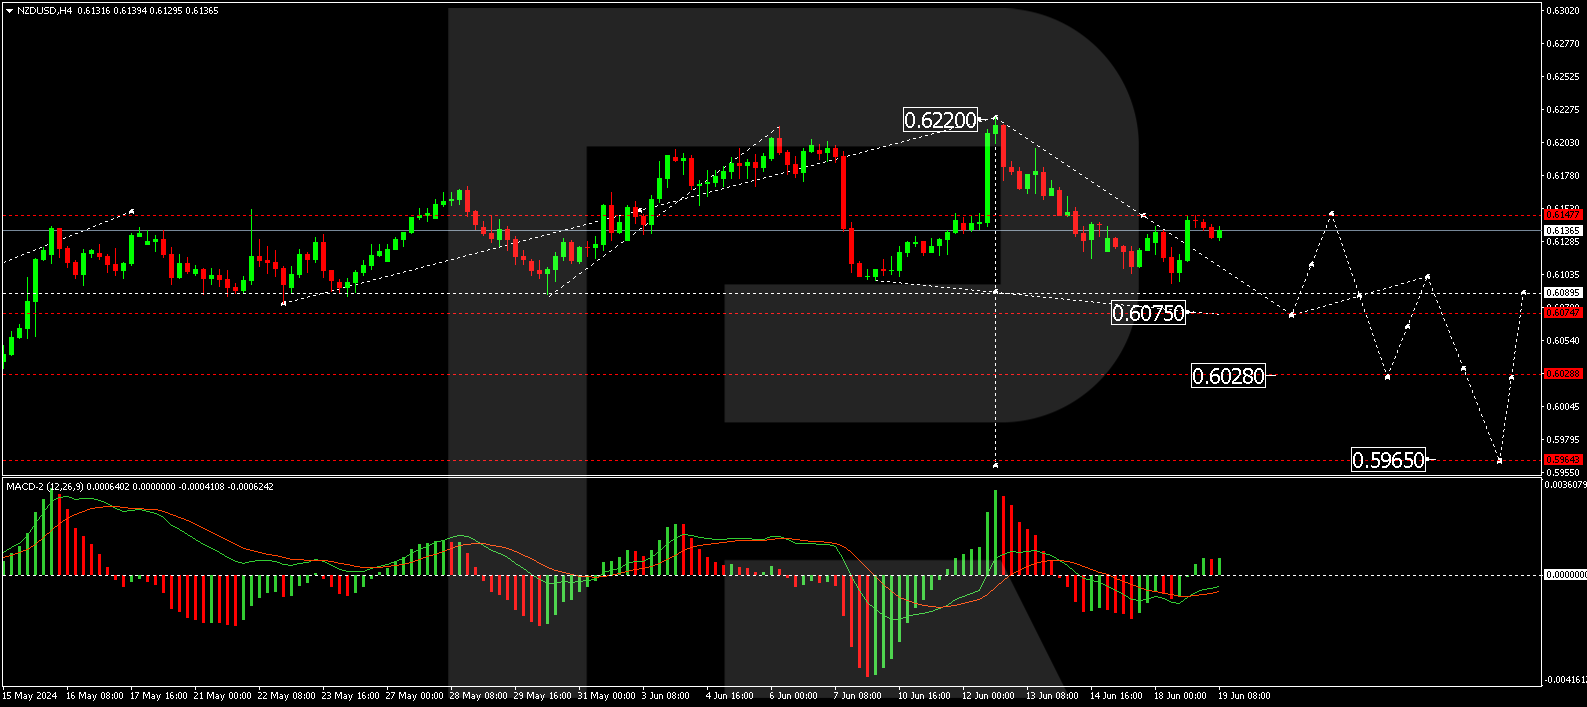
On the H4 NZD/USD chart, the market executed a wave of decline to the level of 0.6097 and a correction to the level of 0.6148. Today, we expect another downward trend to 0.6075, the first goal. After reaching this level, a correction to 0.6140 is possible (testing from below). Next, we will consider a new wave of decline to 0.6028, the local target. This scenario is technically confirmed by the MACD indicator, as its signal line is below the zero mark. An update of the lows is expected.
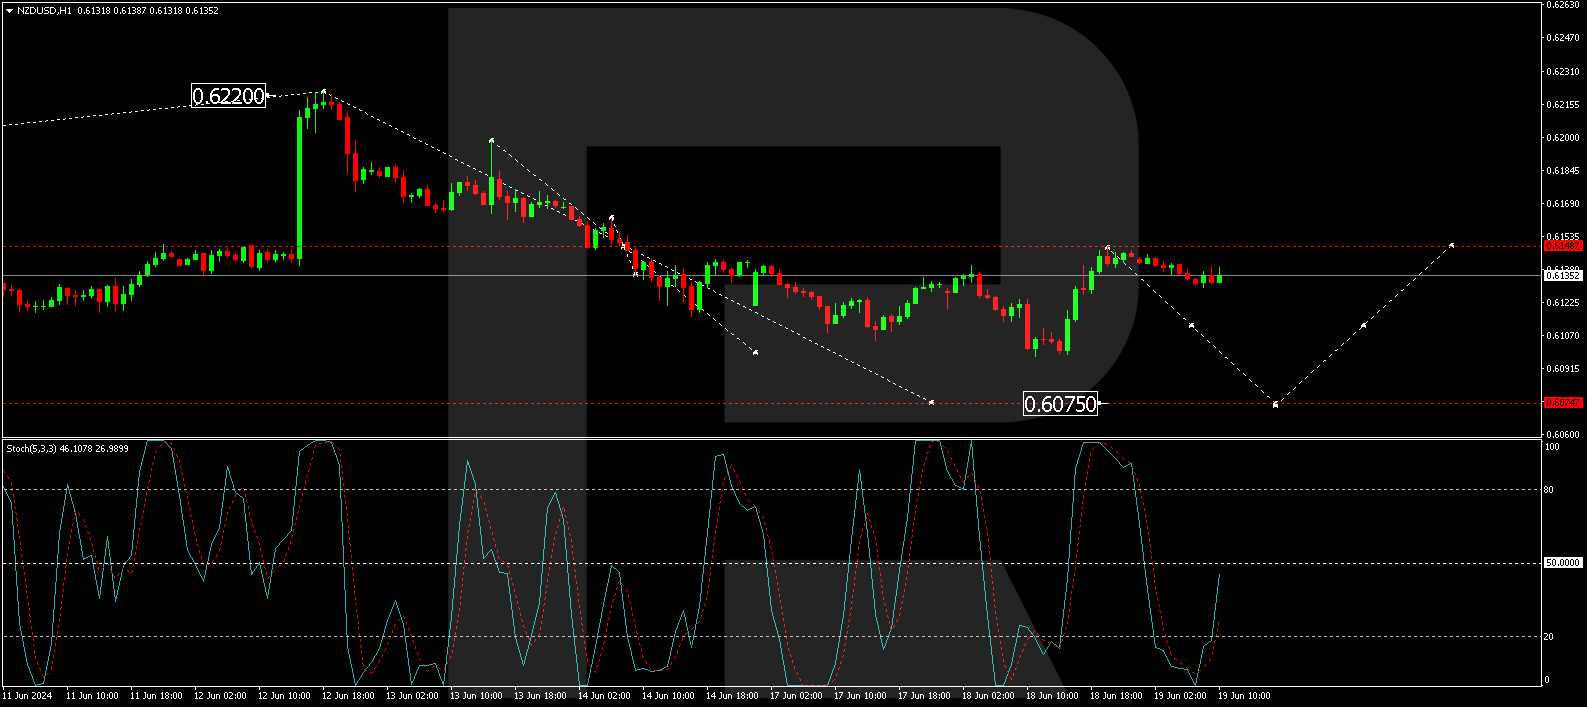
On the H1 NZD/USD chart, a correction has formed to 0.6148 (testing from below). Today, we expect a decrease to 0.6111. The breakdown of this level will open the potential for a downward trend to 0.6075. Technically, this scenario is also confirmed by the Stochastic oscillator. Its signal line is below the 50 mark, and another decline to the level of 20 is expected.
Disclaimer
Any forecasts contained herein are based on the author’s particular opinion. This analysis may not be treated as trading advice. RoboForex bears no responsibility for trading results based on trading recommendations and reviews contained herein.

- The US and European stock indices are rising again amid renewed investor interest in the AI industry. Jul 10, 2026
- USD/JPY Falls as Yen Recovers Weekly Losses Jul 10, 2026
- Crude oil prices surged sharply by 7% in reaction to the rapid escalation of the conflict in the Middle East Jul 9, 2026
- Middle East Tensions Weigh on Gold Jul 9, 2026
- Pound Awaits Tighter Policy from Bank of England Jul 8, 2026
- The United States carried out airstrikes on Iran after Iran’s attacked tankers in the Strait of Hormuz. The RBNZ raised the interest rate to 2.5% Jul 8, 2026
- RoboForex Brings Full-Scale Trading to Telegram Jul 7, 2026
- Your Bourse Integrates TradingView Charts and Trading Platform Library with Trade Server Jul 7, 2026
- Yen Still Under Pressure: Markets Await Action from Authorities Jul 7, 2026
- Germany’s DAX Index has updated its all‑time high. OPEC+ countries have agreed to increase production Jul 7, 2026