By JustMarkets
At the end of yesterday, the Dow Jones (US30) Index was up 0.77%, while the S&P 500 (US500) Index decreased by 0.25%. The NASDAQ Technology Index (US100) closed negative 0.79%. Stocks initially went up on Thursday, with the S&P 500 and Nasdaq 100 setting new record highs amid gains in chipmaker stocks. Chipmakers initially rose Thursday after Dell Technologies (DELL) CEO tweeted that his company is building an artificial intelligence factory with Nvidia (NVDA) to power Elon Musk’s xAI’s Grok supercomputer. However, a 5% drop in Qualcomm (QCOM) shares triggered a prolonged liquidation in chip stocks, negatively impacting the broader market.
Minneapolis Fed President Kashkari said it will probably take a year or two for the US to return to an inflation rate of 2%, suggesting he favors keeping interest rates on hold for longer. Weekly US initial jobless claims fell by 5,000 to 238,000, indicating a weaker labor market than expected at 235,000. US housing starts in May unexpectedly fell by 5.5% m/m to a 4-year low of 1.277 million, weaker than expectations for a rise to 1.370 million. May building permits, an indicator of future construction, unexpectedly fell by -3.8% m/m to a nearly 4-year low of 1.386 million, weaker than expectations for a rise to 1.450 million. Markets estimate the odds of a 25 bps rate cut at 10% at the next FOMC meeting on July 30-31 and 60% at the next meeting on September 17-18.
Equity markets in Europe mostly went up yesterday. Germany’s DAX (DE40) rose 1.03%, France’s CAC 40 (FR40) closed 1.34% higher, Spain’s IBEX 35 (ES35) added 0.94%, and the UK’s FTSE 100 (UK100) closed positive 0.82%.
Eurozone new car registrations for May fell 3.0% y/y to 912,000. Eurozone Consumer Confidence for June rose by 0.3 to a 2-1/3 year high of 14.0, weaker than expectations of 13.8. May German PPI was unchanged m/m and fell by 2.2% y/y, weaker than expectations of 0.1% m/m and 2.0% y/y.
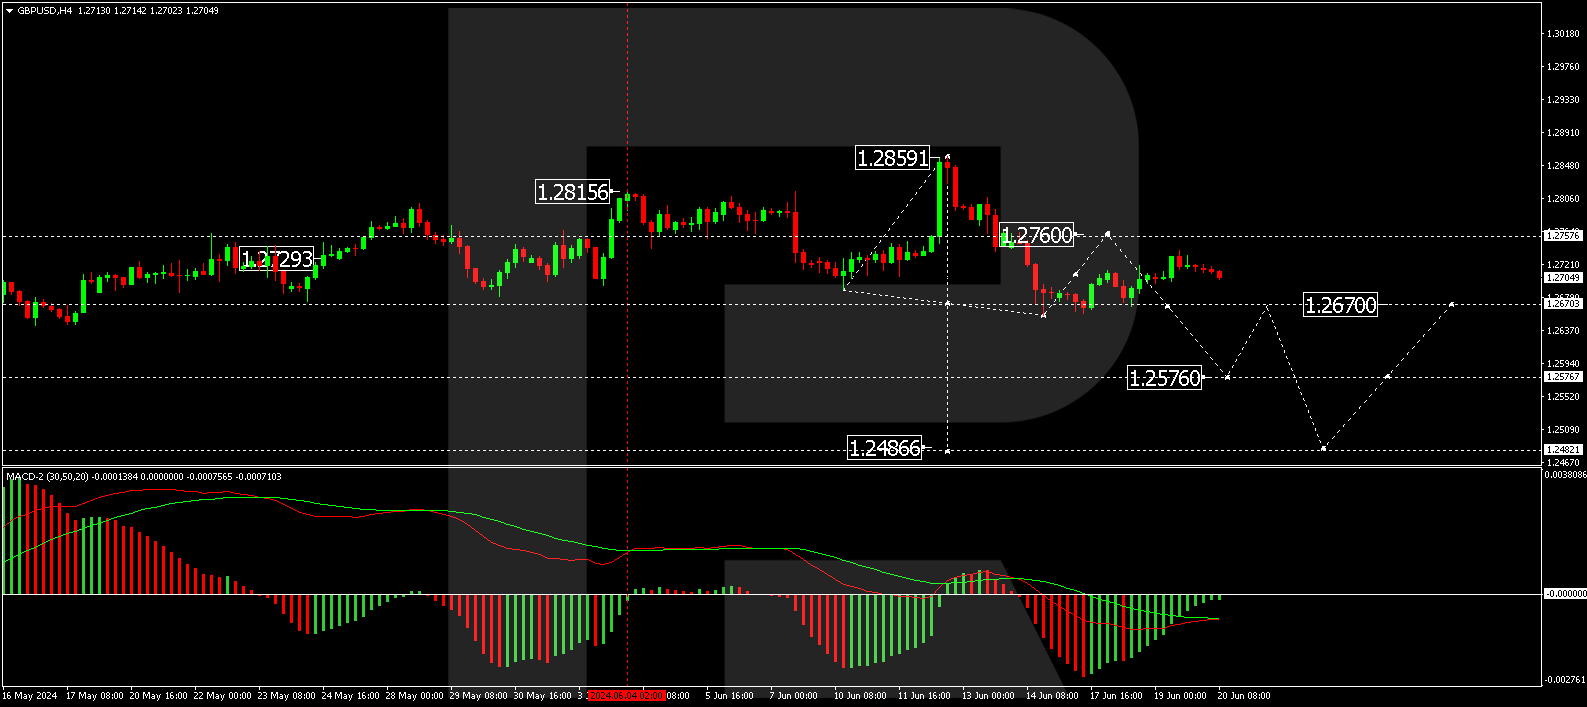
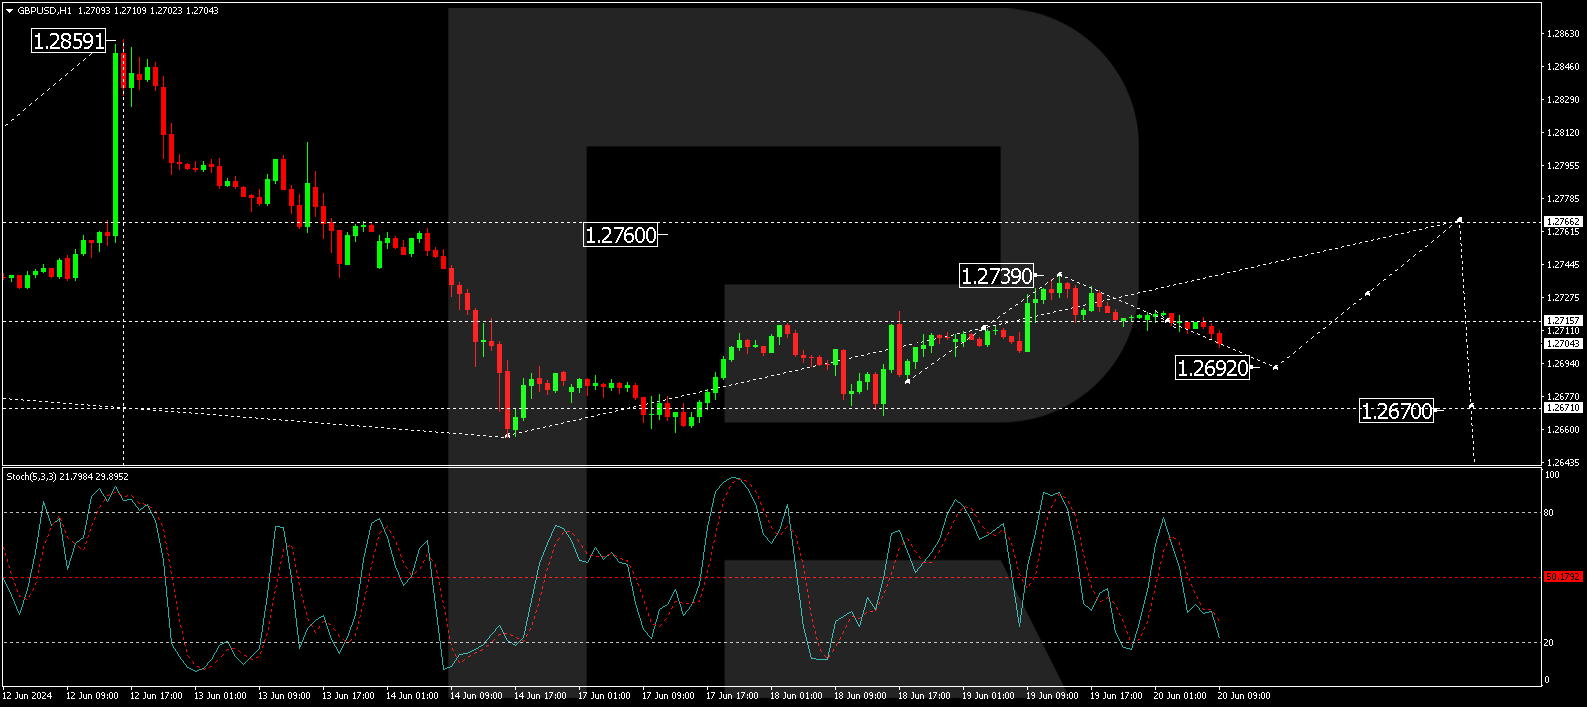
As expected, the Bank of England (BoE) left the bank rate unchanged at 5.25% on Thursday, with seven officials voting to keep the rate unchanged and two voting to cut it. The BoE said the decision not to cut rates was “finely balanced,” suggesting policymakers may be open to a rate cut in the coming months. UK retail sales rose by 2.9% month-on-month in May 2024, recovering from an upwardly revised 1.8% decline in April and well above forecasts for a 1.5% rise. That’s the biggest increase in four months.
The Swiss franc weakened by nearly 0.5% to nearly 0.89 per US dollar after the Swiss National Bank (SNB) cut its key interest rate by 25 bps to 1.25% for the second consecutive meeting. Policymakers noted a reduction in underlying inflationary pressures to keep monetary conditions accommodative. Swiss inflation was 1.4% in May.
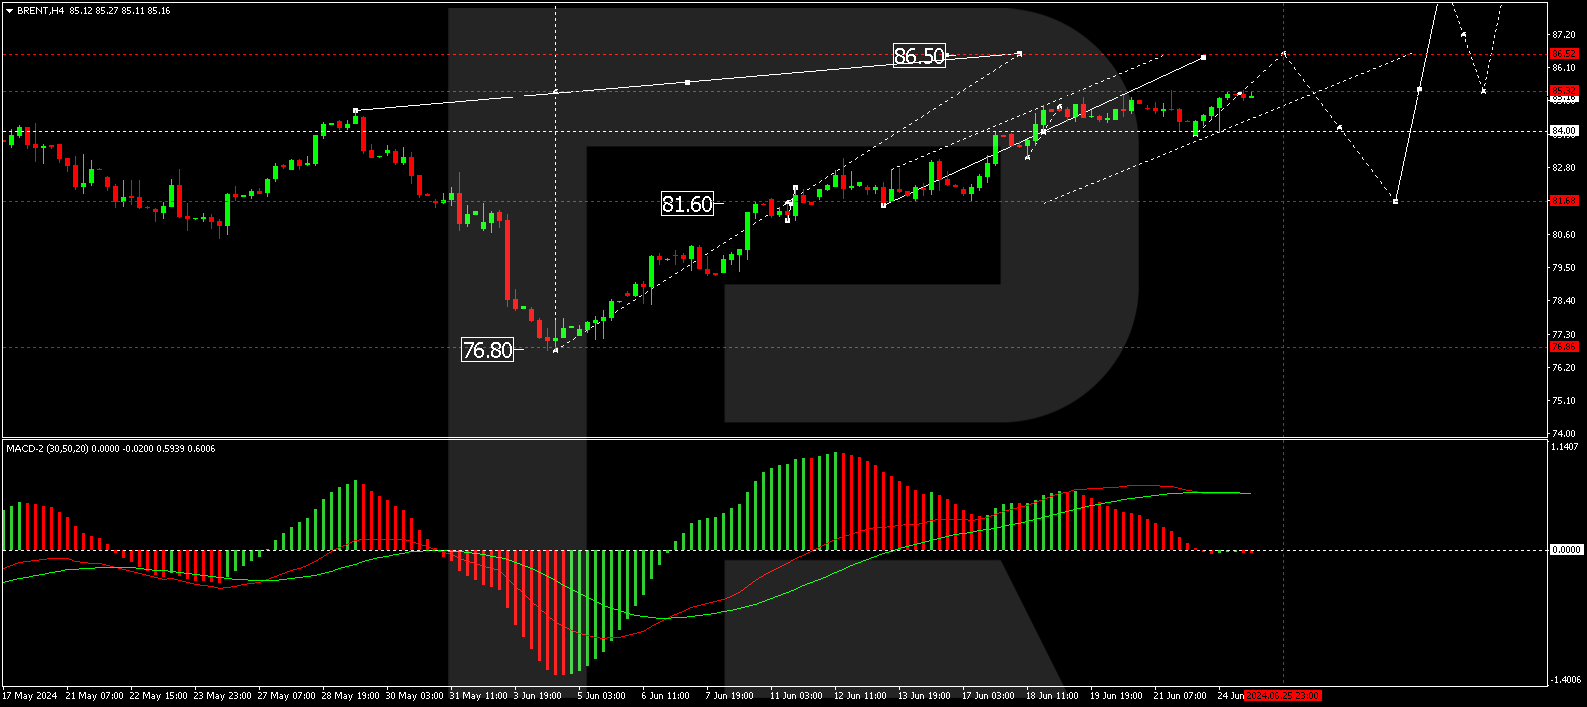
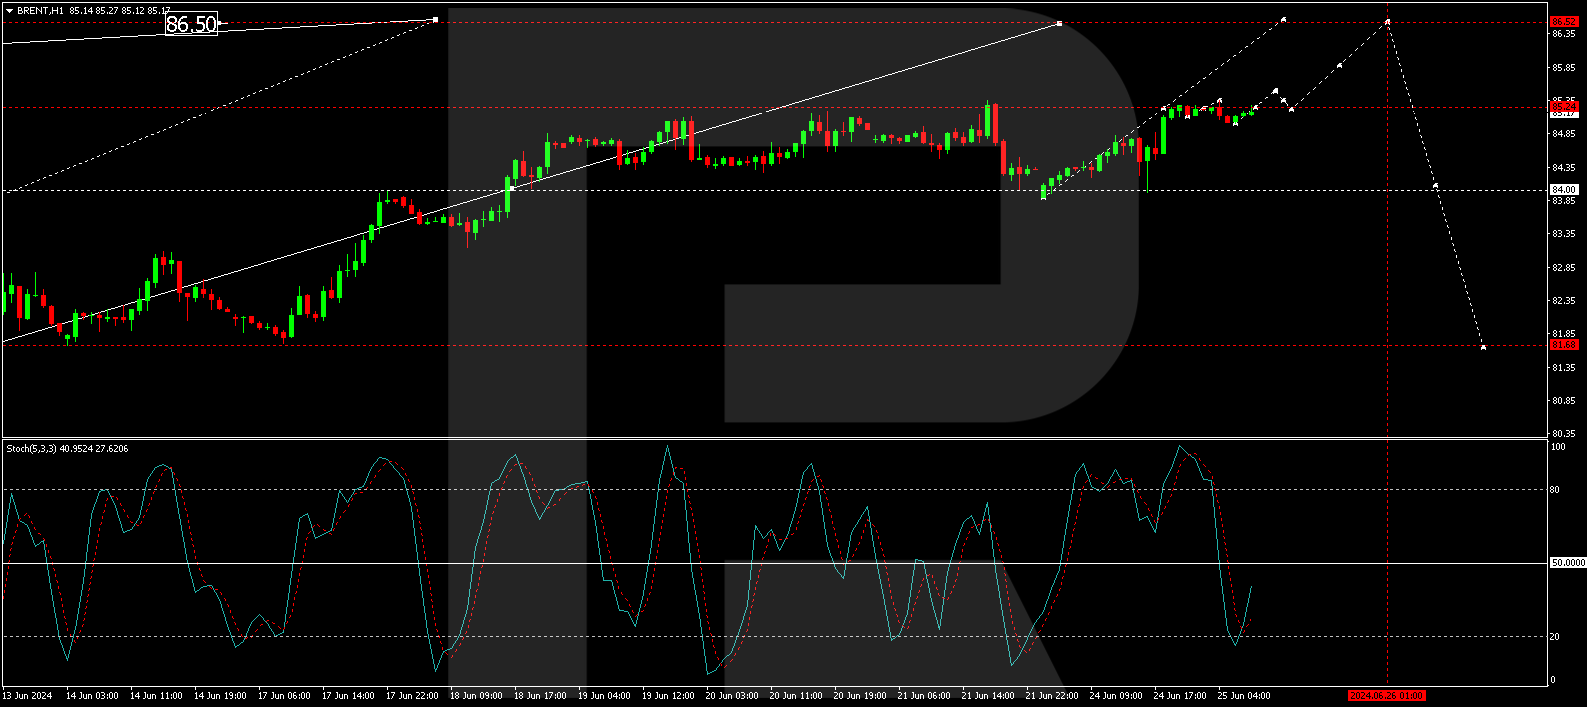
WTI crude oil prices held above $81 a barrel on Friday and rose more than 3% for the week, posting a second consecutive weekly gain as lower US crude inventories and escalating conflict in the Middle East boosted oil prices. Data released on Thursday showed US crude inventories fell by 2.547 million barrels last week, beating forecasts for a 2 million barrel decline.
Asian markets traded flat yesterday. Japan’s Nikkei 225 (JP225) gained 0.16%, China’s FTSE China A50 (CHA50) was down 0.26%, Hong Kong’s Hang Seng (HK50) lost 0.52% on Thursday, and Australia’s ASX 200 (AU200) was little changed for the day. In China, local indices continue to decline for the sixth consecutive week as an uneven economic recovery and a lack of strong political support dampen investor sentiment. Earlier this week, the People’s Bank of China (PBoC) left key lending rates unchanged despite market pressure for further policy easing.
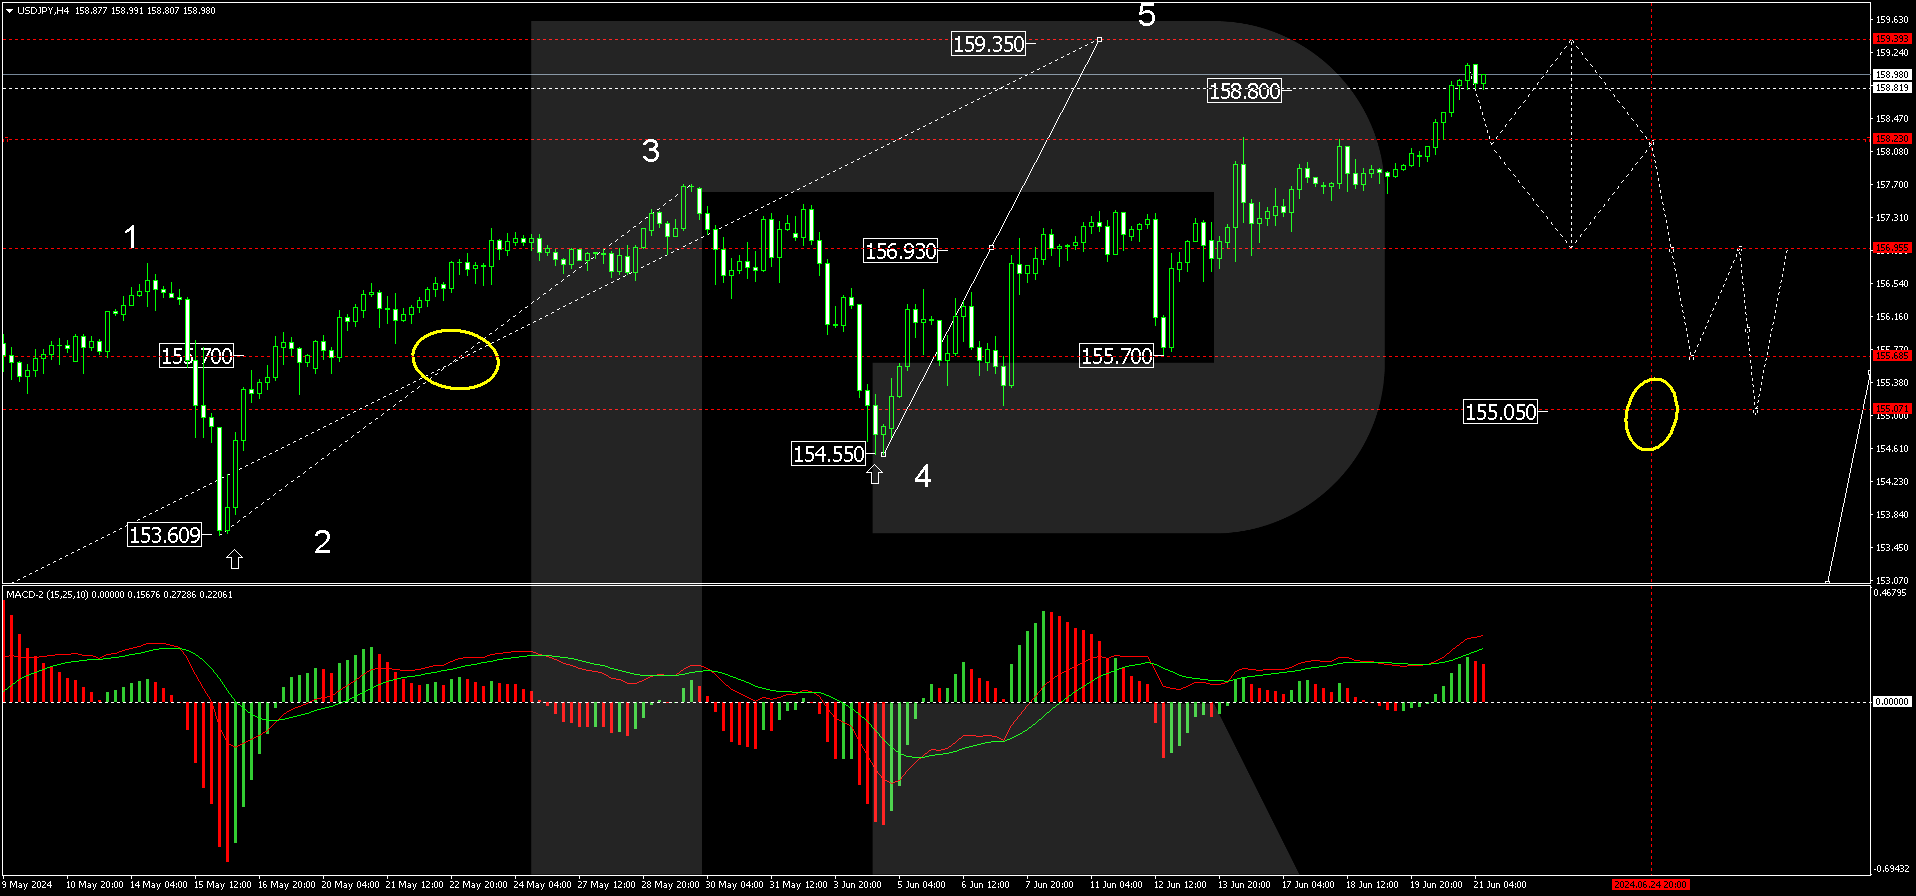
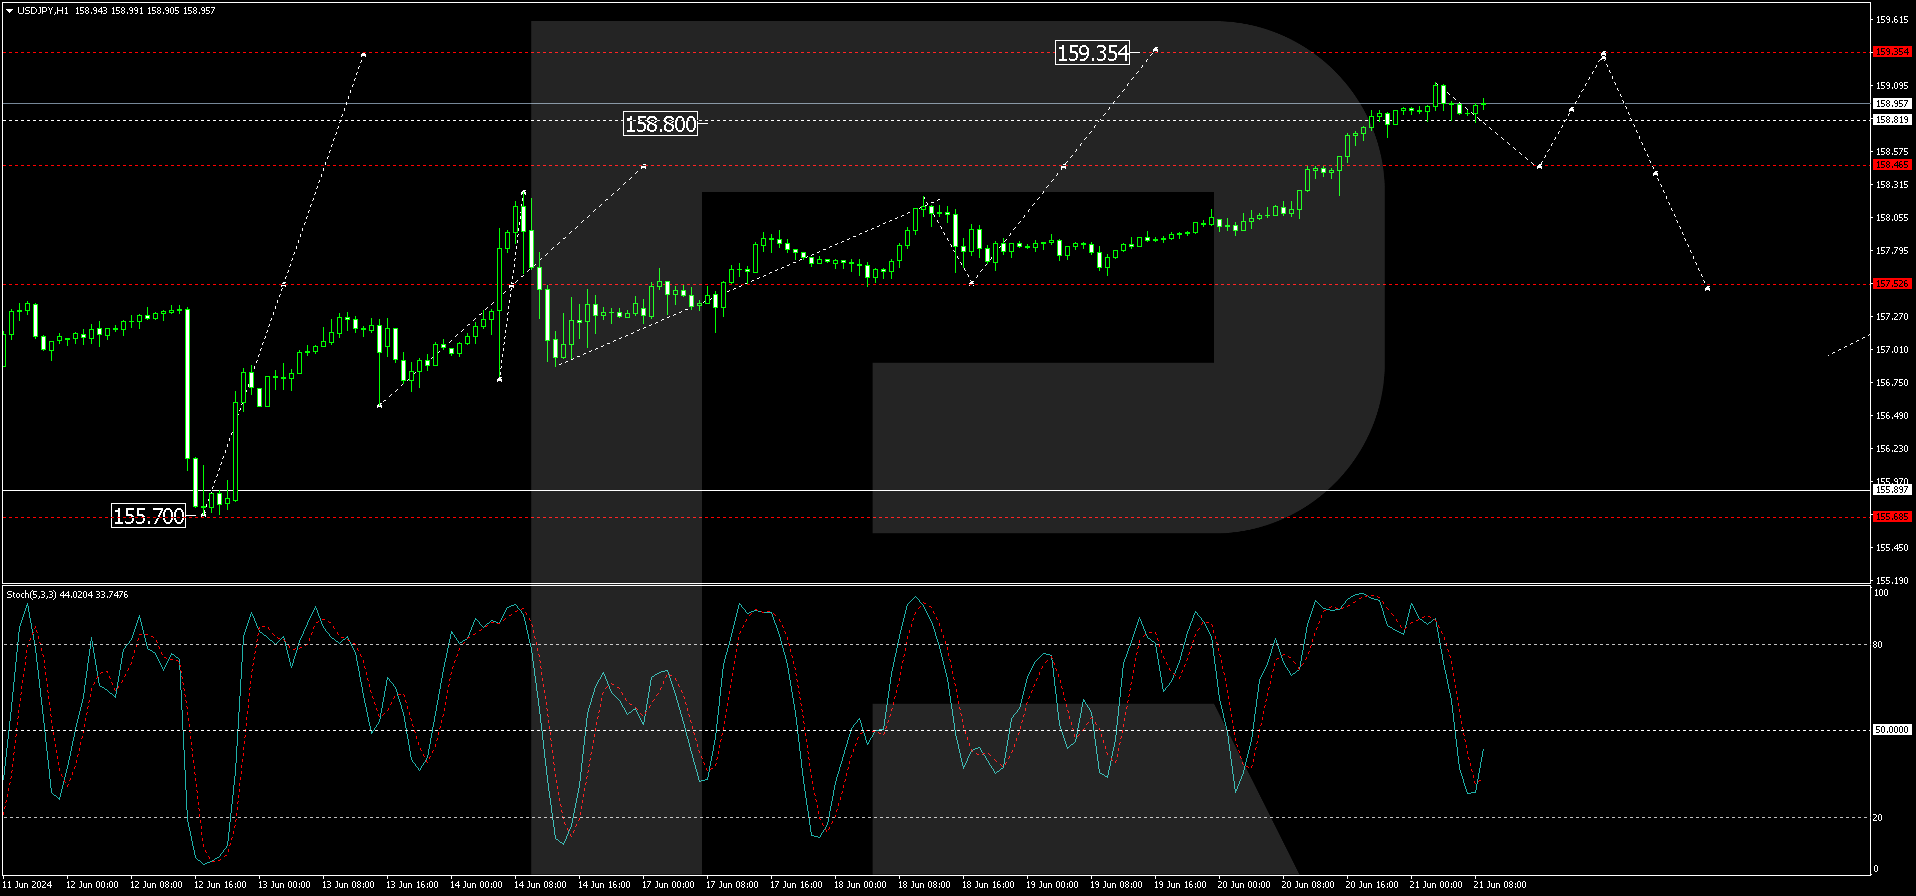
Japan’s core consumer price index, which excludes fresh food but includes fuel costs, rose by 2.5% year-on-year in May 2024, up from April’s 3-month low of 2.2% and marking the first increase since February amid a surge in energy prices, particularly electricity, as the government scrapped subsidies altogether. Meanwhile, the US Treasury Department added Japan to a list of countries monitored as currency manipulators.
S&P 500 (US500) 5,473.17 −13.86 (−0.25%)
Dow Jones (US30) 39,134.76 +299.90 (+0.77%)
DAX (DE40) 18,254.18 +186.27 (+1.03%)
FTSE 100 (UK100) 8,272.46 +67.35 (+0.82%)
USD Index 105.65 +0.40 (+0.38%)
Important events today:
- – Australia Manufacturing PMI (m/m) at 02:00 (GMT+3);
- – Australia Services PMI (m/m) at 02:00 (GMT+3);
- – Japan National Core Consumer Price Index at 02:30 (GMT+3);
- – Japan Manufacturing PMI (m/m) at 03:30 (GMT+3);
- – Japan Services PMI (m/m) at 03:30 (GMT+3);
- – UK Retail Sales (m/m) at 09:00 (GMT+3);
- – German Manufacturing PMI (m/m) at 10:30 (GMT+3);
- – German Services PMI (m/m) at 10:30 (GMT+3);
- – Eurozone Manufacturing PMI (m/m) at 11:00 (GMT+3);
- – Eurozone Services PMI (m/m) at 11:00 (GMT+3);
- – UK Manufacturing PMI (m/m) at 11:30 (GMT+3);
- – UK Services PMI (m/m) at 11:30 (GMT+3);
- – Canada Retail Sales (m/m) at 15:30 (GMT+3);
- – US Manufacturing PMI (m/m) at 16:45 (GMT+3);
- – US Services PMI (m/m) at 16:45 (GMT+3);
- – US Existing Home Sales (m/m) at 17:00 (GMT+3);
- – US Natural Gas Storage (w/w) at 17:30 (GMT+3).
By JustMarkets
This article reflects a personal opinion and should not be interpreted as an investment advice, and/or offer, and/or a persistent request for carrying out financial transactions, and/or a guarantee, and/or a forecast of future events.