
By RoboForex Analytical Department
The Japanese yen exchange rate paired with the US dollar looks unimpressive by the end of this week. The USD/JPY pair rose to almost 158.00 immediately after the end of the June meeting of the Bank of Japan, which left the interest rate unchanged. Everything went according to expectations.
In March, the BoJ raised the rate for the first time in seven years, moving it from negative territory to zero.
In its comments, the regulator noted that it will continue to buy Japanese government bonds at the same pace as agreed in March until its July meeting. Thus, market expectations were ignored, which worked against the JPY. Investors hoped that the BoJ would at least carefully consider gradually reducing its balance sheet through government bonds as part of a smooth monetary policy transition from quantitative easing to tightening.
Previously, Bank of Japan Governor Kazuo Ueda confirmed the regulator’s intention to gradually reduce its substantial balance sheet in the future. However, the timing of this action remains uncertain.
USD/JPY Technical Analysis
Free Reports:
 Get our Weekly Commitment of Traders Reports - See where the biggest traders (Hedge Funds and Commercial Hedgers) are positioned in the futures markets on a weekly basis.
 Download Our Metatrader 4 Indicators – Put Our Free MetaTrader 4 Custom Indicators on your charts when you join our Weekly Newsletter
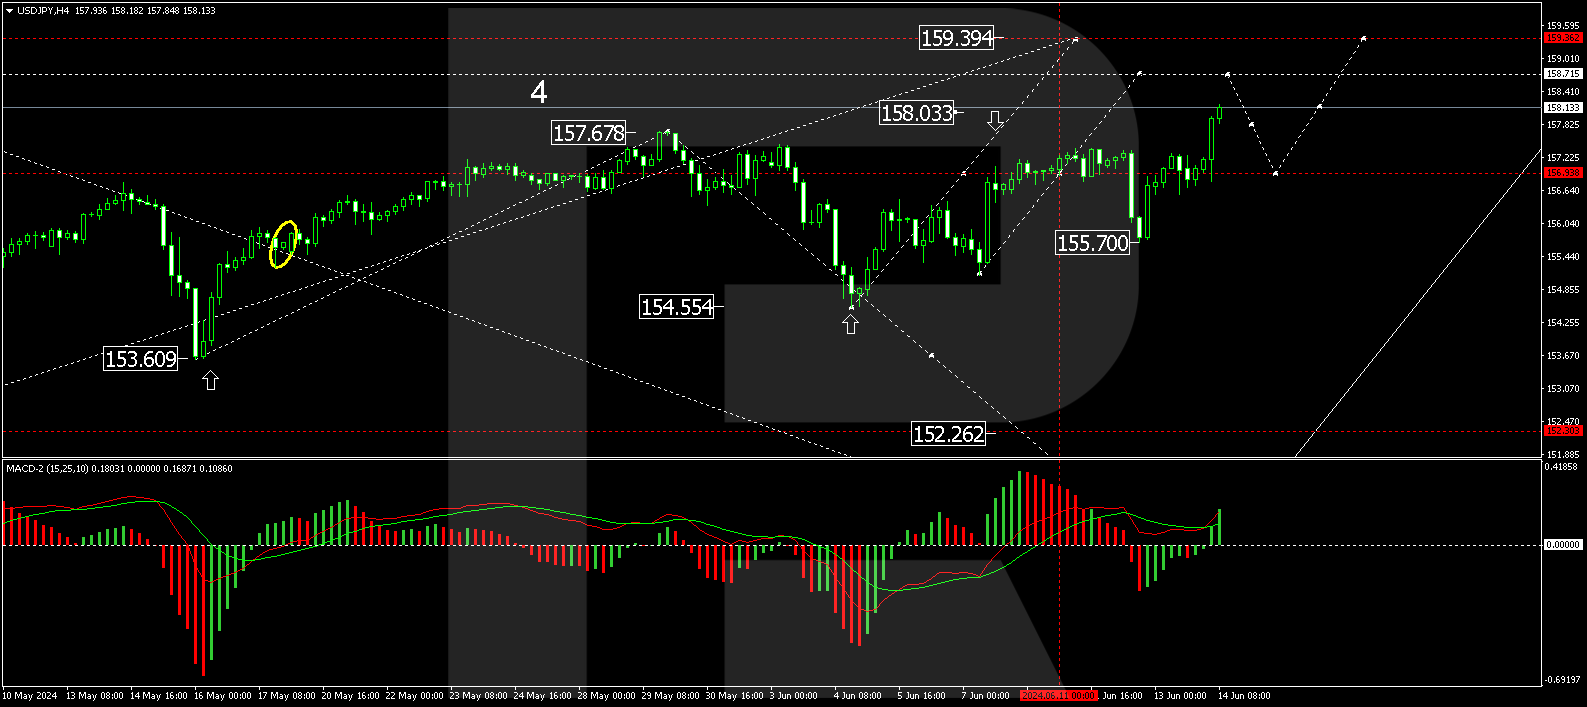
On the H4 USD/JPY chart, the market has breached 157.47 upwards and is continuing to develop a growth wave towards 158.74. After reaching this level, a correction down to the level of 157.47 is a possibility (test from above). We will then assess the probability of continuing the growth wave to 159.36. Technically, this scenario is supported by the MACD indicator, with its signal line above the zero level and pointing upwards.
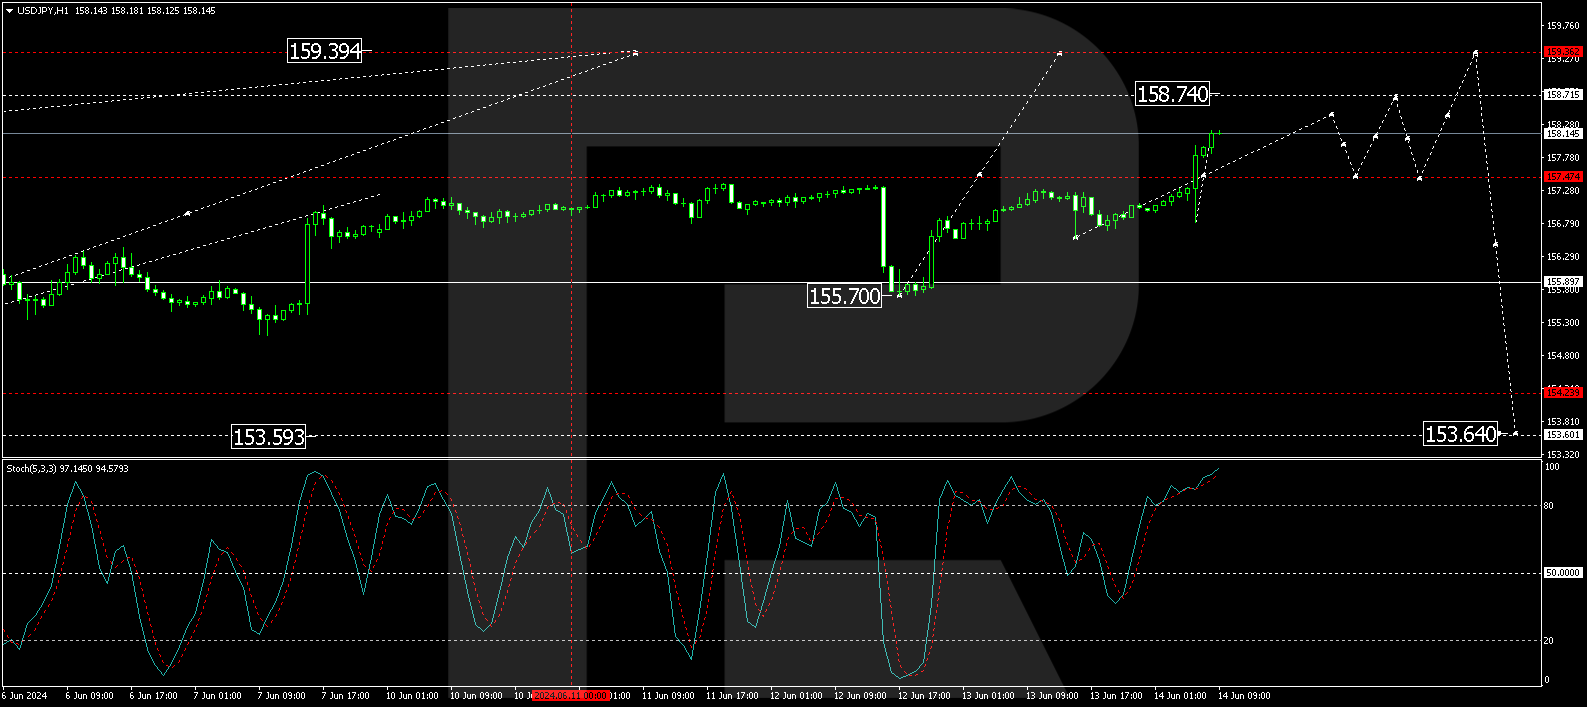
On the H1 USD/JPY chart, the market continues to develop a wave of growth to the level of 158.40. Further, a correction wave to 157.47 is possible, followed by growth to 158.74, the local target. Technically, this scenario is confirmed by the Stochastic oscillator, with its signal line above level 80 and preparing to decline to level 20.
Disclaimer
Any forecasts contained herein are based on the author’s particular opinion. This analysis may not be treated as trading advice. RoboForex bears no responsibility for trading results based on trading recommendations and reviews contained herein.

- The Central Bank of Mexico kept its interest rate unchanged. Iran plans to introduce strict bans for US and Israeli vessels in the Strait of Hormuz Aug 7, 2026
- USD/JPY Holds Firm: Yen Loses Some Support Aug 7, 2026
- Australian trade balance returned to positive territory Aug 6, 2026
- Results in Line for Most Reporting Companies Aug 5, 2026
- Stock indices continue to break records. Oil is falling amid intensified diplomatic dialogue between the US and Iran Aug 5, 2026
- USD/JPY Holds Steady After Intervention: Outlook Remains Uncertain Aug 5, 2026
- EUR/USD: Busy Week Ahead Aug 3, 2026
- Positive sentiment in the AI sector supported stock indices. Oil prices remain volatile Aug 3, 2026
- The Tech‑heavy NASDAQ Index jumped by more than 3.3%. The offshore yuan is trading at its highest level since 2023 Jul 31, 2026
- USD/JPY After Volatility: Multiple Events in One Day Jul 31, 2026
