By InvestMacro

Here are the latest charts and statistics for the Commitment of Traders (COT) reports data published by the Commodities Futures Trading Commission (CFTC).
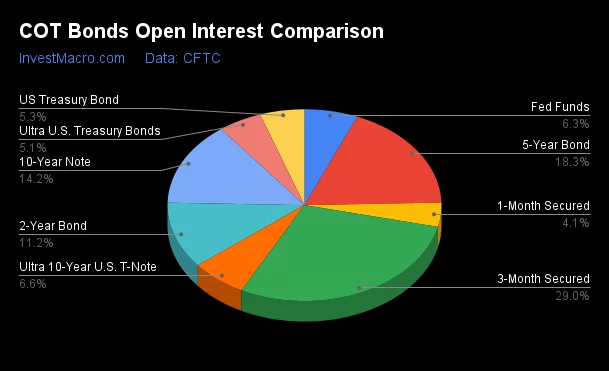
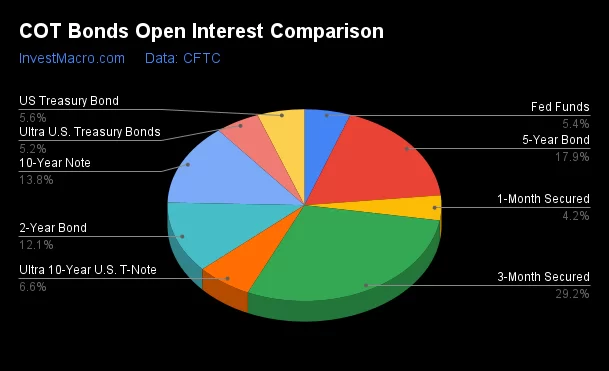
The latest COT data is updated through Tuesday April 1st and shows a quick view of how large traders (for-profit speculators and commercial hedgers) were positioned in the futures markets.
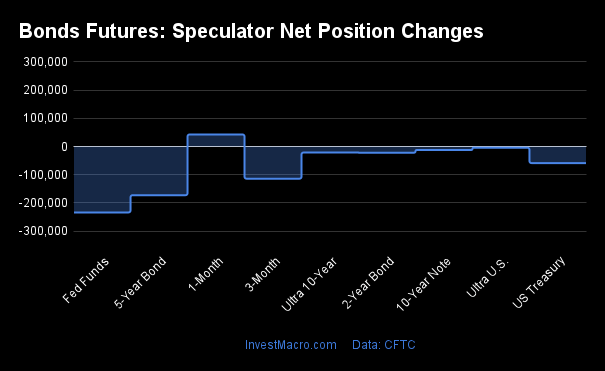
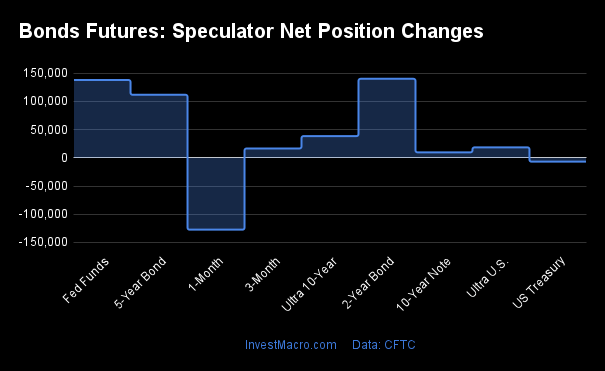
Weekly Speculator Changes led by SOFR 1-Month & US Treasury Bonds

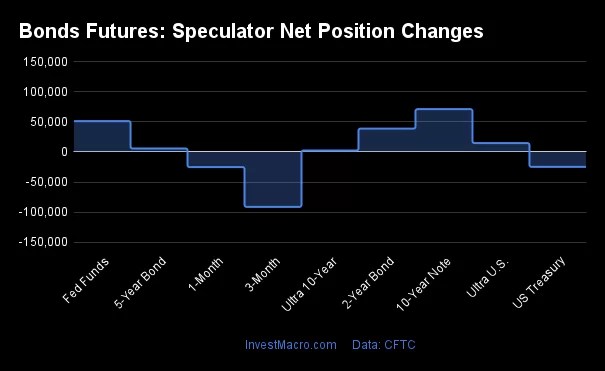
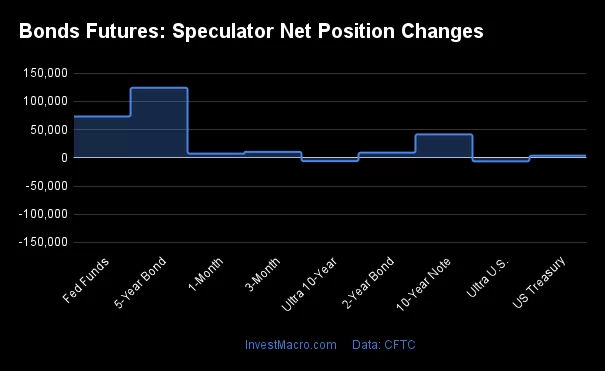
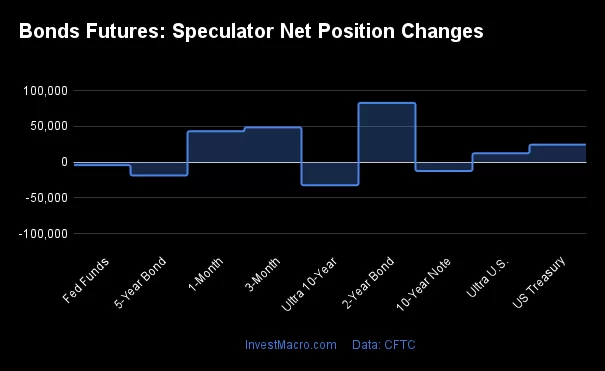
The COT bond market speculator bets were overall lower this week (through Tuesday) as just two out of the nine bond markets we cover had higher positioning while the other seven markets had lower speculator contracts.
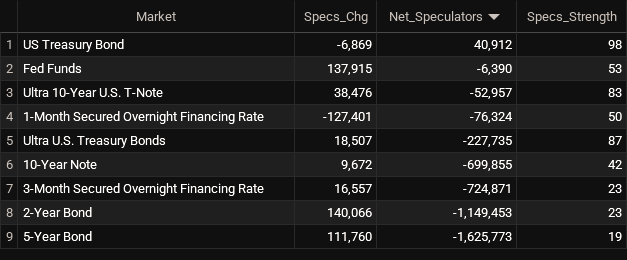
Leading the gains for the bond markets was the SOFR 1-Month (12,366 contracts) with the US Treasury Bonds (5,627 contracts) also showing a small positive week.
The bond markets with declines in speculator bets for the week were the 5-Year Bonds (-121,590 contracts), the SOFR 3-Months (-92,060 contracts), the 10-Year Bonds (-53,173 contracts), the 2-Year Bonds (-44,805 contracts), the Fed Funds (-35,833 contracts), the Ultra Treasury Bonds (-21,663 contracts) and the Ultra 10-Year Bonds (-21,496 contracts) also registering lower bets on the week.
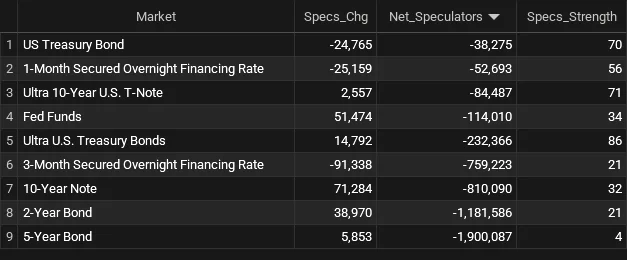
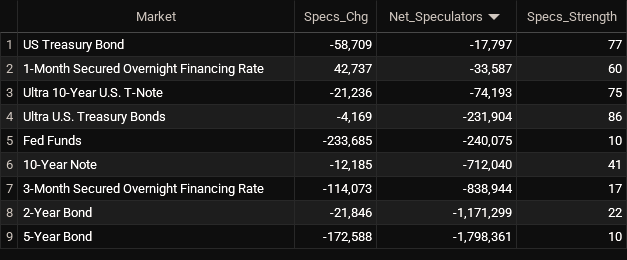
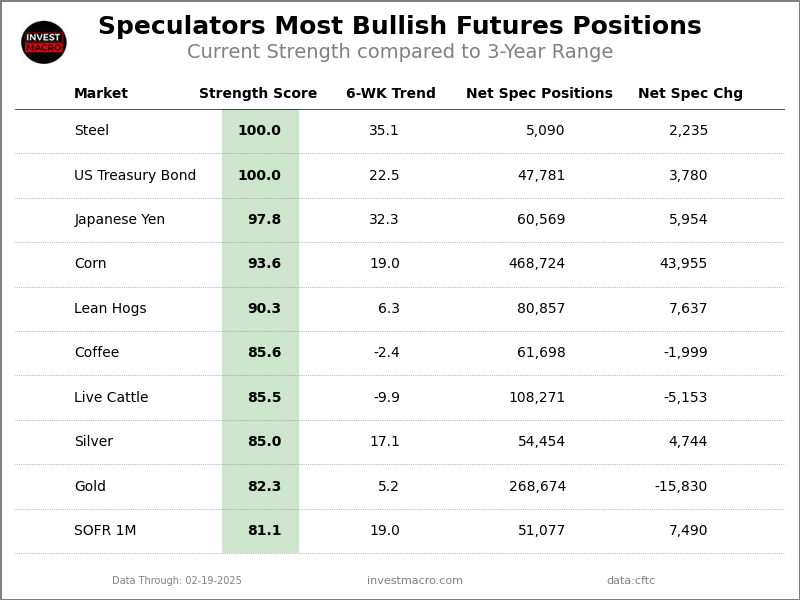
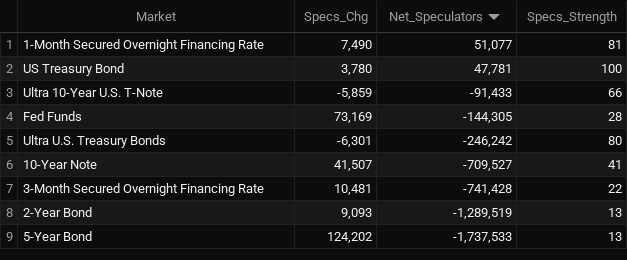
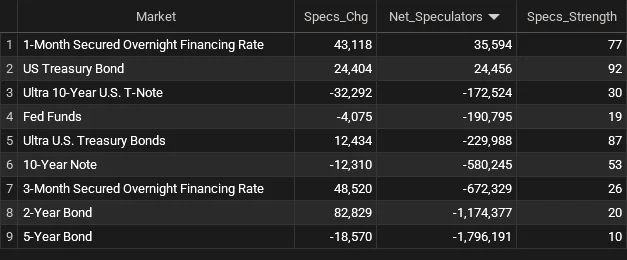
Bonds Net Speculators Leaderboard
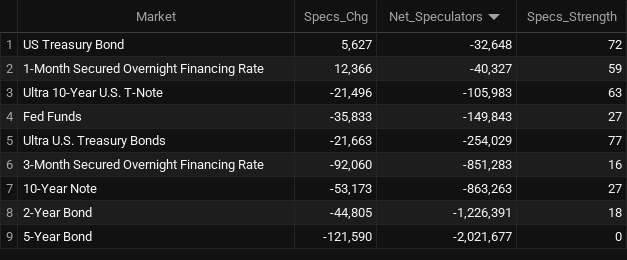
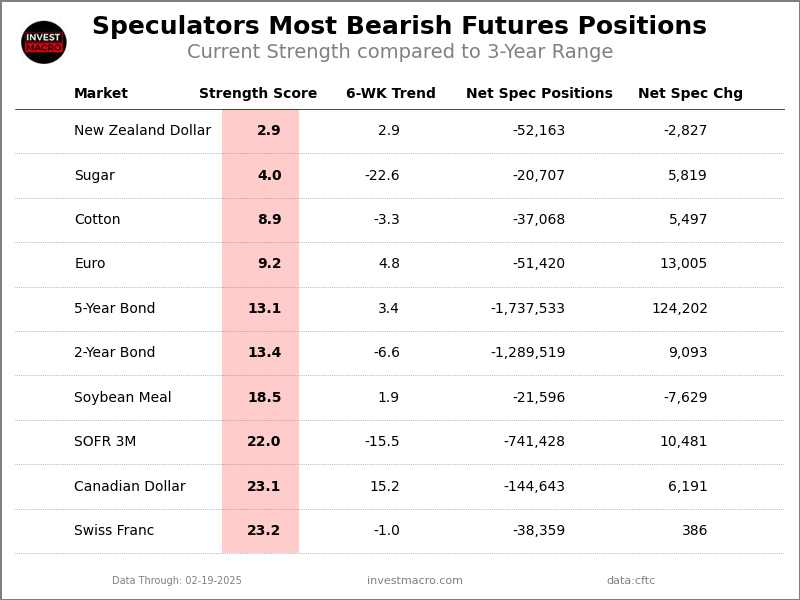
Legend: Weekly Speculators Change | Speculators Current Net Position | Speculators Strength Score compared to last 3-Years (0-100 range)
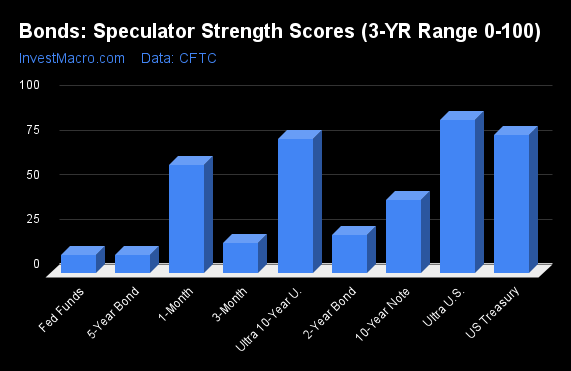
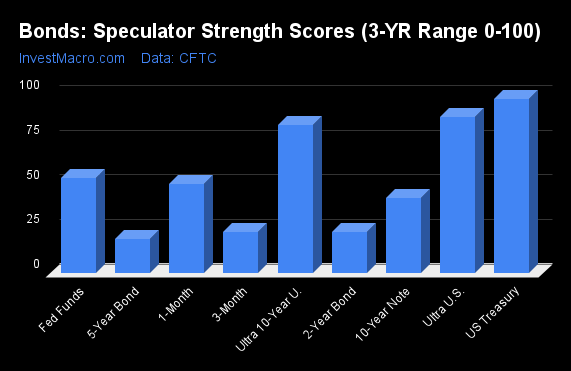
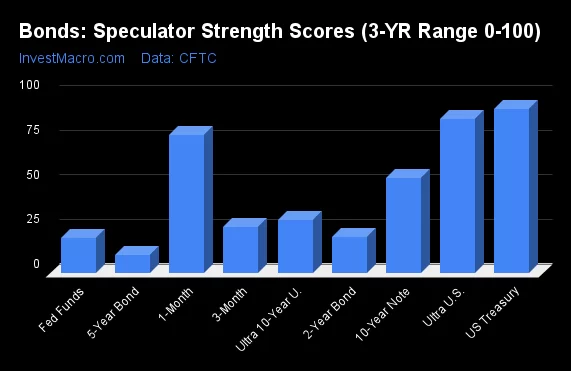
Strength Scores led by Ultra Treasury Bonds & US Treasury Bonds
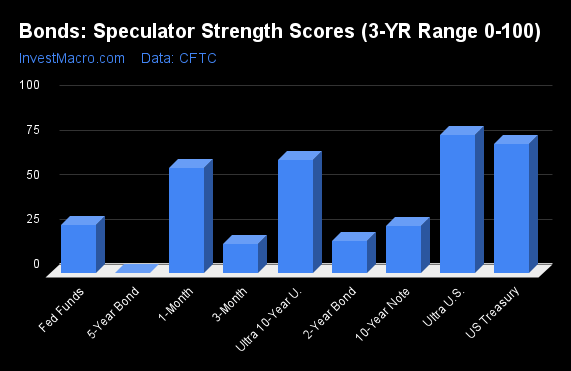
COT Strength Scores (a normalized measure of Speculator positions over a 3-Year range, from 0 to 100 where above 80 is Extreme-Bullish and below 20 is Extreme-Bearish) showed that the Ultra Treasury Bonds (77 percent) and the US Treasury Bonds (72 percent) lead the bond markets this week. The Ultra 10-Year Bonds (63 percent) comes in as the next highest in the weekly strength scores.
On the downside, the 5-Year Bond (0.0 percent), the SOFR 3-Months (16 percent) and the 2-Year Bonds (18 percent) come in at the lowest strength level currently and are in Extreme-Bearish territory (below 20 percent).
Strength Statistics:
Fed Funds (26.9 percent) vs Fed Funds previous week (33.6 percent)
2-Year Bond (17.9 percent) vs 2-Year Bond previous week (21.0 percent)
5-Year Bond (0.0 percent) vs 5-Year Bond previous week (6.3 percent)
10-Year Bond (26.5 percent) vs 10-Year Bond previous week (31.6 percent)
Ultra 10-Year Bond (63.4 percent) vs Ultra 10-Year Bond previous week (71.4 percent)
US Treasury Bond (72.0 percent) vs US Treasury Bond previous week (70.1 percent)
Ultra US Treasury Bond (77.3 percent) vs Ultra US Treasury Bond previous week (85.6 percent)
SOFR 1-Month (58.6 percent) vs SOFR 1-Month previous week (55.5 percent)
SOFR 3-Months (16.3 percent) vs SOFR 3-Months previous week (21.0 percent)
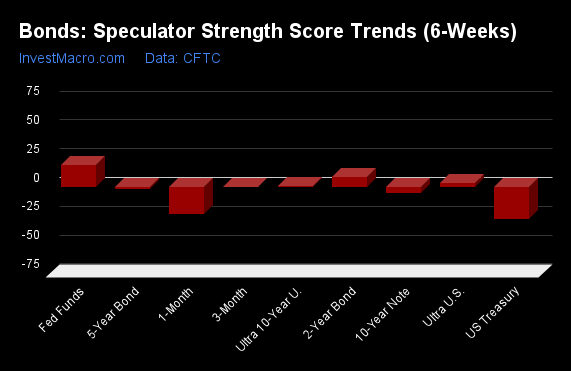
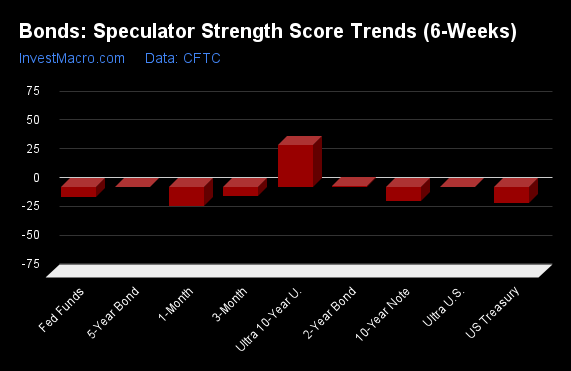
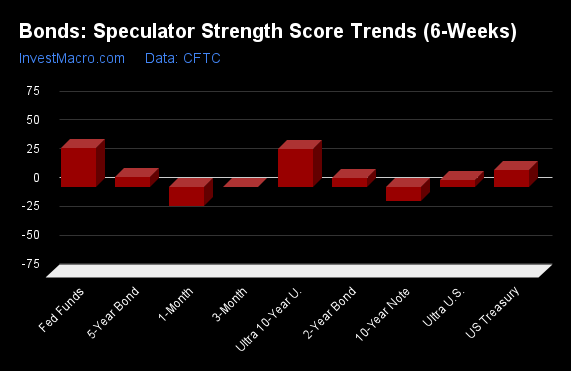
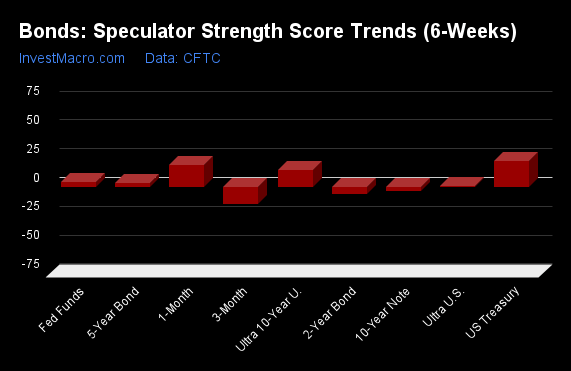
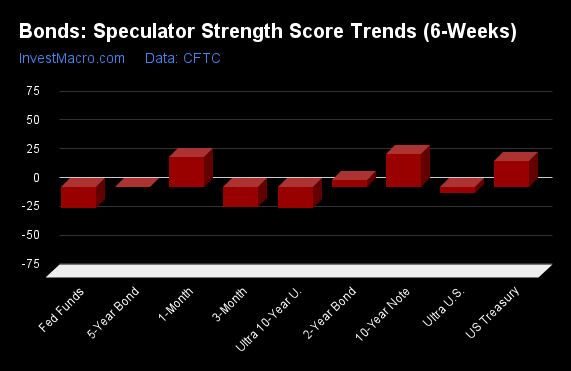
2-Year Bonds & Fed Funds top the 6-Week Strength Trends
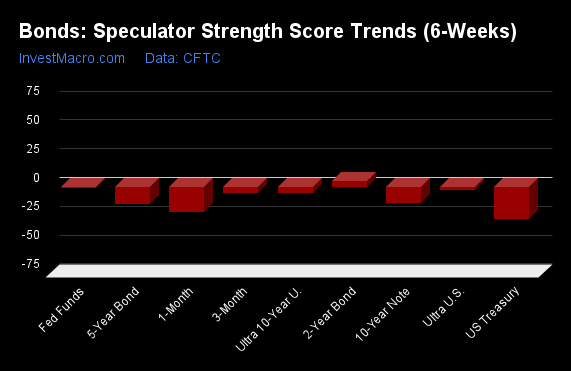
COT Strength Score Trends (or move index, calculates the 6-week changes in strength scores) showed that the 2-Year Bonds (4 percent) lead the past six weeks trends for bonds and are the only market with a positive score at the moment.
The US Treasury Bonds (-28 percent), the SOFR 1-Month (-23 percent), the 5-Year Bonds (-15 percent) and the 10-Year Bonds (-15 percent) lead the downside trend scores currently.
Strength Trend Statistics:
Fed Funds (-1.0 percent) vs Fed Funds previous week (19.1 percent)
2-Year Bond (4.4 percent) vs 2-Year Bond previous week (8.1 percent)
5-Year Bond (-14.8 percent) vs 5-Year Bond previous week (-2.0 percent)
10-Year Bond (-14.5 percent) vs 10-Year Bond previous week (-5.6 percent)
Ultra 10-Year Bond (-5.4 percent) vs Ultra 10-Year Bond previous week (0.4 percent)
US Treasury Bond (-28.0 percent) vs US Treasury Bond previous week (-28.6 percent)
Ultra US Treasury Bond (-3.0 percent) vs Ultra US Treasury Bond previous week (2.9 percent)
SOFR 1-Month (-22.5 percent) vs SOFR 1-Month previous week (-23.7 percent)
SOFR 3-Months (-5.7 percent) vs SOFR 3-Months previous week (-0.4 percent)
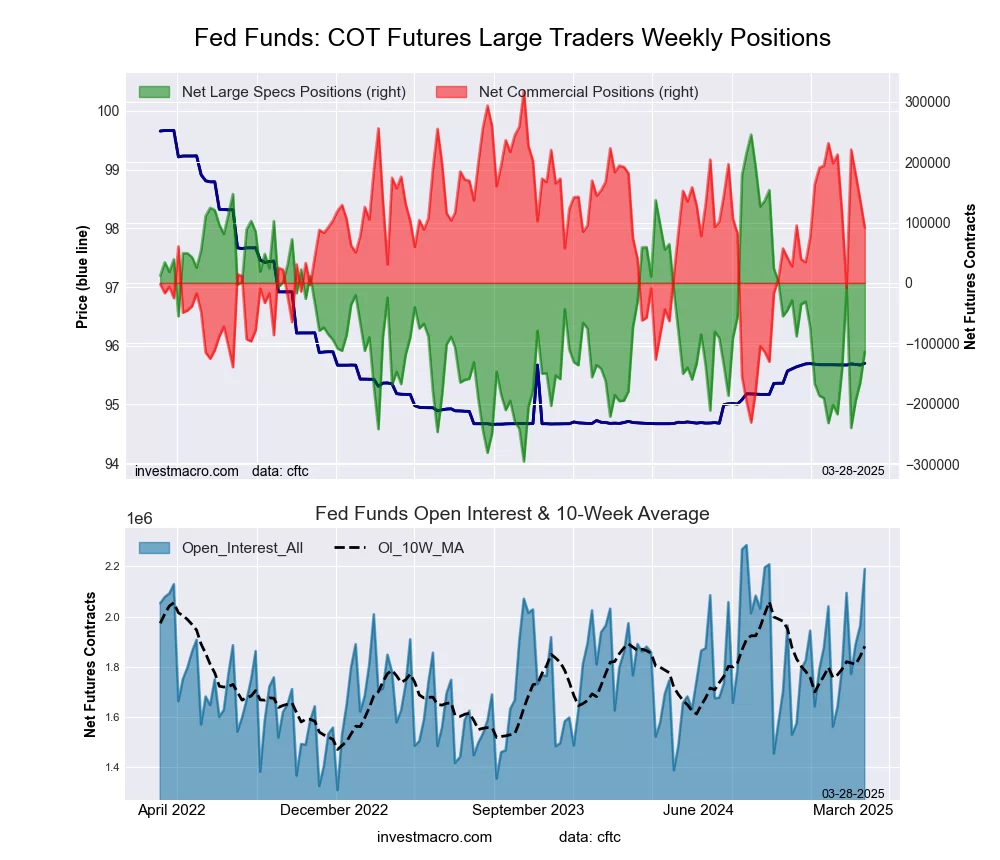
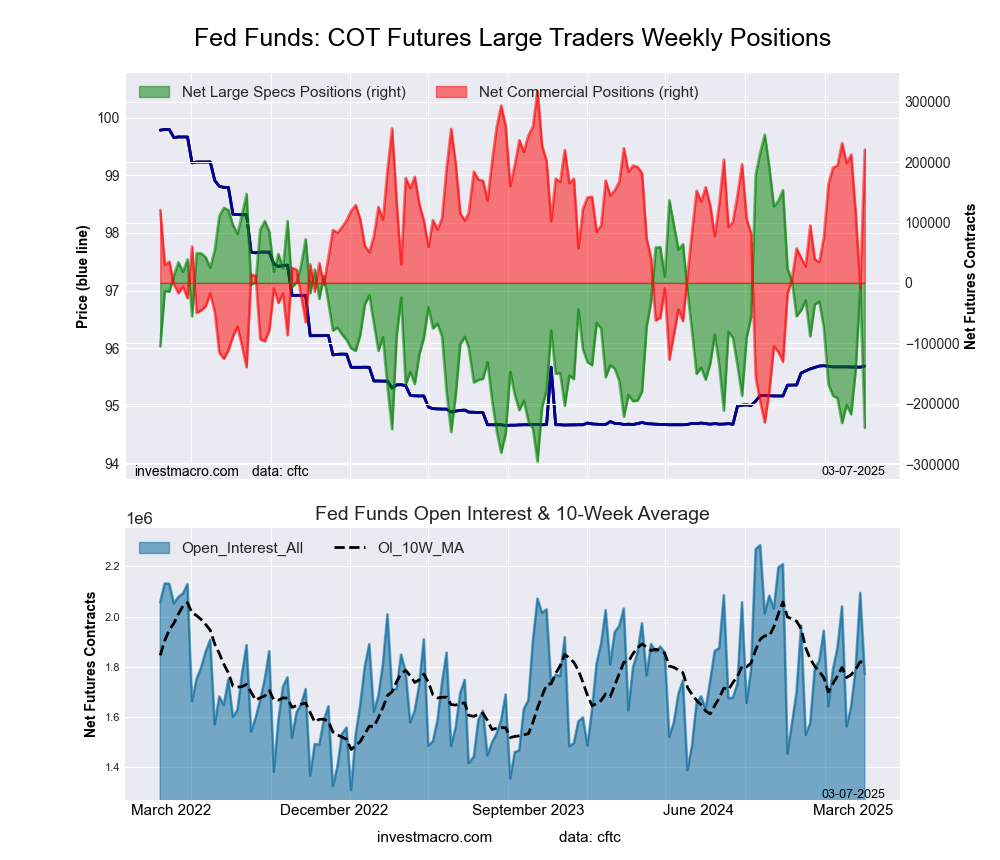
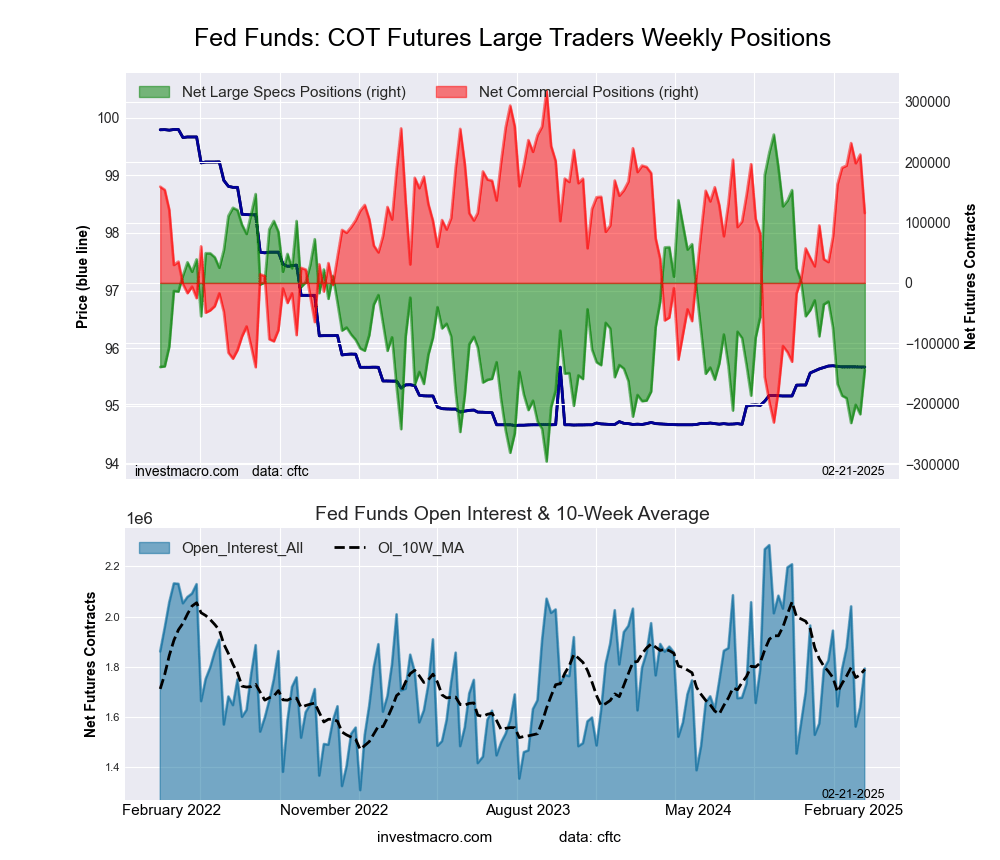
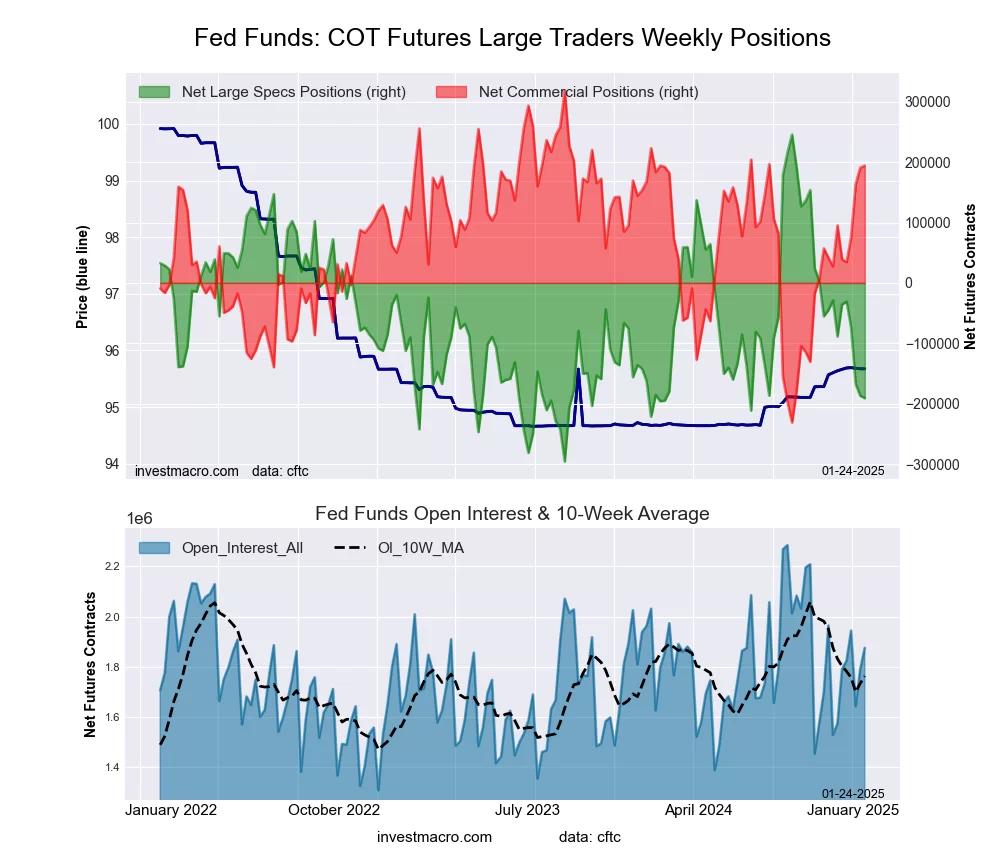
30-Day Federal Funds Futures:
 The 30-Day Federal Funds large speculator standing this week totaled a net position of -149,843 contracts in the data reported through Tuesday. This was a weekly fall of -35,833 contracts from the previous week which had a total of -114,010 net contracts.
This week’s current strength score (the trader positioning range over the past three years, measured from 0 to 100) shows the speculators are currently Bearish with a score of 26.9 percent. The commercials are Bullish with a score of 66.1 percent and the small traders (not shown in chart) are Bullish-Extreme with a score of 85.2 percent.
Price Trend-Following Model: Downtrend
Our weekly trend-following model classifies the current market price position as: Downtrend.
| 30-Day Federal Funds Statistics | SPECULATORS | COMMERCIALS | SMALL TRADERS |
| – Percent of Open Interest Longs: | 22.8 | 58.6 | 2.5 |
| – Percent of Open Interest Shorts: | 30.2 | 52.0 | 1.7 |
| – Net Position: | -149,843 | 132,305 | 17,538 |
| – Gross Longs: | 459,912 | 1,184,076 | 50,922 |
| – Gross Shorts: | 609,755 | 1,051,771 | 33,384 |
| – Long to Short Ratio: | 0.8 to 1 | 1.1 to 1 | 1.5 to 1 |
| NET POSITION TREND: | |||
| – Strength Index Score (3 Year Range Pct): | 26.9 | 66.1 | 85.2 |
| – Strength Index Reading (3 Year Range): | Bearish | Bullish | Bullish-Extreme |
| NET POSITION MOVEMENT INDEX: | |||
| – 6-Week Change in Strength Index: | -1.0 | 3.0 | -14.8 |
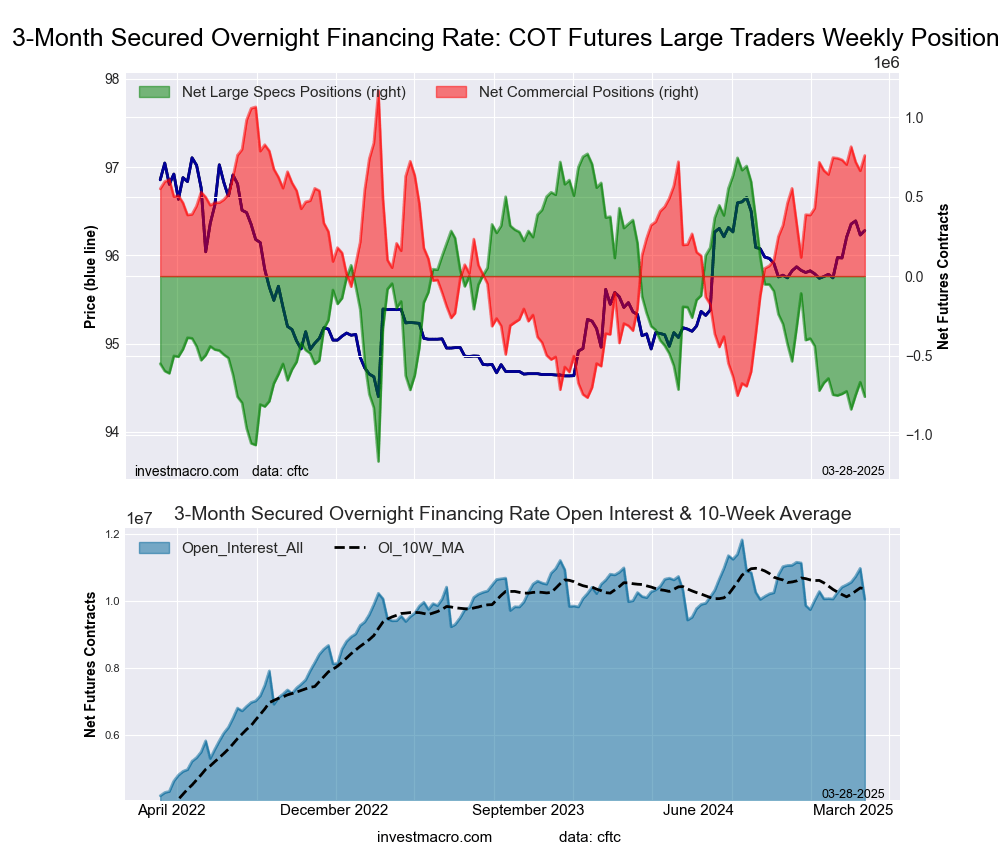
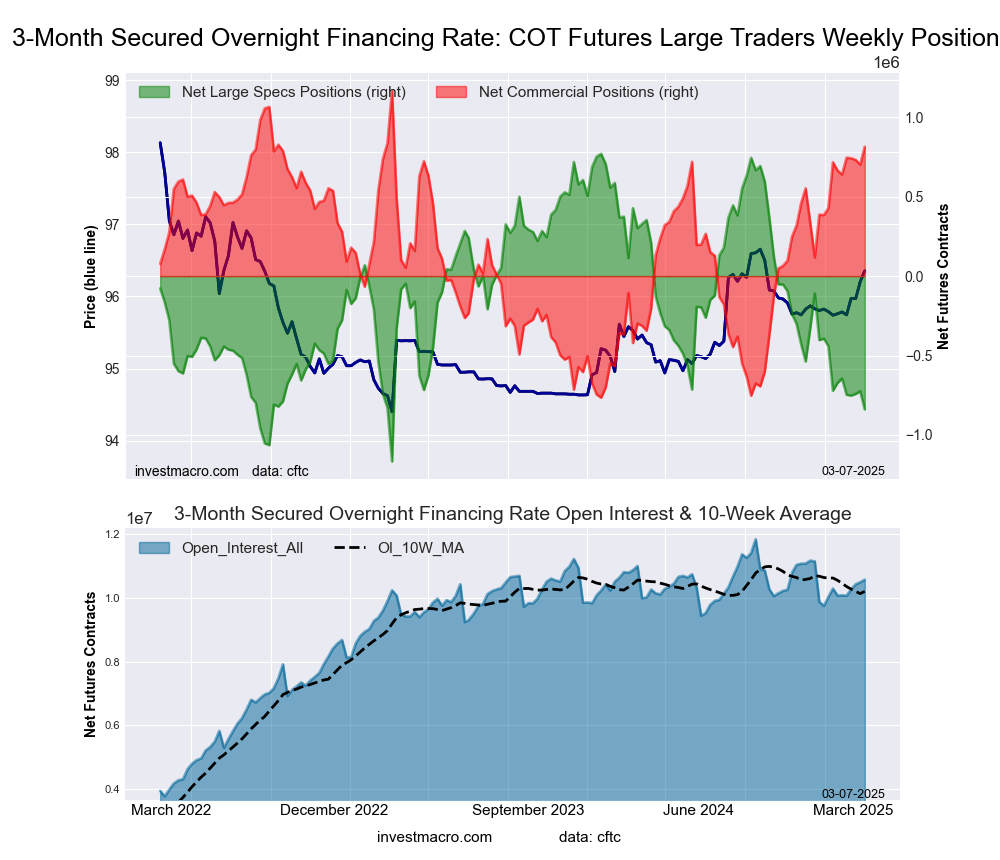
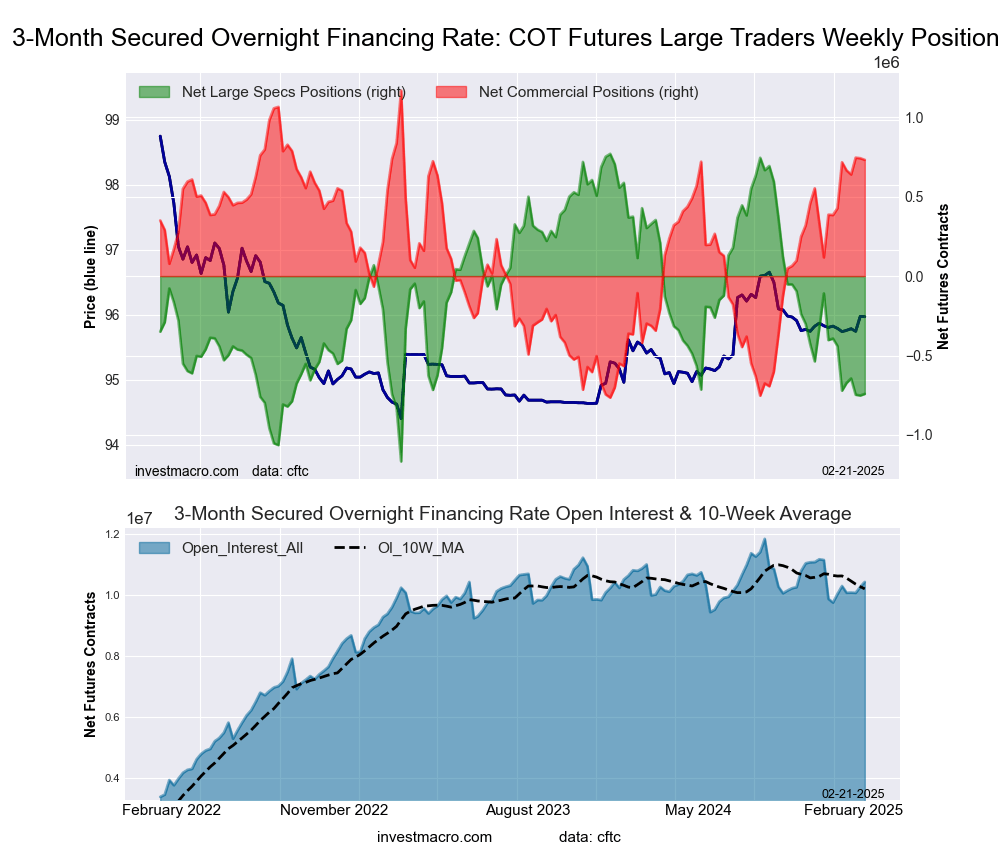
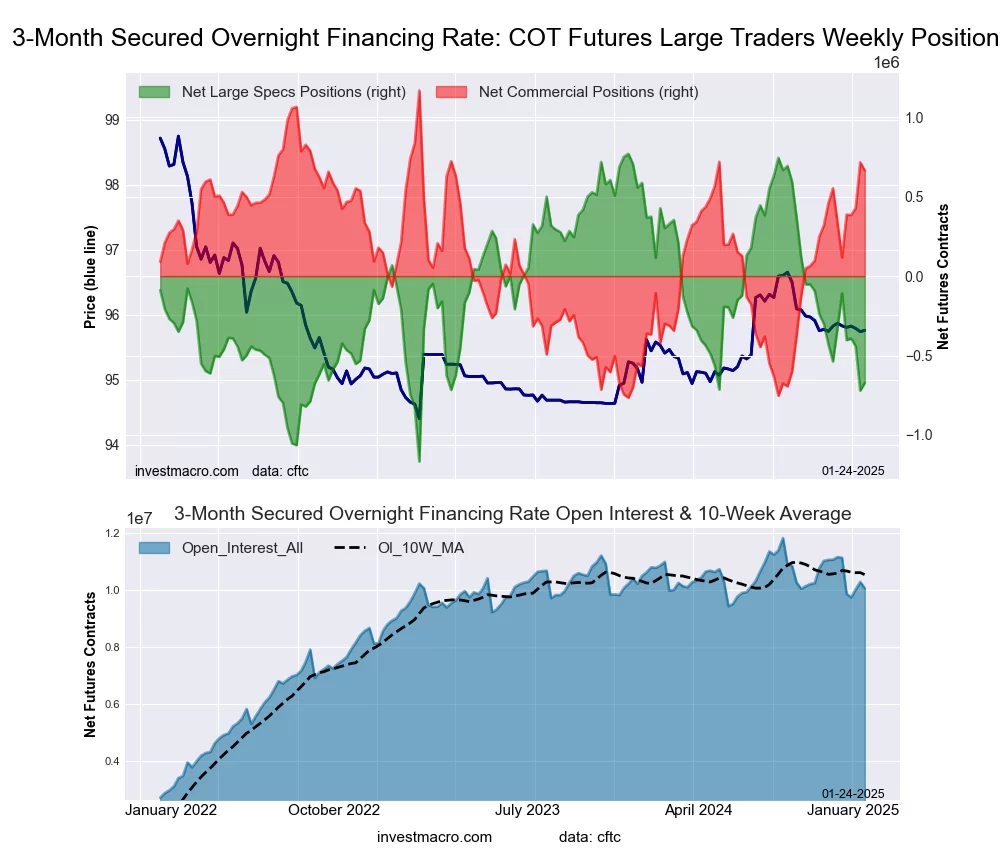
Secured Overnight Financing Rate (3-Month) Futures:
 The Secured Overnight Financing Rate (3-Month) large speculator standing this week totaled a net position of -851,283 contracts in the data reported through Tuesday. This was a weekly decrease of -92,060 contracts from the previous week which had a total of -759,223 net contracts.
This week’s current strength score (the trader positioning range over the past three years, measured from 0 to 100) shows the speculators are currently Bearish-Extreme with a score of 16.3 percent. The commercials are Bullish-Extreme with a score of 83.5 percent and the small traders (not shown in chart) are Bullish-Extreme with a score of 85.4 percent.
Price Trend-Following Model: Weak Uptrend
Our weekly trend-following model classifies the current market price position as: Weak Uptrend.
| SOFR 3-Months Statistics | SPECULATORS | COMMERCIALS | SMALL TRADERS |
| – Percent of Open Interest Longs: | 12.3 | 60.2 | 0.2 |
| – Percent of Open Interest Shorts: | 20.7 | 51.9 | 0.2 |
| – Net Position: | -851,283 | 848,216 | 3,067 |
| – Gross Longs: | 1,242,687 | 6,104,420 | 21,116 |
| – Gross Shorts: | 2,093,970 | 5,256,204 | 18,049 |
| – Long to Short Ratio: | 0.6 to 1 | 1.2 to 1 | 1.2 to 1 |
| NET POSITION TREND: | |||
| – Strength Index Score (3 Year Range Pct): | 16.3 | 83.5 | 85.4 |
| – Strength Index Reading (3 Year Range): | Bearish-Extreme | Bullish-Extreme | Bullish-Extreme |
| NET POSITION MOVEMENT INDEX: | |||
| – 6-Week Change in Strength Index: | -5.7 | 6.0 | -3.6 |
Individual Bond Markets:
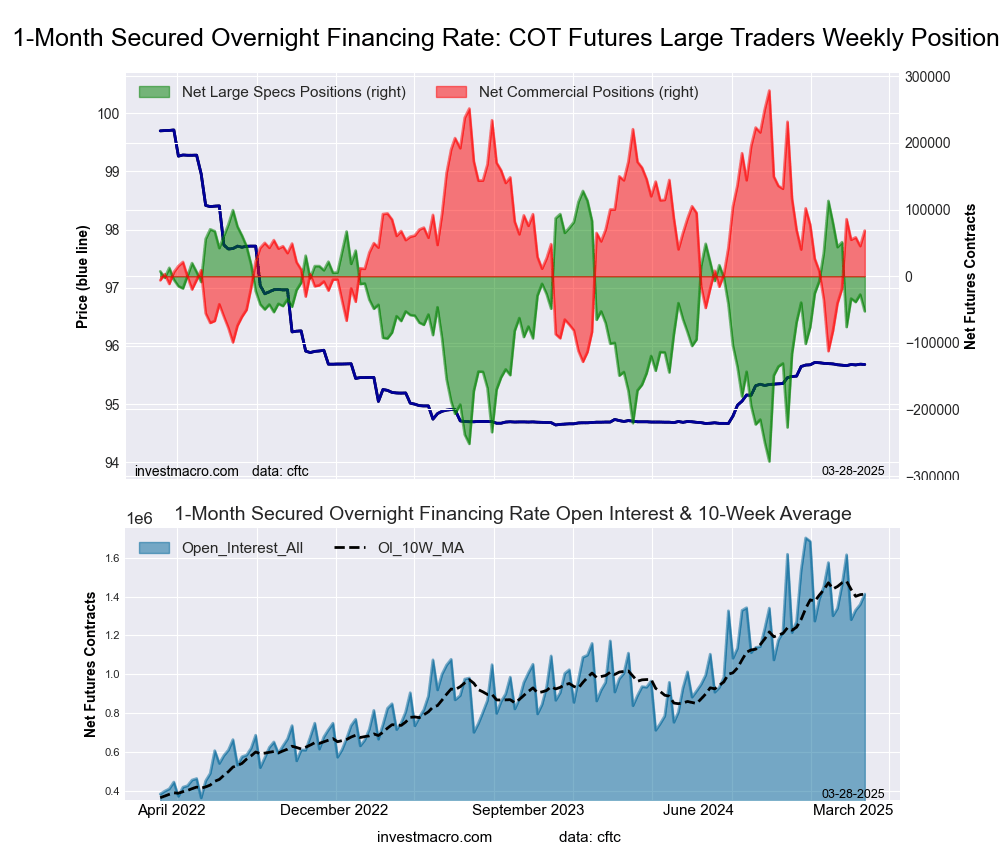
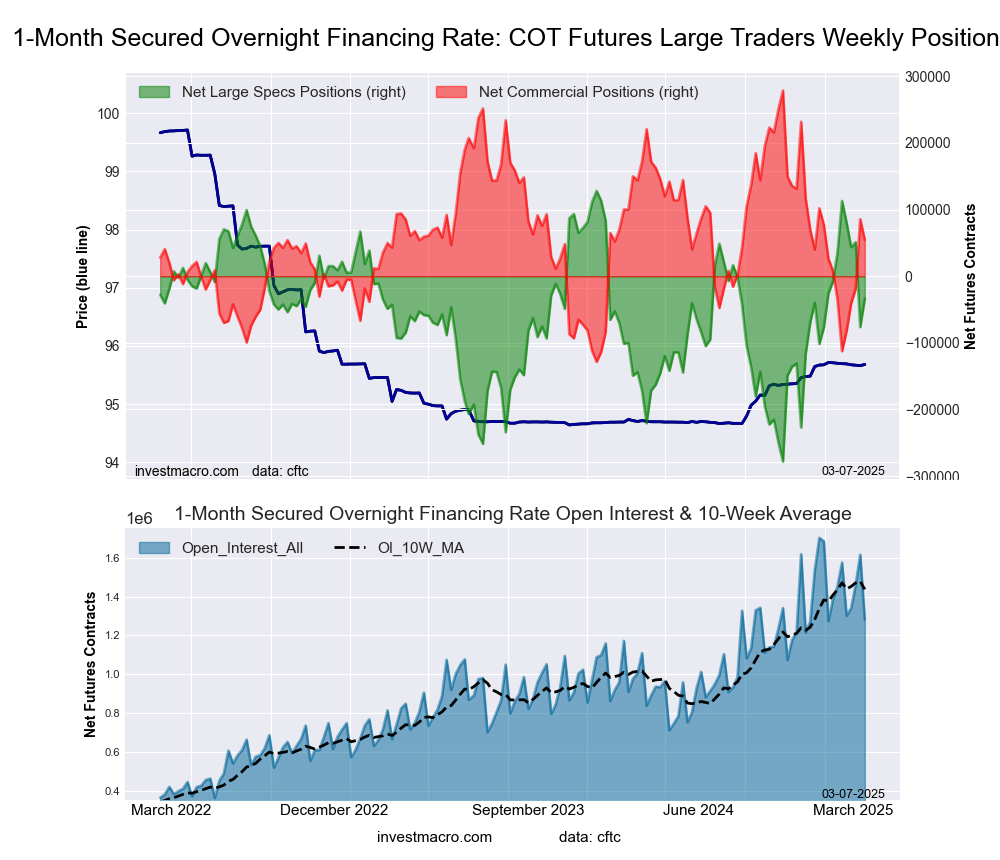
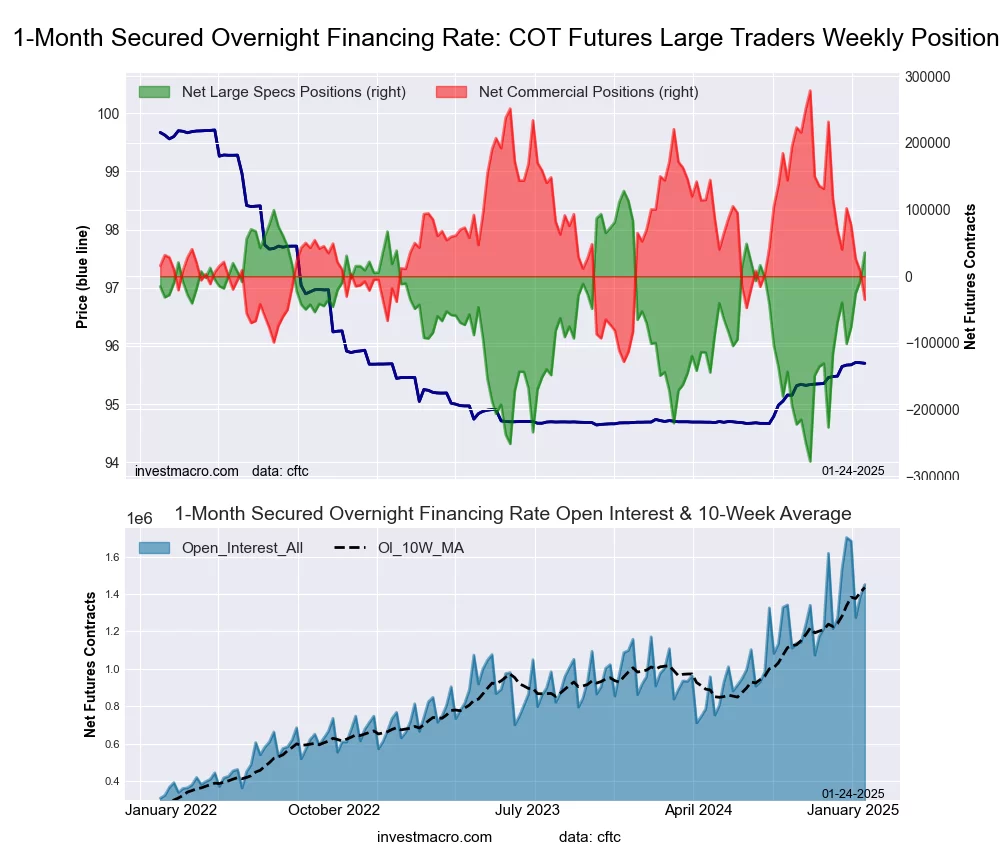
Secured Overnight Financing Rate (1-Month) Futures:
 The Secured Overnight Financing Rate (1-Month) large speculator standing this week totaled a net position of -40,327 contracts in the data reported through Tuesday. This was a weekly advance of 12,366 contracts from the previous week which had a total of -52,693 net contracts.
This week’s current strength score (the trader positioning range over the past three years, measured from 0 to 100) shows the speculators are currently Bullish with a score of 58.6 percent. The commercials are Bearish with a score of 43.6 percent and the small traders (not shown in chart) are Bullish with a score of 62.2 percent.
Price Trend-Following Model: Uptrend
Our weekly trend-following model classifies the current market price position as: Uptrend.
| SOFR 1-Month Statistics | SPECULATORS | COMMERCIALS | SMALL TRADERS |
| – Percent of Open Interest Longs: | 32.8 | 54.2 | 0.0 |
| – Percent of Open Interest Shorts: | 36.1 | 50.2 | 0.8 |
| – Net Position: | -40,327 | 49,126 | -8,799 |
| – Gross Longs: | 401,686 | 664,780 | 500 |
| – Gross Shorts: | 442,013 | 615,654 | 9,299 |
| – Long to Short Ratio: | 0.9 to 1 | 1.1 to 1 | 0.1 to 1 |
| NET POSITION TREND: | |||
| – Strength Index Score (3 Year Range Pct): | 58.6 | 43.6 | 62.2 |
| – Strength Index Reading (3 Year Range): | Bullish | Bearish | Bullish |
| NET POSITION MOVEMENT INDEX: | |||
| – 6-Week Change in Strength Index: | -22.5 | 16.7 | 62.2 |
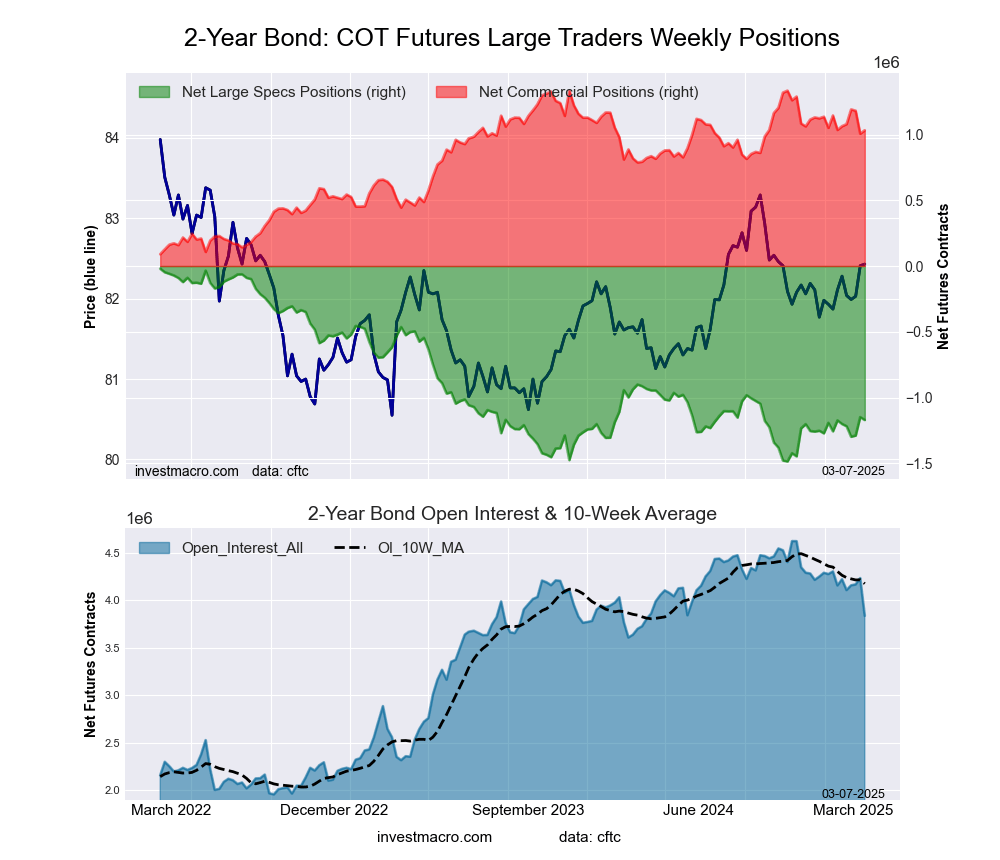
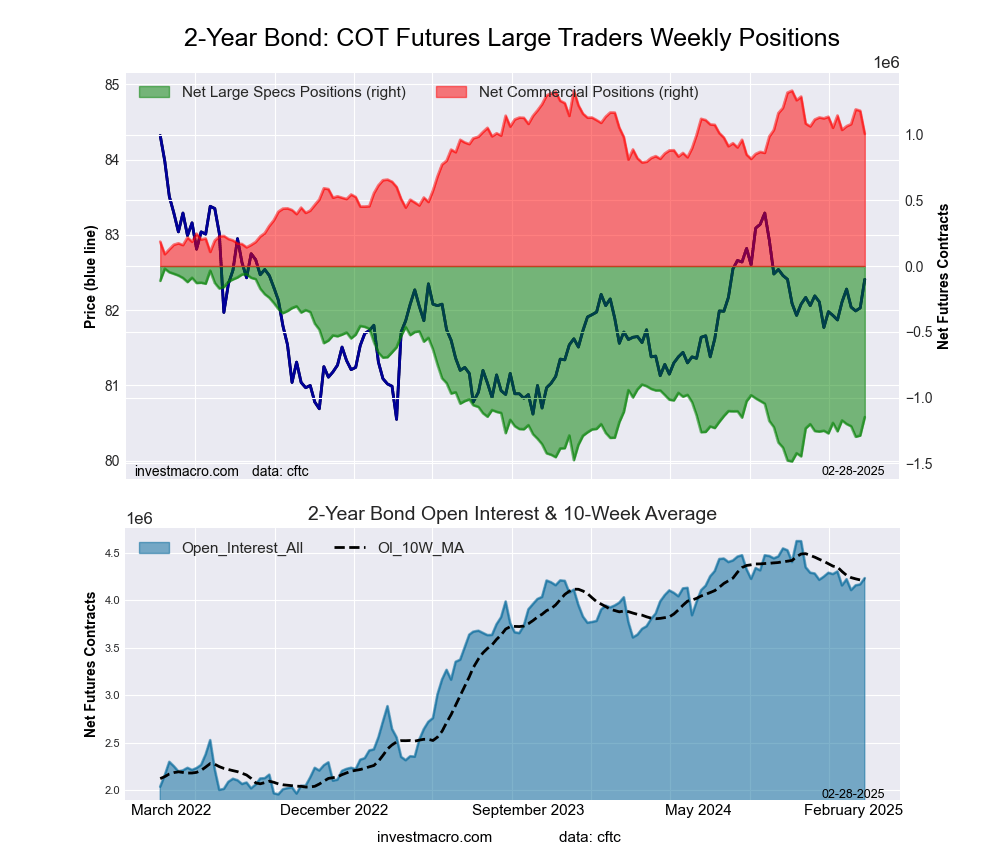
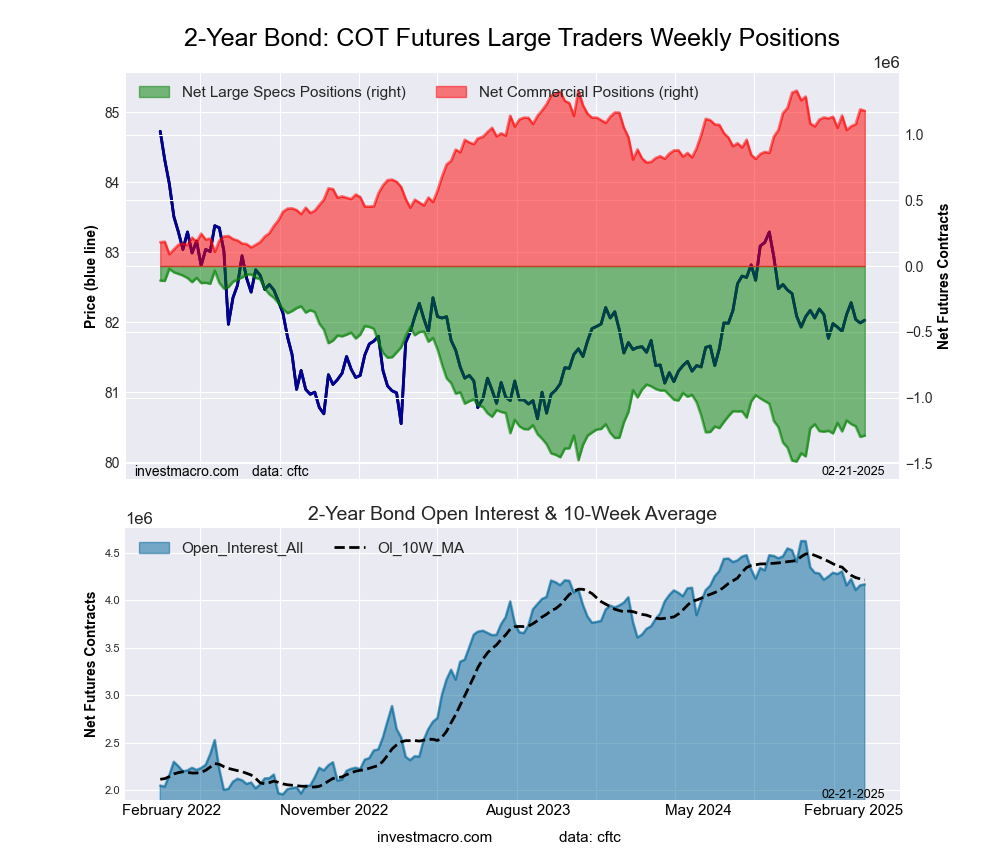
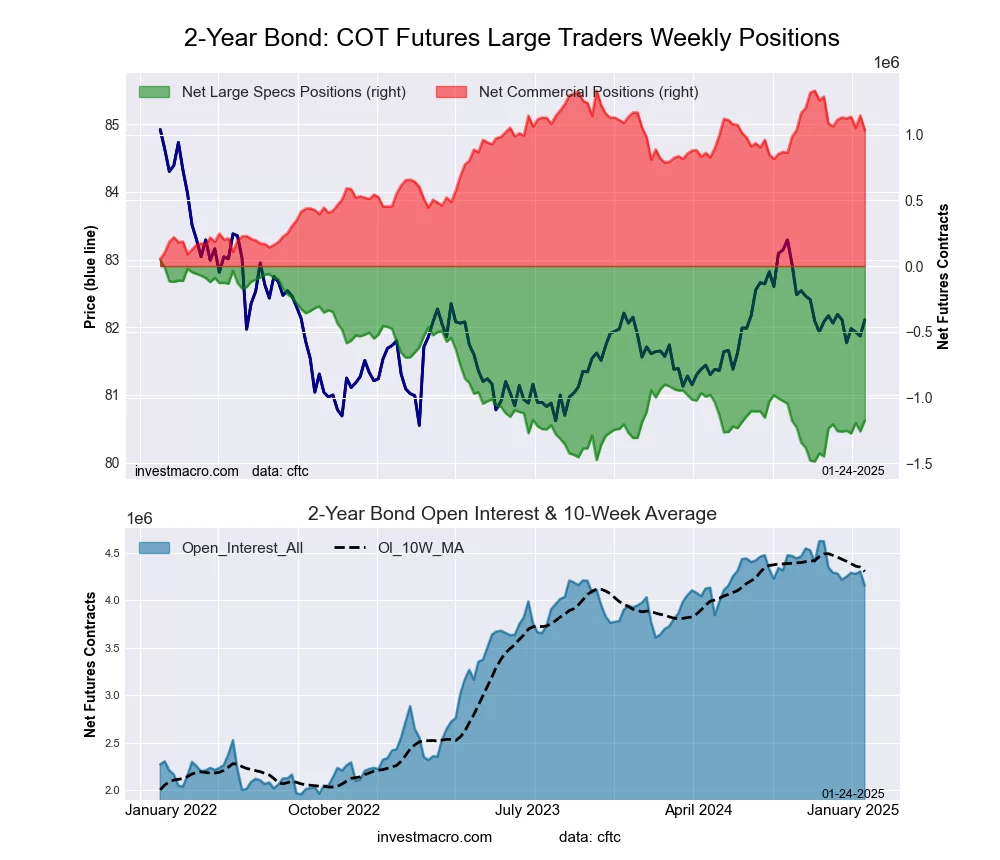
2-Year Treasury Note Futures:
 The 2-Year Treasury Note large speculator standing this week totaled a net position of -1,226,391 contracts in the data reported through Tuesday. This was a weekly fall of -44,805 contracts from the previous week which had a total of -1,181,586 net contracts.
This week’s current strength score (the trader positioning range over the past three years, measured from 0 to 100) shows the speculators are currently Bearish-Extreme with a score of 17.9 percent. The commercials are Bullish-Extreme with a score of 82.1 percent and the small traders (not shown in chart) are Bullish with a score of 71.4 percent.
Price Trend-Following Model: Strong Uptrend
Our weekly trend-following model classifies the current market price position as: Strong Uptrend.
| 2-Year Treasury Note Statistics | SPECULATORS | COMMERCIALS | SMALL TRADERS |
| – Percent of Open Interest Longs: | 13.9 | 76.8 | 5.8 |
| – Percent of Open Interest Shorts: | 45.2 | 48.4 | 3.0 |
| – Net Position: | -1,226,391 | 1,114,768 | 111,623 |
| – Gross Longs: | 544,094 | 3,010,463 | 228,193 |
| – Gross Shorts: | 1,770,485 | 1,895,695 | 116,570 |
| – Long to Short Ratio: | 0.3 to 1 | 1.6 to 1 | 2.0 to 1 |
| NET POSITION TREND: | |||
| – Strength Index Score (3 Year Range Pct): | 17.9 | 82.1 | 71.4 |
| – Strength Index Reading (3 Year Range): | Bearish-Extreme | Bullish-Extreme | Bullish |
| NET POSITION MOVEMENT INDEX: | |||
| – 6-Week Change in Strength Index: | 4.4 | -5.4 | 0.8 |
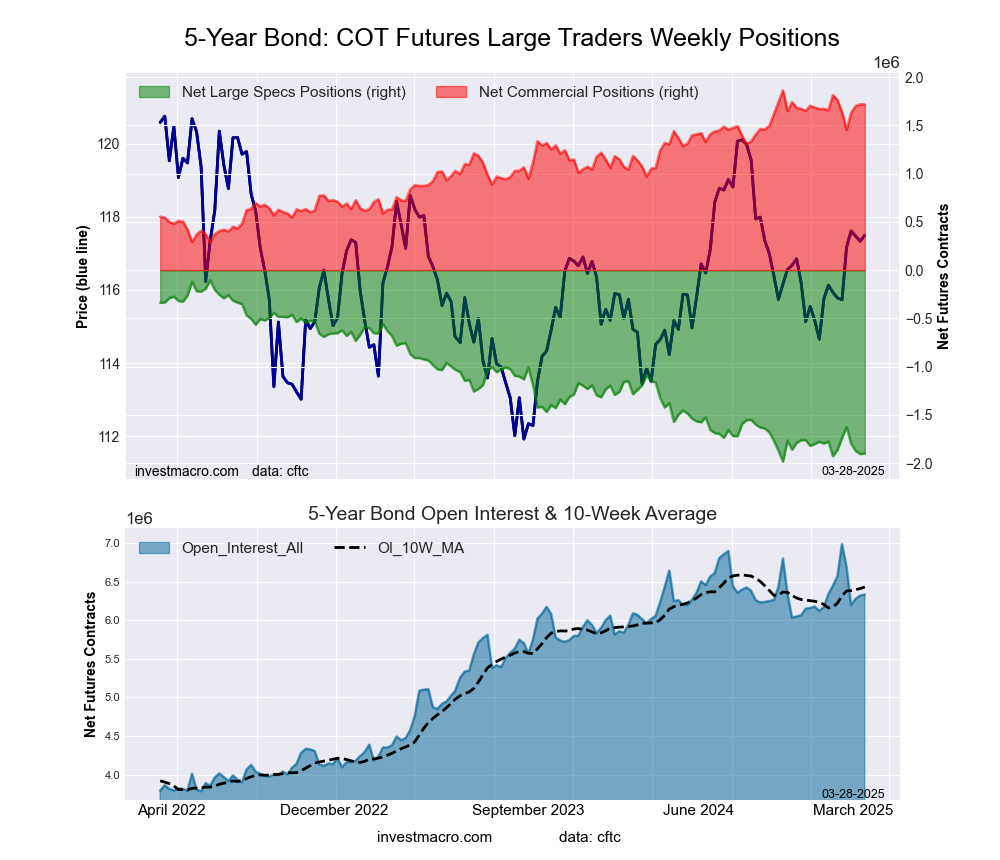
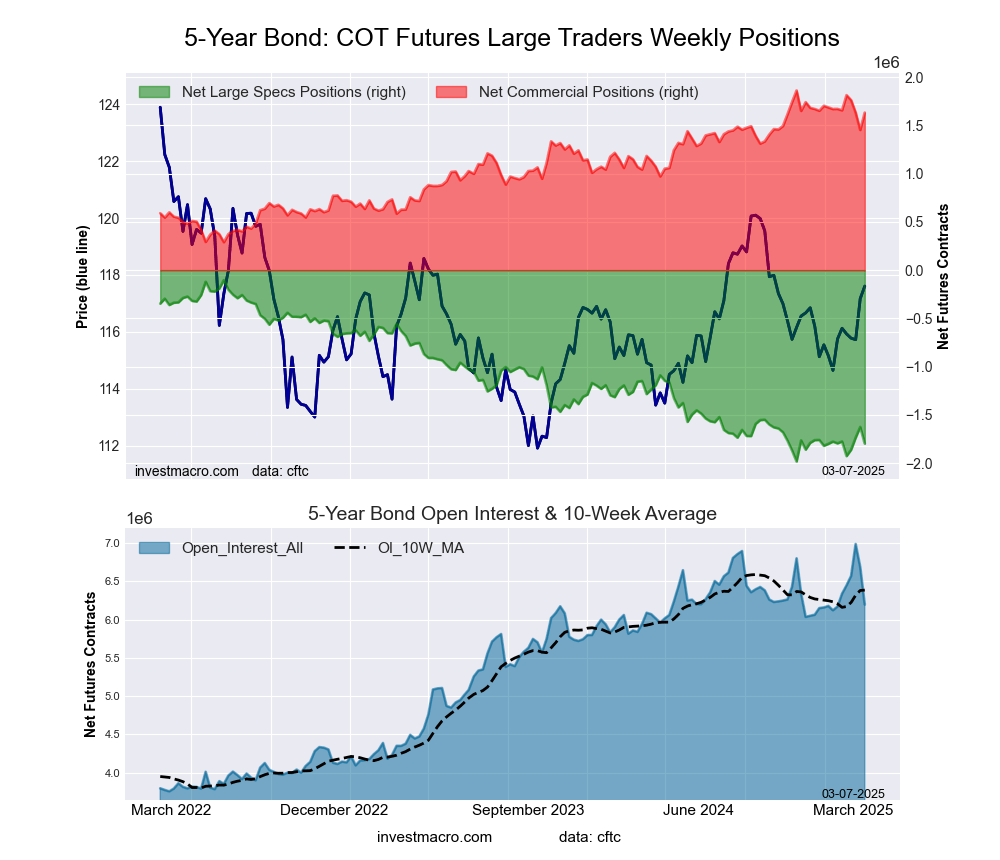
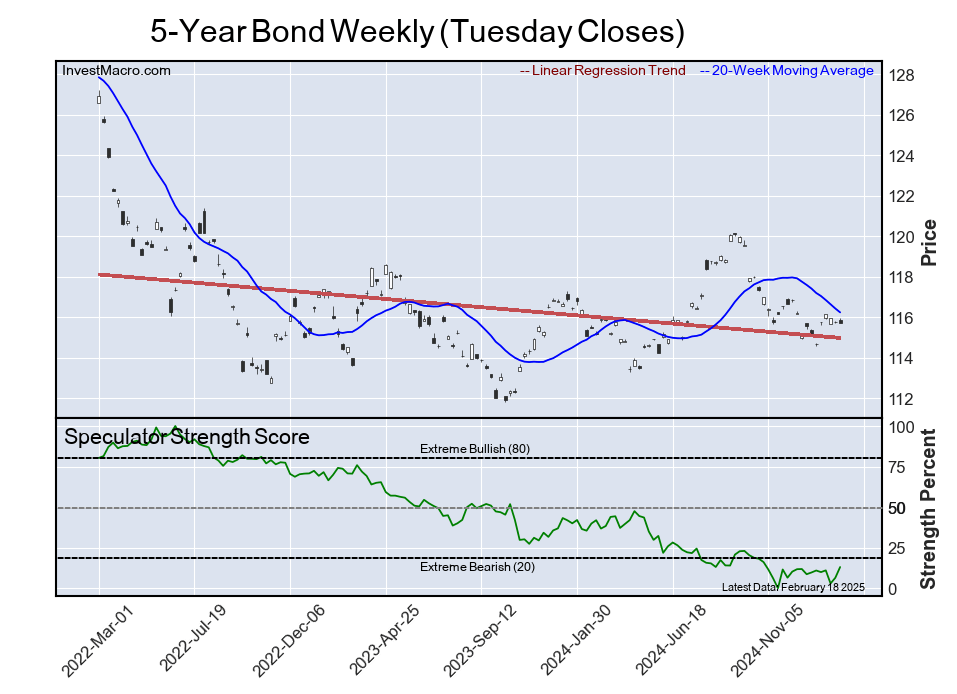
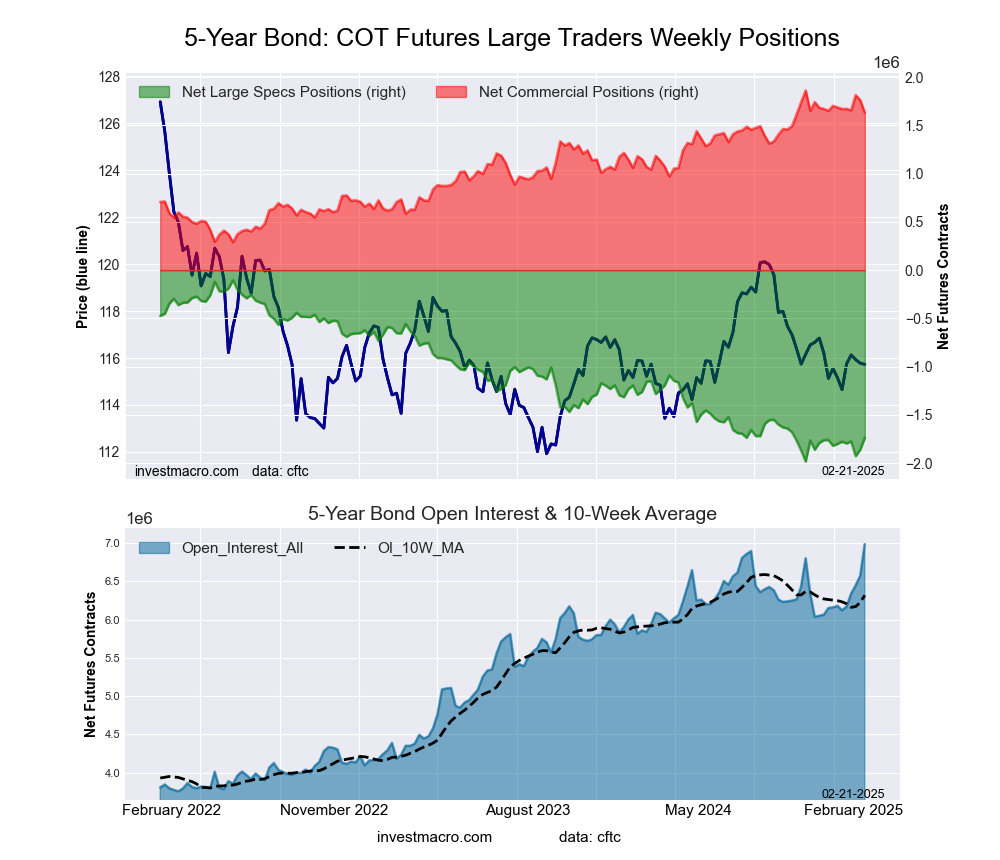
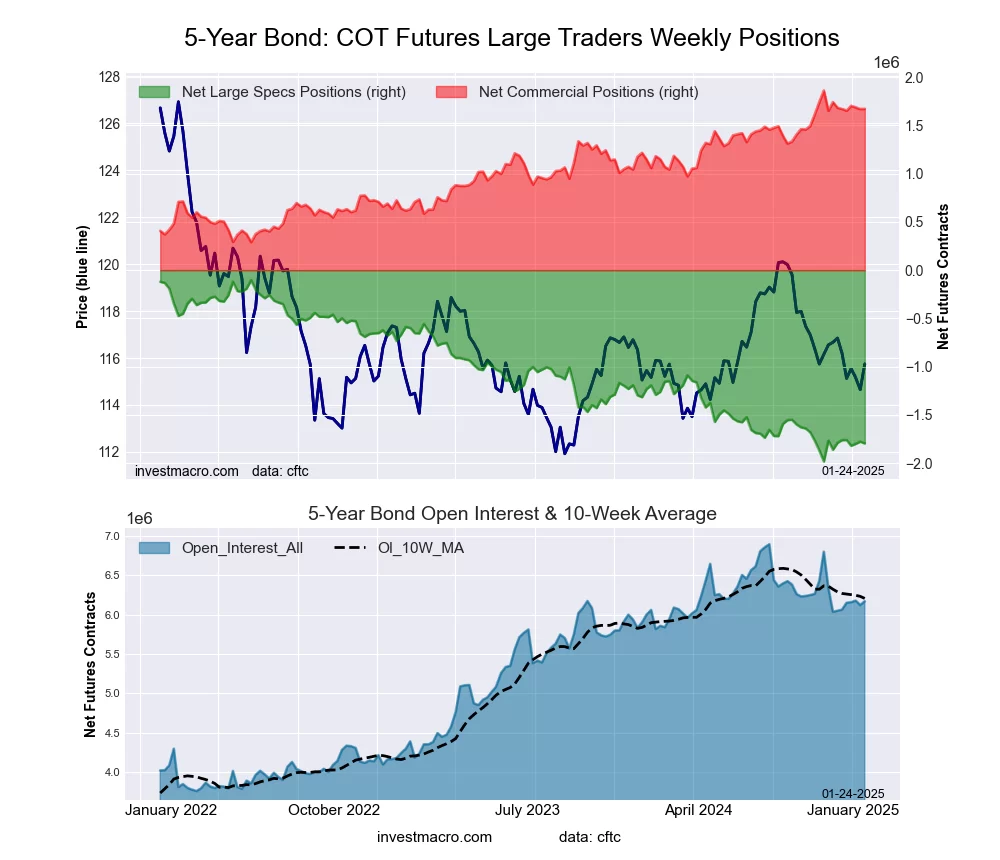
5-Year Treasury Note Futures:
 The 5-Year Treasury Note large speculator standing this week totaled a net position of -2,021,677 contracts in the data reported through Tuesday. This was a weekly fall of -121,590 contracts from the previous week which had a total of -1,900,087 net contracts.
This week’s current strength score (the trader positioning range over the past three years, measured from 0 to 100) shows the speculators are currently Bearish-Extreme with a score of 0.0 percent. The commercials are Bullish-Extreme with a score of 97.8 percent and the small traders (not shown in chart) are Bullish-Extreme with a score of 87.9 percent.
Price Trend-Following Model: Strong Uptrend
Our weekly trend-following model classifies the current market price position as: Strong Uptrend.
| 5-Year Treasury Note Statistics | SPECULATORS | COMMERCIALS | SMALL TRADERS |
| – Percent of Open Interest Longs: | 8.0 | 82.9 | 6.6 |
| – Percent of Open Interest Shorts: | 39.0 | 54.9 | 3.6 |
| – Net Position: | -2,021,677 | 1,826,517 | 195,160 |
| – Gross Longs: | 522,974 | 5,403,429 | 429,442 |
| – Gross Shorts: | 2,544,651 | 3,576,912 | 234,282 |
| – Long to Short Ratio: | 0.2 to 1 | 1.5 to 1 | 1.8 to 1 |
| NET POSITION TREND: | |||
| – Strength Index Score (3 Year Range Pct): | 0.0 | 97.8 | 87.9 |
| – Strength Index Reading (3 Year Range): | Bearish-Extreme | Bullish-Extreme | Bullish-Extreme |
| NET POSITION MOVEMENT INDEX: | |||
| – 6-Week Change in Strength Index: | -14.8 | 12.3 | 19.7 |
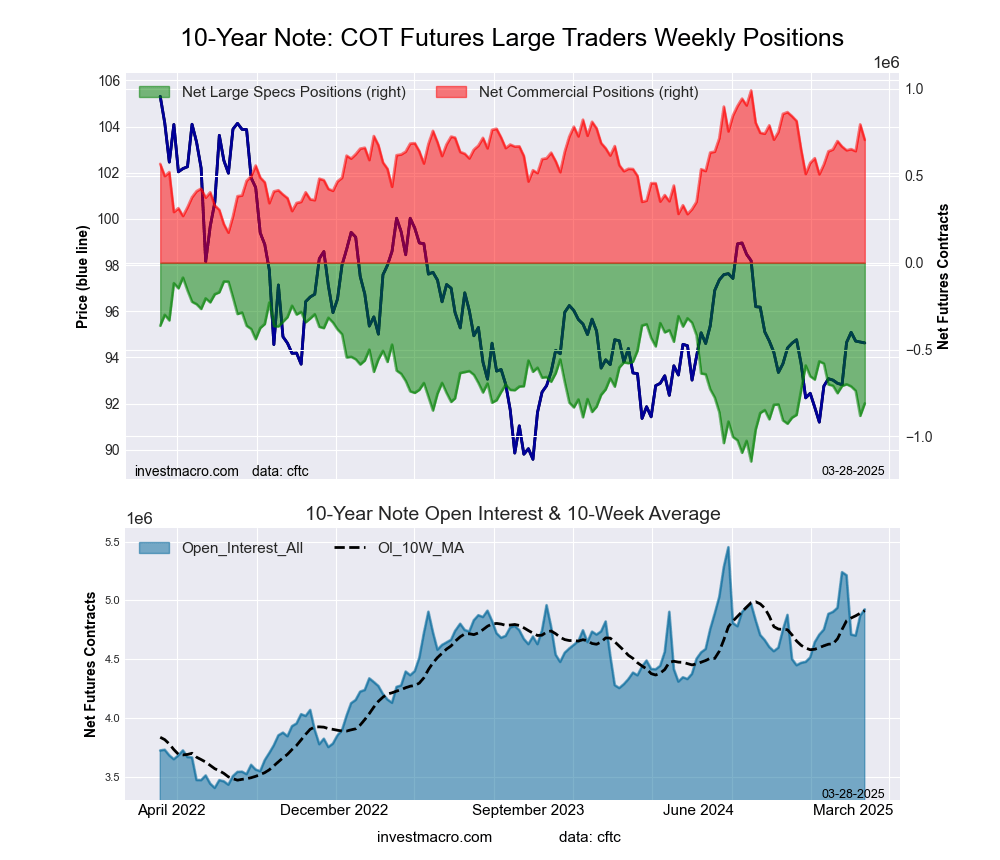
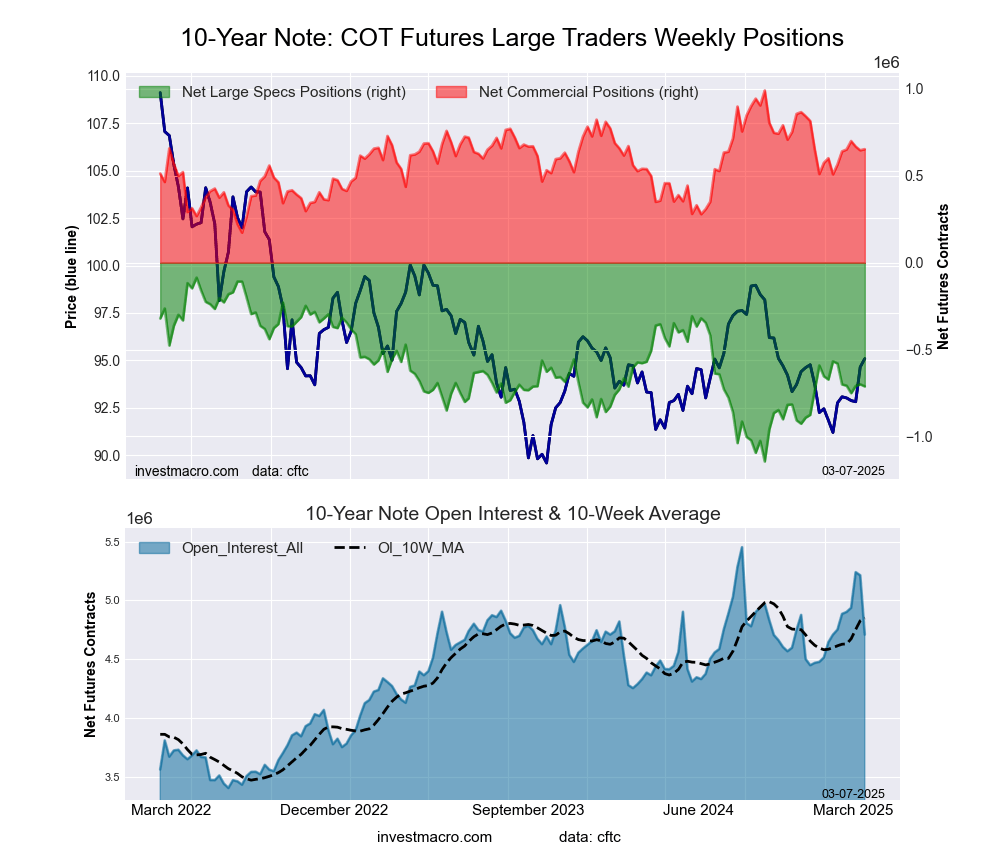
10-Year Treasury Note Futures:
 The 10-Year Treasury Note large speculator standing this week totaled a net position of -863,263 contracts in the data reported through Tuesday. This was a weekly reduction of -53,173 contracts from the previous week which had a total of -810,090 net contracts.
This week’s current strength score (the trader positioning range over the past three years, measured from 0 to 100) shows the speculators are currently Bearish with a score of 26.5 percent. The commercials are Bullish with a score of 69.8 percent and the small traders (not shown in chart) are Bullish-Extreme with a score of 88.9 percent.
Price Trend-Following Model: Strong Uptrend
Our weekly trend-following model classifies the current market price position as: Strong Uptrend.
| 10-Year Treasury Note Statistics | SPECULATORS | COMMERCIALS | SMALL TRADERS |
| – Percent of Open Interest Longs: | 11.5 | 75.9 | 9.8 |
| – Percent of Open Interest Shorts: | 29.1 | 60.7 | 7.3 |
| – Net Position: | -863,263 | 743,611 | 119,652 |
| – Gross Longs: | 562,258 | 3,712,025 | 478,662 |
| – Gross Shorts: | 1,425,521 | 2,968,414 | 359,010 |
| – Long to Short Ratio: | 0.4 to 1 | 1.3 to 1 | 1.3 to 1 |
| NET POSITION TREND: | |||
| – Strength Index Score (3 Year Range Pct): | 26.5 | 69.8 | 88.9 |
| – Strength Index Reading (3 Year Range): | Bearish | Bullish | Bullish-Extreme |
| NET POSITION MOVEMENT INDEX: | |||
| – 6-Week Change in Strength Index: | -14.5 | 9.2 | 21.9 |
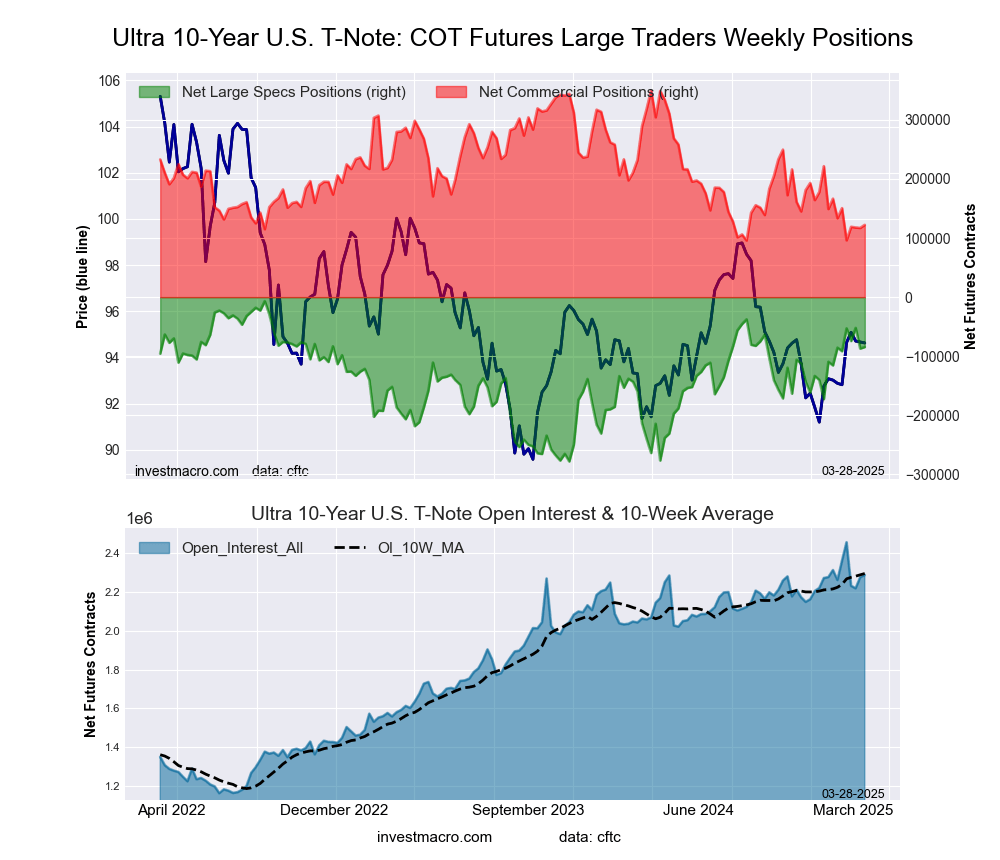
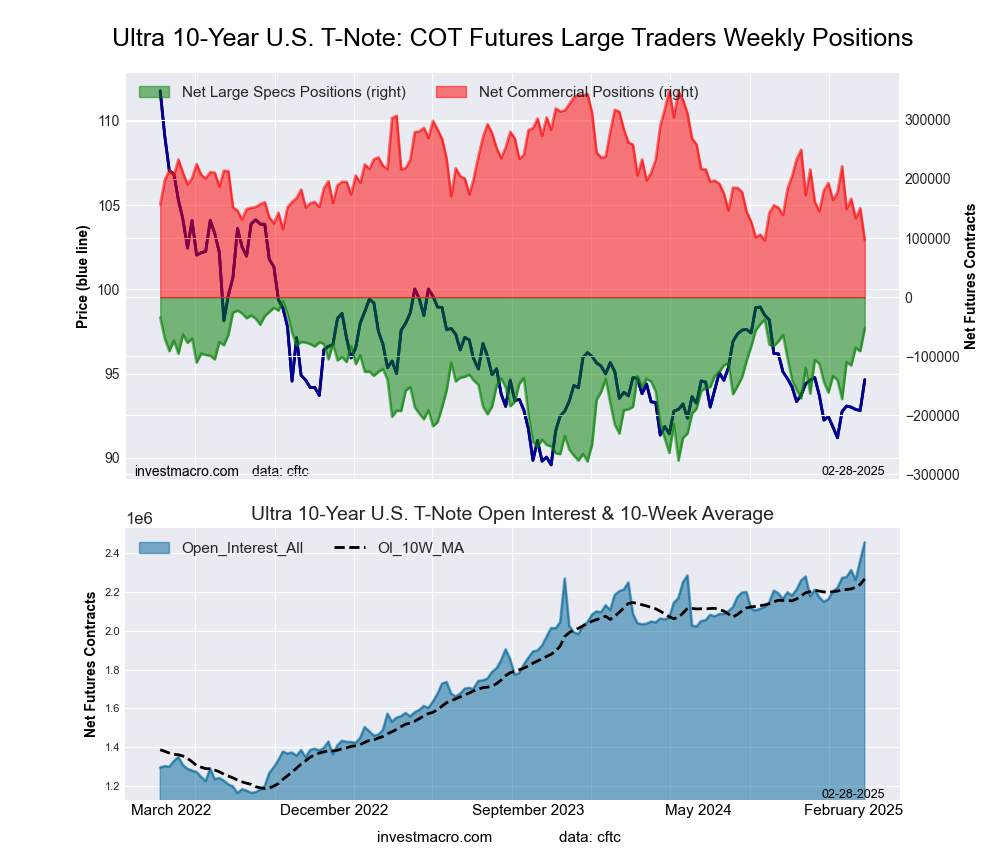
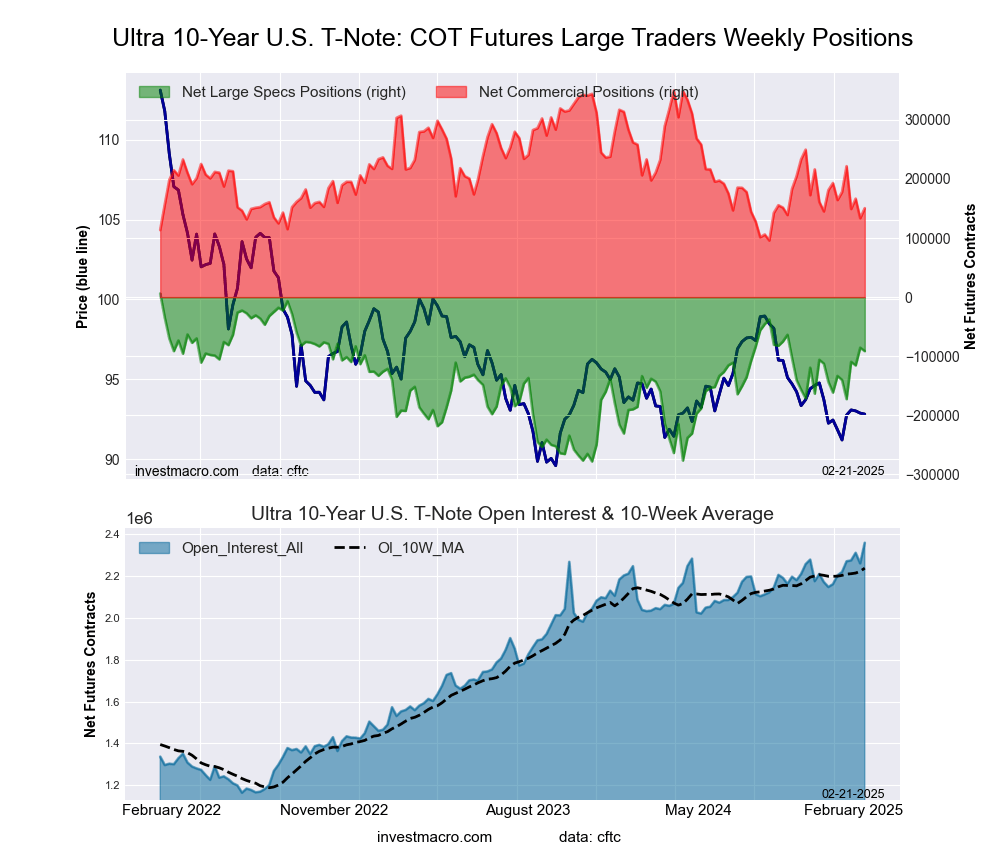
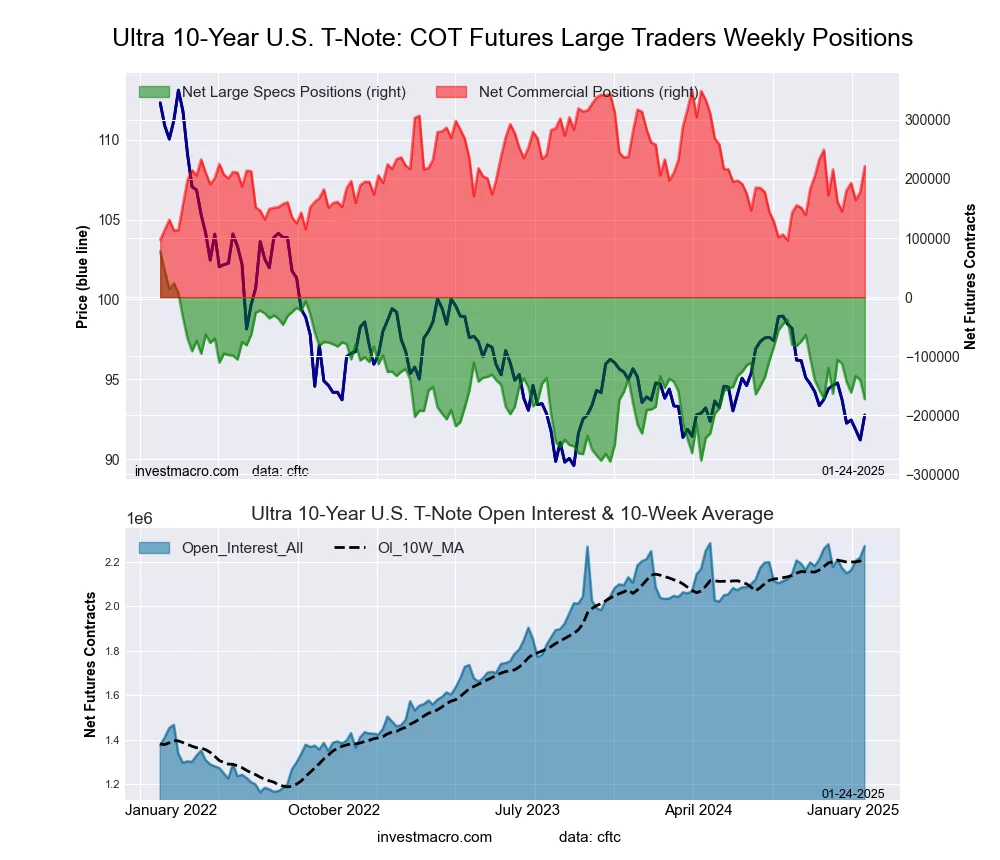
Ultra 10-Year Notes Futures:
 The Ultra 10-Year Notes large speculator standing this week totaled a net position of -105,983 contracts in the data reported through Tuesday. This was a weekly reduction of -21,496 contracts from the previous week which had a total of -84,487 net contracts.
This week’s current strength score (the trader positioning range over the past three years, measured from 0 to 100) shows the speculators are currently Bullish with a score of 63.4 percent. The commercials are Bearish-Extreme with a score of 14.3 percent and the small traders (not shown in chart) are Bullish-Extreme with a score of 96.1 percent.
Price Trend-Following Model: Strong Uptrend
Our weekly trend-following model classifies the current market price position as: Strong Uptrend.
| Ultra 10-Year Notes Statistics | SPECULATORS | COMMERCIALS | SMALL TRADERS |
| – Percent of Open Interest Longs: | 16.1 | 73.6 | 9.7 |
| – Percent of Open Interest Shorts: | 20.7 | 67.9 | 10.9 |
| – Net Position: | -105,983 | 131,932 | -25,949 |
| – Gross Longs: | 373,869 | 1,709,712 | 226,120 |
| – Gross Shorts: | 479,852 | 1,577,780 | 252,069 |
| – Long to Short Ratio: | 0.8 to 1 | 1.1 to 1 | 0.9 to 1 |
| NET POSITION TREND: | |||
| – Strength Index Score (3 Year Range Pct): | 63.4 | 14.3 | 96.1 |
| – Strength Index Reading (3 Year Range): | Bullish | Bearish-Extreme | Bullish-Extreme |
| NET POSITION MOVEMENT INDEX: | |||
| – 6-Week Change in Strength Index: | -5.4 | -7.3 | 25.8 |
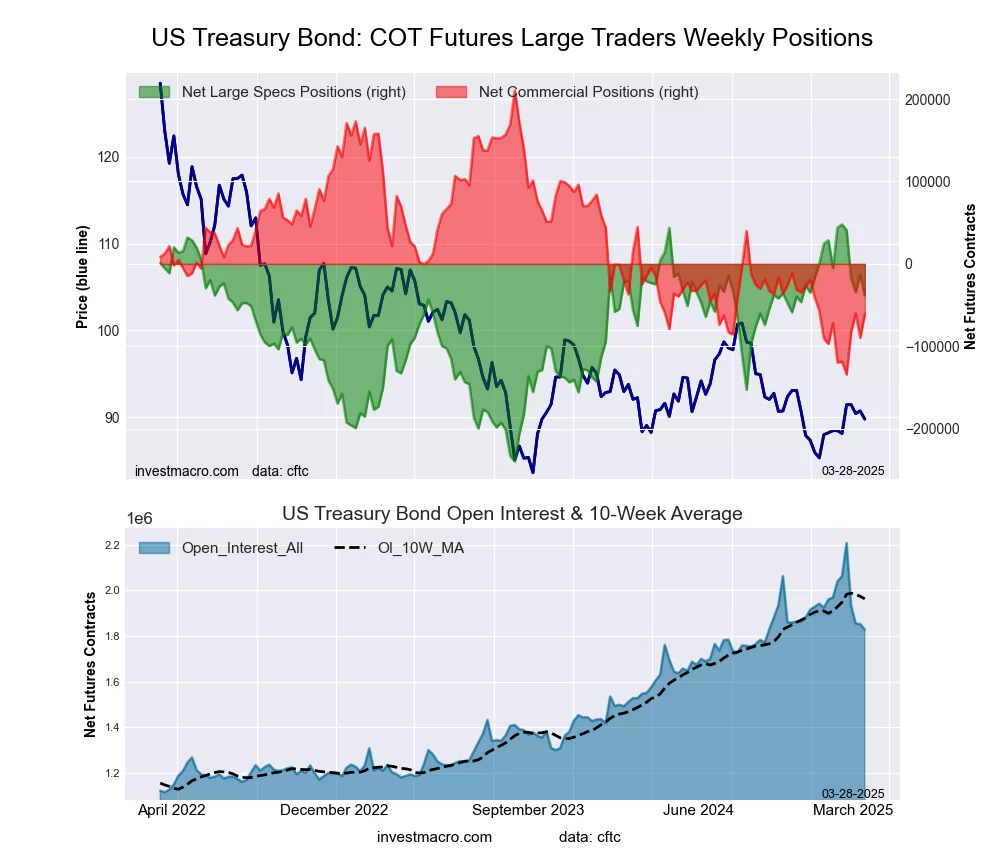
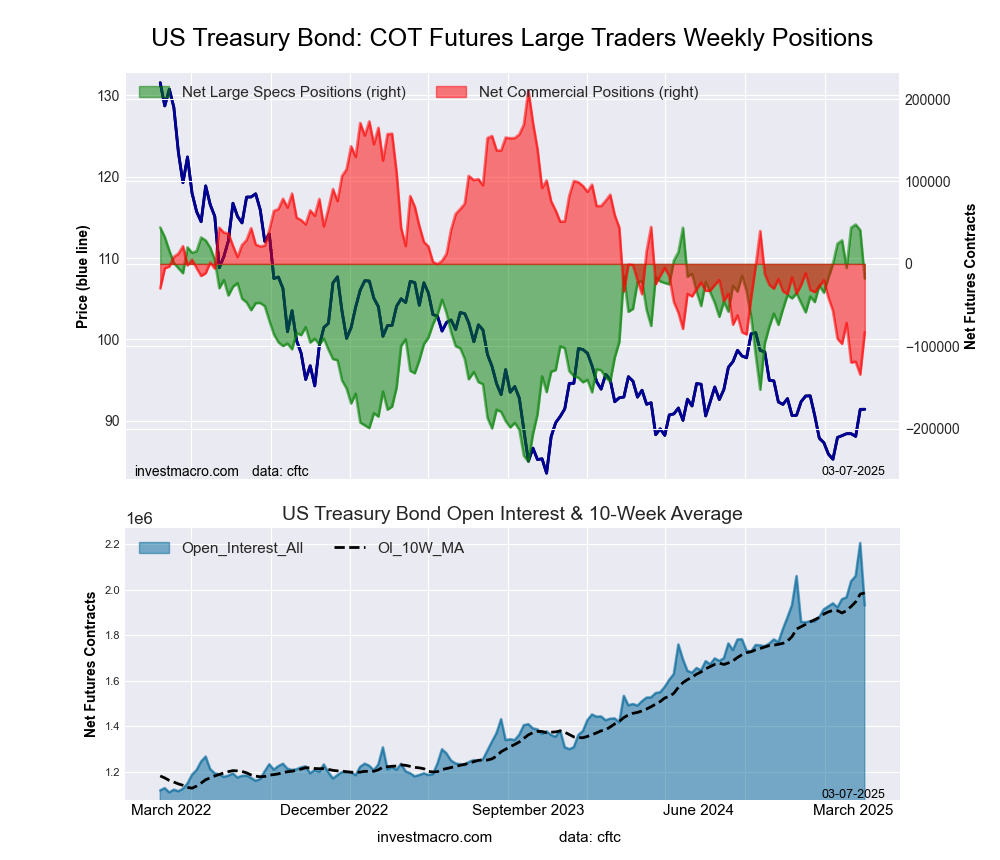
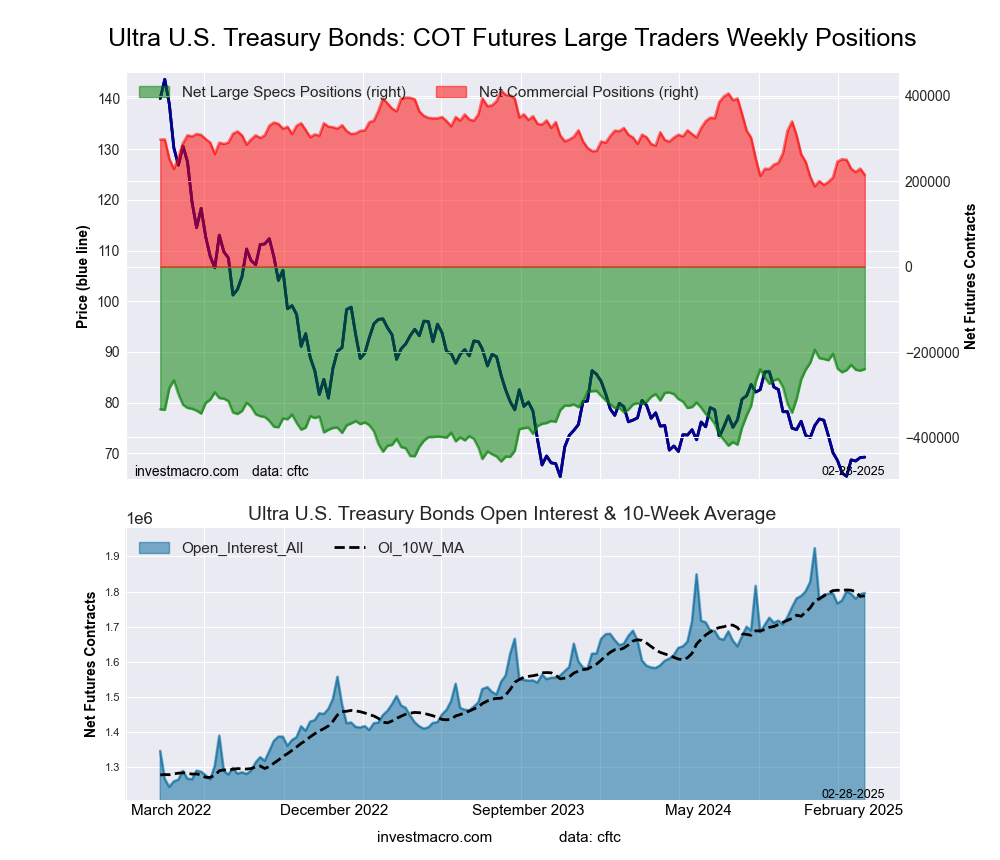
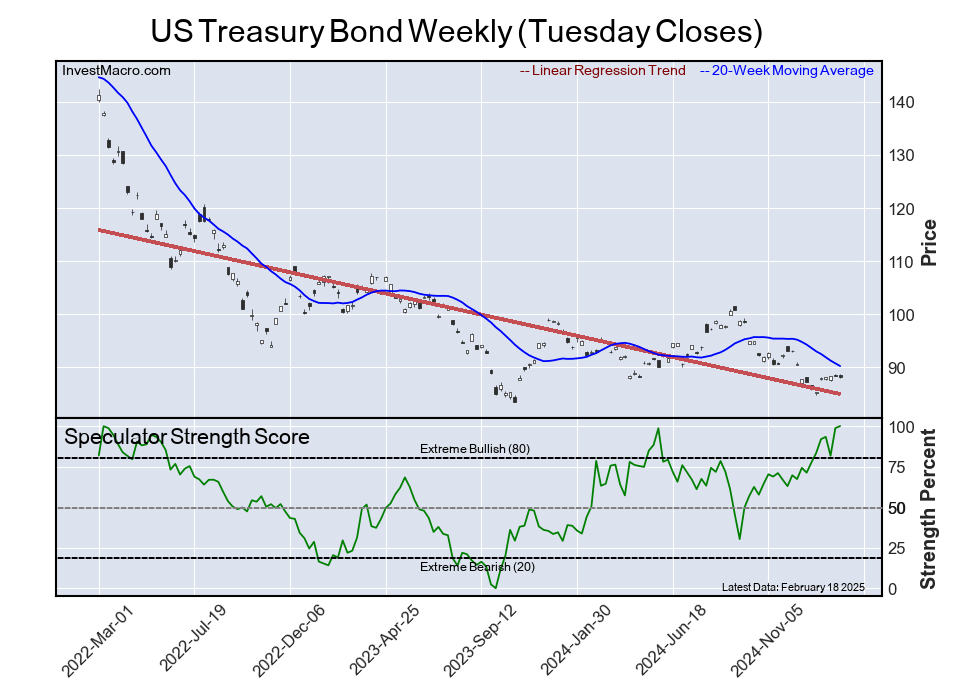
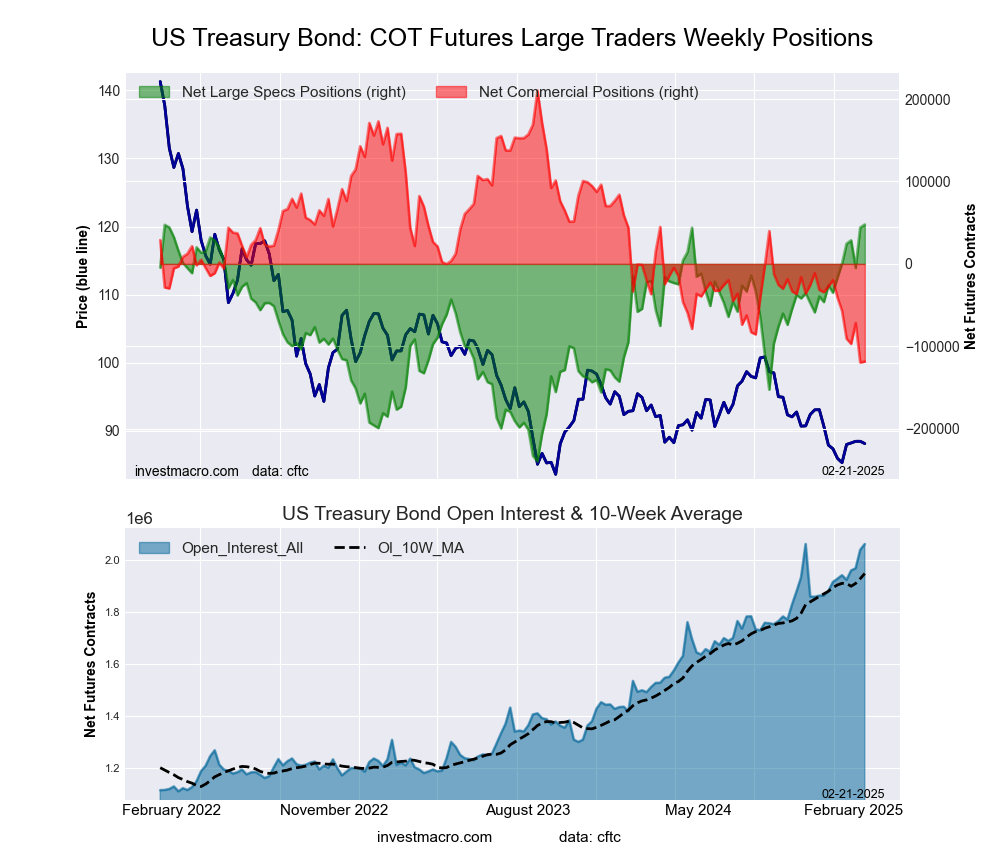
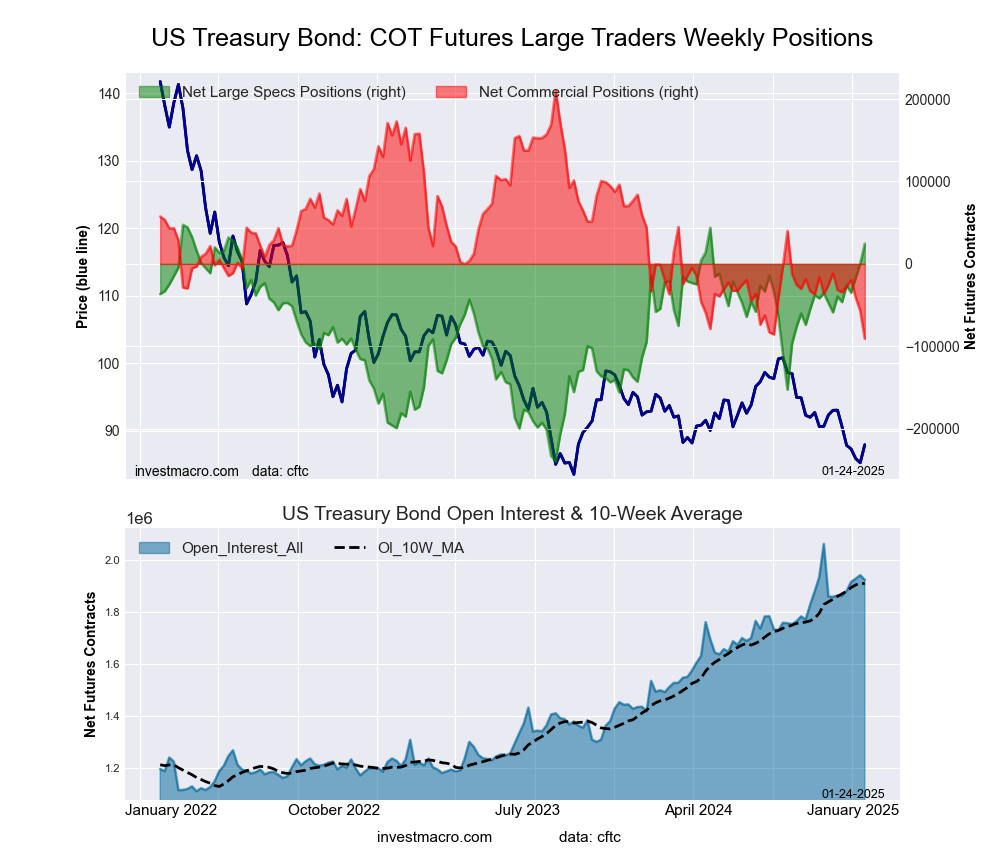
US Treasury Bonds Futures:
 The US Treasury Bonds large speculator standing this week totaled a net position of -32,648 contracts in the data reported through Tuesday. This was a weekly rise of 5,627 contracts from the previous week which had a total of -38,275 net contracts.
This week’s current strength score (the trader positioning range over the past three years, measured from 0 to 100) shows the speculators are currently Bullish with a score of 72.0 percent. The commercials are Bearish-Extreme with a score of 18.4 percent and the small traders (not shown in chart) are Bullish-Extreme with a score of 89.3 percent.
Price Trend-Following Model: Strong Uptrend
Our weekly trend-following model classifies the current market price position as: Strong Uptrend.
| US Treasury Bonds Statistics | SPECULATORS | COMMERCIALS | SMALL TRADERS |
| – Percent of Open Interest Longs: | 13.9 | 72.0 | 12.4 |
| – Percent of Open Interest Shorts: | 15.6 | 75.8 | 6.8 |
| – Net Position: | -32,648 | -70,892 | 103,540 |
| – Gross Longs: | 256,314 | 1,329,948 | 229,567 |
| – Gross Shorts: | 288,962 | 1,400,840 | 126,027 |
| – Long to Short Ratio: | 0.9 to 1 | 0.9 to 1 | 1.8 to 1 |
| NET POSITION TREND: | |||
| – Strength Index Score (3 Year Range Pct): | 72.0 | 18.4 | 89.3 |
| – Strength Index Reading (3 Year Range): | Bullish | Bearish-Extreme | Bullish-Extreme |
| NET POSITION MOVEMENT INDEX: | |||
| – 6-Week Change in Strength Index: | -28.0 | 13.8 | 23.4 |
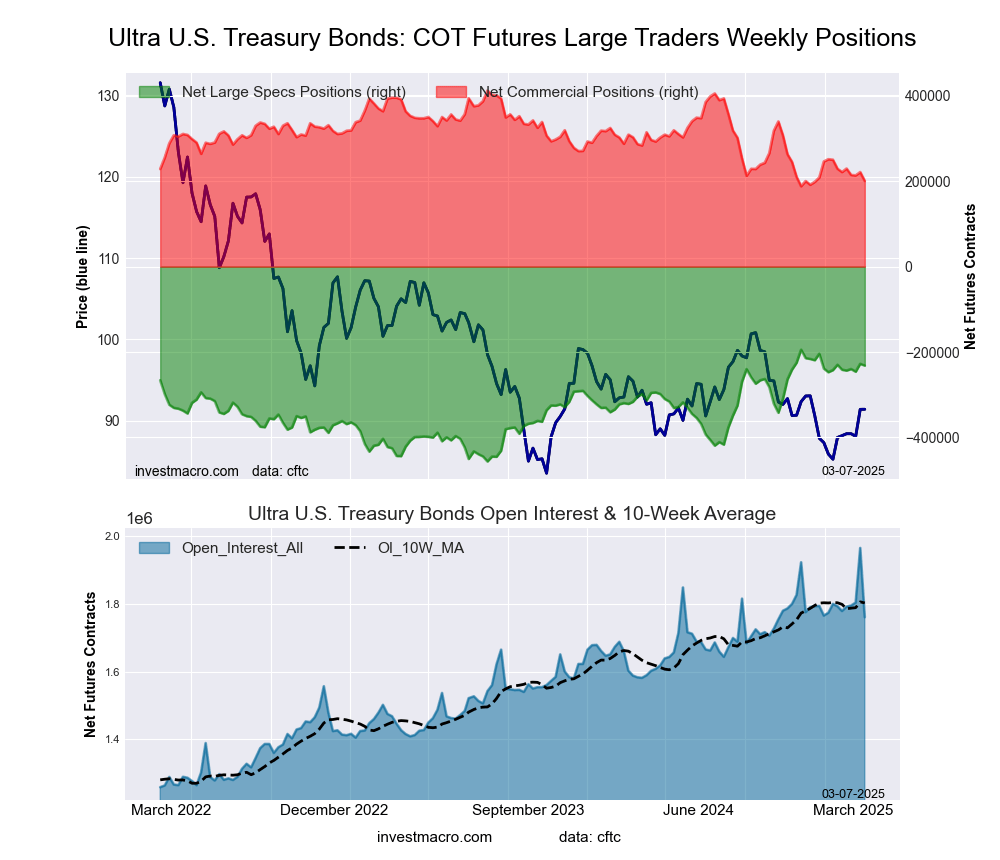
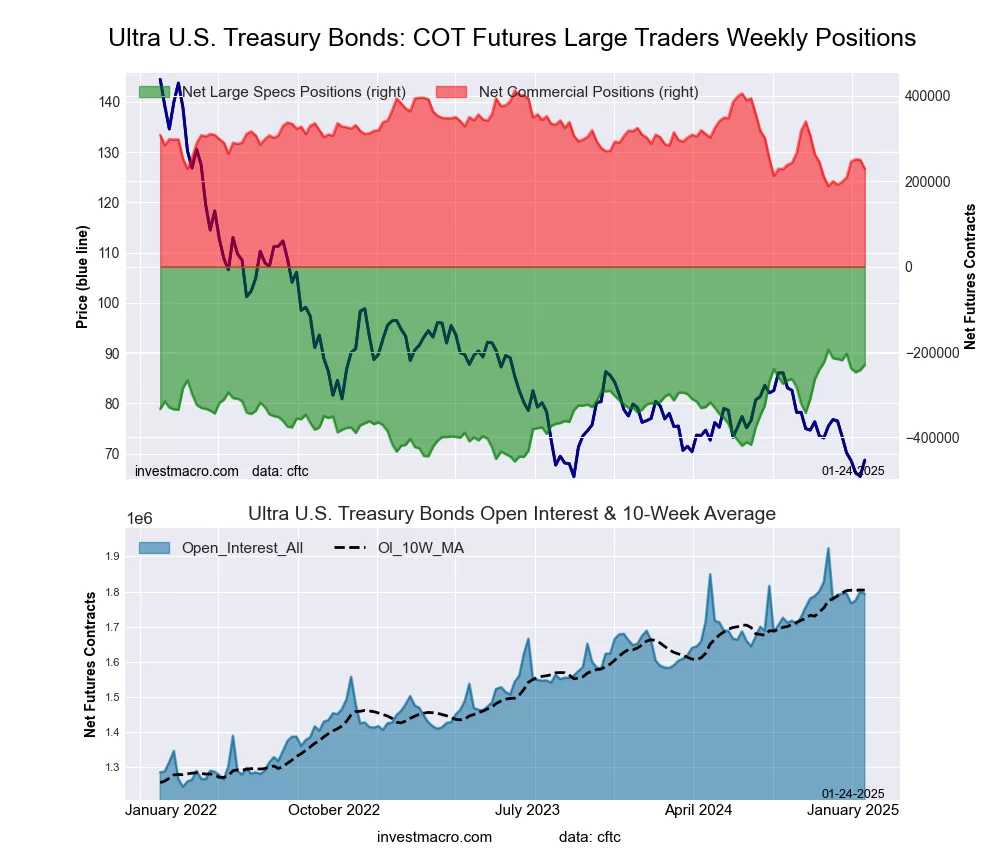
Ultra US Treasury Bonds Futures:
 The Ultra US Treasury Bonds large speculator standing this week totaled a net position of -254,029 contracts in the data reported through Tuesday. This was a weekly reduction of -21,663 contracts from the previous week which had a total of -232,366 net contracts.
This week’s current strength score (the trader positioning range over the past three years, measured from 0 to 100) shows the speculators are currently Bullish with a score of 77.3 percent. The commercials are Bearish-Extreme with a score of 15.4 percent and the small traders (not shown in chart) are Bullish with a score of 52.7 percent.
Price Trend-Following Model: Strong Uptrend
Our weekly trend-following model classifies the current market price position as: Strong Uptrend.
| Ultra US Treasury Bonds Statistics | SPECULATORS | COMMERCIALS | SMALL TRADERS |
| – Percent of Open Interest Longs: | 7.8 | 82.0 | 9.7 |
| – Percent of Open Interest Shorts: | 21.8 | 69.7 | 8.0 |
| – Net Position: | -254,029 | 222,692 | 31,337 |
| – Gross Longs: | 142,242 | 1,487,582 | 176,801 |
| – Gross Shorts: | 396,271 | 1,264,890 | 145,464 |
| – Long to Short Ratio: | 0.4 to 1 | 1.2 to 1 | 1.2 to 1 |
| NET POSITION TREND: | |||
| – Strength Index Score (3 Year Range Pct): | 77.3 | 15.4 | 52.7 |
| – Strength Index Reading (3 Year Range): | Bullish | Bearish-Extreme | Bullish |
| NET POSITION MOVEMENT INDEX: | |||
| – 6-Week Change in Strength Index: | -3.0 | 4.0 | -1.6 |
Article By InvestMacro – Receive our weekly COT Newsletter
*COT Report: The COT data, released weekly to the public each Friday, is updated through the most recent Tuesday (data is 3 days old) and shows a quick view of how large speculators or non-commercials (for-profit traders) were positioned in the futures markets.
The CFTC categorizes trader positions according to commercial hedgers (traders who use futures contracts for hedging as part of the business), non-commercials (large traders who speculate to realize trading profits) and nonreportable traders (usually small traders/speculators) as well as their open interest (contracts open in the market at time of reporting). See CFTC criteria here.